
Where building heights come from, and how wrong they are
Problem statement
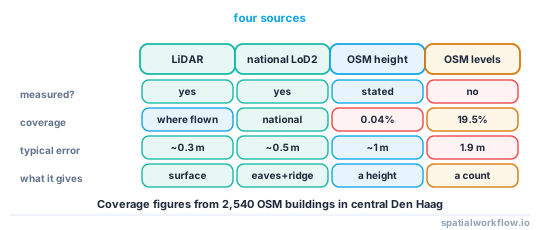
Every 3D building analysis starts with a height, and the height is almost always estimated. The four sources — OpenStreetMap tags, LiDAR, national 3D products and floor-count rules — have different coverage, different definitions and different errors, and mixing them without saying so produces a model whose accuracy nobody can state.
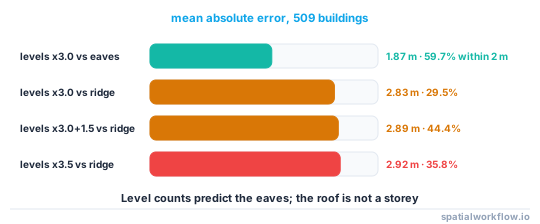
Two numbers make the scale of the problem concrete. In central The Hague, 496 of 2,540 OpenStreetMap buildings carry building:levels — 19.5% — and exactly one carries height. And of the buildings that do have a level count, estimating height as levels × 3 m predicts the eaves to within 2 m for 59.7% of them and the ridge for only 29.5%.
This guide covers each source, what it measures, and how to record the uncertainty rather than hiding it.
Quick answer
Use the best source available per building, and record which one:
import numpy as np, pandas as pd

def best_height(row):
    if pd.notna(row.get("lidar_p95")):
        return row["lidar_p95"] - row["ground_z"], "lidar"
    if pd.notna(row.get("osm_height")):
        return float(row["osm_height"]), "osm:height"
    if pd.notna(row.get("osm_levels")):
        return float(row["osm_levels"]) * 3.0, "osm:levels x3"
    return np.nan, "unknown"

b[["height_m", "height_source"]] = b.apply(
    lambda r: pd.Series(best_height(r)), axis=1)
print(b["height_source"].value_counts())
A height_source column costs one column and turns "the model says 12 m" into "the model says 12 m, estimated from a level count".
Step-by-step solution
1. Decide which height you mean
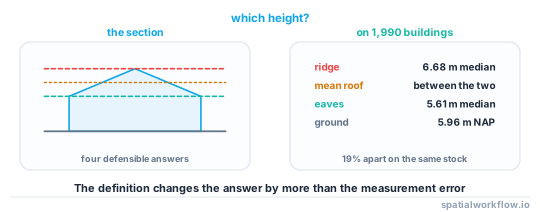
Eaves, ridge, mean roof, or the top of a parapet. On a real LoD2 tile the median eaves height was 5.61 m above ground and the median ridge 6.68 m — the same buildings, 19% apart. Every downstream number inherits this choice.
2. Prefer a measured source
LiDAR gives you the actual surface. The standard recipe is the 95th percentile of first-return heights inside the footprint minus the local terrain height, with the percentile rather than the maximum so that a chimney or an aerial does not set the building height.
3. Know what the national product used
An LoD1 or LoD2 national product has a documented height definition and an accuracy figure. Read it: some use the 50th percentile of roof points, some the 70th, some the ridge.
4. Treat OSM tags as sparse but exact where present
height is metres and is almost always right when it exists; it just rarely exists. In the tile examined, 1 of 2,540 buildings had it. building:levels is far commoner at 19.5%, and is a count, not a height.
5. Calibrate the storey height locally, do not assume 3 m
Dividing measured height by level count on the buildings that have both gives the local figure directly. On the Hague sample that was 2.74 m per level to the eaves and 3.26 m per level to the ridge. Using 3.0 m against the eaves gave a median error of +0.47 m and a mean absolute error of 1.87 m.
6. Do not use level counts to estimate ridge height
The roof is not in the level count. Estimating ridge height from levels × 3.0 m had a mean absolute error of 2.83 m against 1.87 m for the eaves, and only 29.5% of buildings within 2 m.
7. Record the source and the uncertainty per building
A height_source and a height_sigma_m column make every downstream product honest, and let a user filter to the buildings whose heights were measured.
Code examples
Example 1 — heights from LiDAR, done defensibly
import numpy as np, geopandas as gpd, laspy
from shapely.geometry import Point

def heights_from_lidar(buildings, las_path, percentile=95, min_points=20):
    las = laspy.read(las_path)
    keep = las.return_number == 1
    pts = gpd.GeoDataFrame(
        {"z": las.z[keep]},
        geometry=gpd.points_from_xy(las.x[keep], las.y[keep]),
        crs=buildings.crs,
    )
    joined = gpd.sjoin(pts, buildings[["id", "geometry"]], predicate="within")
    stats = joined.groupby("id")["z"].agg(
        n="size", top=lambda s: np.percentile(s, percentile))
    stats = stats[stats["n"] >= min_points]
    out = buildings.merge(stats, left_on="id", right_index=True, how="left")
    out["height_m"] = out["top"] - out["ground_z"]
    out["height_source"] = np.where(out["height_m"].notna(),
                                    f"lidar p{percentile}", "unknown")
    return out
min_points matters: a footprint with three returns inside it gives a height that is noise. Report how many buildings fell below the threshold.
Example 2 — calibrate the storey height against measured data
import pandas as pd

both = b.dropna(subset=["levels_n", "measured_eaves_m", "measured_ridge_m"])
print(f"buildings with both a level count and a measured height: {len(both):,}")
print(f"implied storey height to eaves : {(both.measured_eaves_m / both.levels_n).median():.2f} m")
print(f"implied storey height to ridge : {(both.measured_ridge_m / both.levels_n).median():.2f} m")

for per_level, target in [(3.0, "measured_eaves_m"), (3.0, "measured_ridge_m"),
                          (3.5, "measured_ridge_m")]:
    err = both.levels_n * per_level - both[target]
    print(f"{per_level} m/level vs {target:20} median {err.median():+.2f} m, "
          f"MAE {err.abs().mean():.2f} m, within 2 m {(err.abs() < 2).mean():.1%}")
buildings with both a level count and a measured height: 509
implied storey height to eaves : 2.74 m
implied storey height to ridge : 3.26 m
3.0 m/level vs measured_eaves_m median +0.47 m, MAE 1.87 m, within 2 m 59.7%
3.0 m/level vs measured_ridge_m median -0.69 m, MAE 2.83 m, within 2 m 29.5%
3.5 m/level vs measured_ridge_m median +0.54 m, MAE 2.92 m, within 2 m 35.8%
Example 3 — an uncertainty column the rest of the pipeline can use
SIGMA = {"lidar p95": 0.4, "national lod2": 0.5, "osm:height": 1.0,
         "osm:levels x3": 1.9, "unknown": np.nan}

b["height_sigma_m"] = b["height_source"].map(SIGMA)
b["volume_m3"] = b.area * b["height_m"]
b["volume_sigma_m3"] = b.area * b["height_sigma_m"]

print(b.groupby("height_source")[["height_m", "height_sigma_m"]].median().round(2))
The 1.9 m for level-derived heights is the measured mean absolute error above, not a guess. Carrying it forward means a total volume can be quoted with an interval instead of a false precision.
Explanation
Why level counts predict eaves and not ridge
A storey is a habitable floor; the roof above the top storey is not one. Level counts therefore encode the height to the top of the last floor, which is approximately the eaves. Adding a roof height to the estimate helps on average — levels × 3.0 + 1.5 raised the within-2-m share from 29.5% to 44.4% against the ridge — but the roof height varies more than the storey height does, so the estimate stays poor.
Why 3 m per storey is usually too generous
Residential storeys in most European housing stock are 2.5–2.8 m floor to floor. The Hague sample implies 2.74 m to the eaves. Commercial and industrial buildings are taller, so a single constant across mixed stock has a bimodal error — which is a good reason to calibrate per building class rather than per city.
Why the 95th percentile rather than the maximum
A LiDAR return on a chimney, an aerial, a lift overrun or a bird sets the maximum. The 95th percentile of first returns inside the footprint is stable, and the choice of percentile should be stated because it changes the answer: p50 gives roughly the eaves on a pitched roof, p95 roughly the ridge.
Why the source column is worth more than a better estimate
A model whose heights are 2 m out and whose metadata says so is usable: a user can propagate the error, filter to the measured buildings, or decide the analysis tolerates it. A model whose heights are 2 m out and claims nothing is a trap. Recording the source costs one column.
Edge cases or notes
- Basements are not levels.
building:levelsexcludes them;building:levels:undergroundis separate. heightin OSM may carry units."12 m"and"40'"both appear.roof:levelsis additional, not included inbuilding:levels.- Terrain slope makes "height above ground" ambiguous. State which ground.
- Tall single-storey buildings break every rule. Churches, warehouses, sports halls.
- Parapets add a metre on flat-roofed buildings and are in the LiDAR.
- Trees overhanging a footprint inflate LiDAR heights. Filter by return number and classification.
- Old models miss new buildings entirely. A height of NaN is better than a height from 2015.
Internal links
- How to get building heights from LiDAR in Python — the measured route in full
- Level of detail explained for 3D city models — what national products give you
- How to extrude building footprints into 3D in Python — using the height
- 3D spatial data models explained: 2.5D, meshes and solids — why 2.5D needs exactly one number
- Extruded buildings float above or sink into the ground — the ground half of the problem
- The OpenStreetMap data model explained — where the tags come from
- LiDAR surfaces explained: DSM, DTM and CHM — DSM minus DTM
- How to calculate building volumes and floor area in Python — what the error propagates into
FAQ
Where do building heights come from?
Four sources: LiDAR or photogrammetry (measured), national 3D products (measured, with a documented definition), OpenStreetMap height tags (sparse but reliable), and floor counts converted with a storey-height rule (common and weak).
How many OpenStreetMap buildings have a height?
Very few. In a central Den Haag sample of 2,540 buildings, one had height and 496 — 19.5% — had building:levels.
How accurate is levels × 3 m?
Against measured eaves heights it had a mean absolute error of 1.87 m with 59.7% within 2 m. Against ridge heights it was far worse: 2.83 m and 29.5%.
What storey height should I use?
Calibrate it against buildings that have both a level count and a measured height. One real sample implied 2.74 m per level to the eaves.
Should I use the maximum LiDAR return for building height?
No. Use a percentile — commonly the 95th of first returns inside the footprint — so a chimney or an aerial does not set the height.
Do I need to record where each height came from?
Yes. A height_source column plus a per-source uncertainty is what lets anyone downstream state the accuracy of a volume or a shadow.