
How to Get the Elevation of Coordinates in Python
On this page
Problem statement
How high is this point above sea level? Elevation enriches GPS tracks, sensor sites, sample locations and any list of coordinates, and free APIs answer it from global digital elevation models without downloading terrain tiles. The answer is the height of the model's cell, not of the point: a 90 m cell averages a mountain summit down and a narrow valley up, and on built-up land or under forest the model may include buildings and trees. Knowing how close the numbers get to surveyed heights is part of using them.
This page queries the Open-Meteo elevation API, which serves the Copernicus 90 m global DEM, for every large airport in OurAirports in batches, compares the results with the airports' published elevations, looks at where they differ most, and tests the API on a mountain summit where a 90 m model cannot reach the top.
Quick answer
Send up to 100 coordinates per request as comma-separated lists; elevation(), defined in the setup below, does that and caches each answer:
print(elevation([AP.loc["DEN", "latitude_deg"], AP.loc["LPB", "latitude_deg"], AP.loc["AMS", "latitude_deg"]],
                [AP.loc["DEN", "longitude_deg"], AP.loc["LPB", "longitude_deg"], AP.loc["AMS", "longitude_deg"]]))
[1633.0, 4035.0, 6.0]
Denver comes out at 1,633 m, La Paz–El Alto at 4,035 m and Amsterdam Schiphol at 6 m.
Batches, published elevations, largest disagreements
1. Every airport, in batches
The setup fetched elevations for all airports 100 at a time and saved them. Summarise:
print(f"airports: {len(AP):,}; elevation from the DEM: min {AP.dem_m.min():.0f} m, median {AP.dem_m.median():.0f} m, max {AP.dem_m.max():,.0f} m")
print(AP.nlargest(3, "dem_m")[["municipality", "dem_m", "published_m"]].round(0).to_string())
print(f"below sea level: {(AP.dem_m < 0).sum()}: {', '.join(AP[AP.dem_m < 0].index[:6])}")
airports: 1,172; elevation from the DEM: min -23 m, median 74 m, max 4,035 m
municipality dem_m published_m
iata_code
LPB La Paz / El Alto 4035.0 4071.0
JUL Juliaca 3827.0 3826.0
RKZ Xigazê (Samzhubzê) 3800.0 3782.0
below sea level: 9: RTM, NKC, MSY, OAK, LCA, HNL
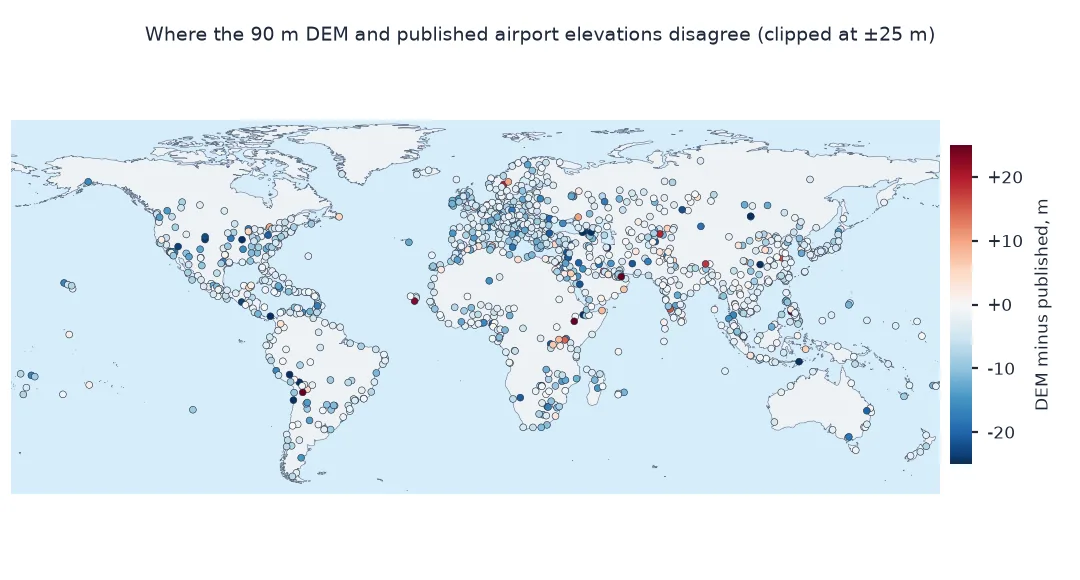
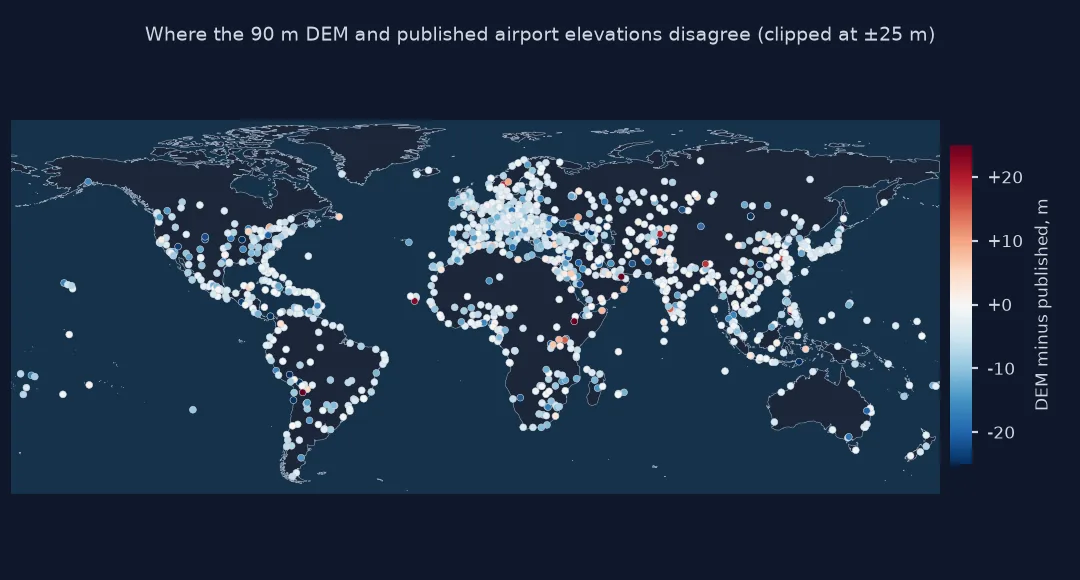
The highest large airport by the DEM is La Paz–El Alto, 4,035 m, 36 m below its published elevation; Juliaca and Xigazê are above 3,800 m. Nine airports come out below sea level, from Rotterdam, in a polder, to coastal airports such as Oakland and Honolulu, where the 90 m cell can take in water or reclaimed land.
2. Against published elevations
OurAirports gives each airport's published elevation in feet, usually the highest point of the landing area. Convert and compare:
AP["diff_m"] = AP.dem_m - AP.published_m
ok = AP.published_m.notna()
print(f"compared: {ok.sum():,}; median difference {AP.diff_m[ok].median():+.1f} m; median absolute {AP.diff_m[ok].abs().median():.1f} m")
for t in (5, 10, 25, 50):
    print(f"within {t:>2} m: {(AP.diff_m[ok].abs() <= t).mean():.0%}")
compared: 1,166; median difference -3.3 m; median absolute 3.7 m
within 5 m: 61%
within 10 m: 82%
within 25 m: 99%
within 50 m: 100%
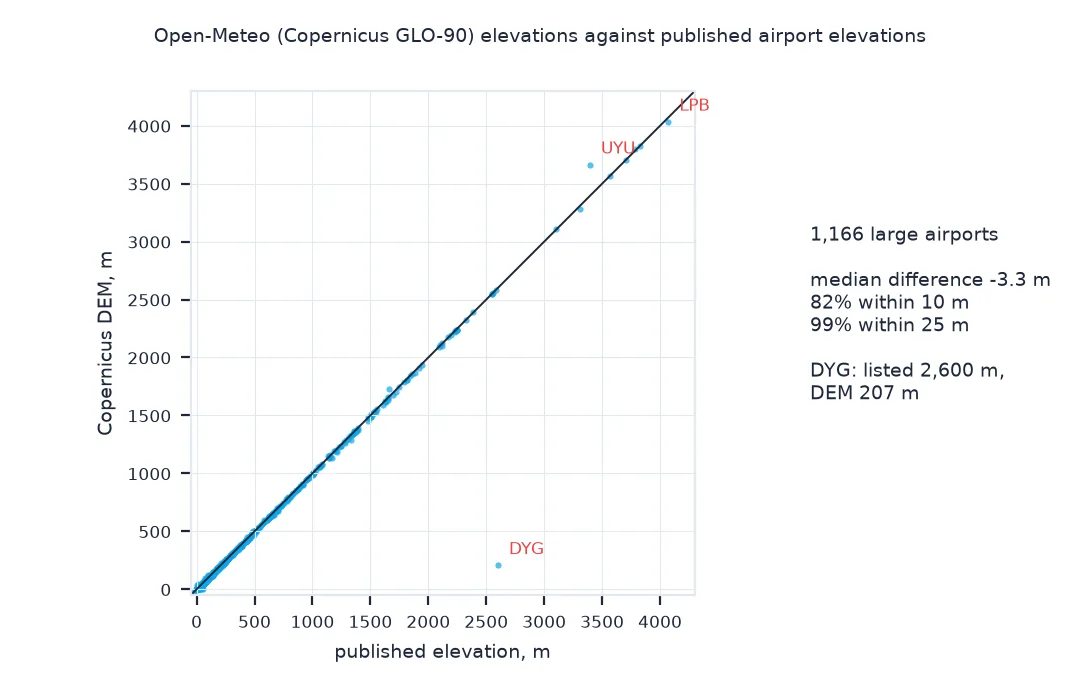
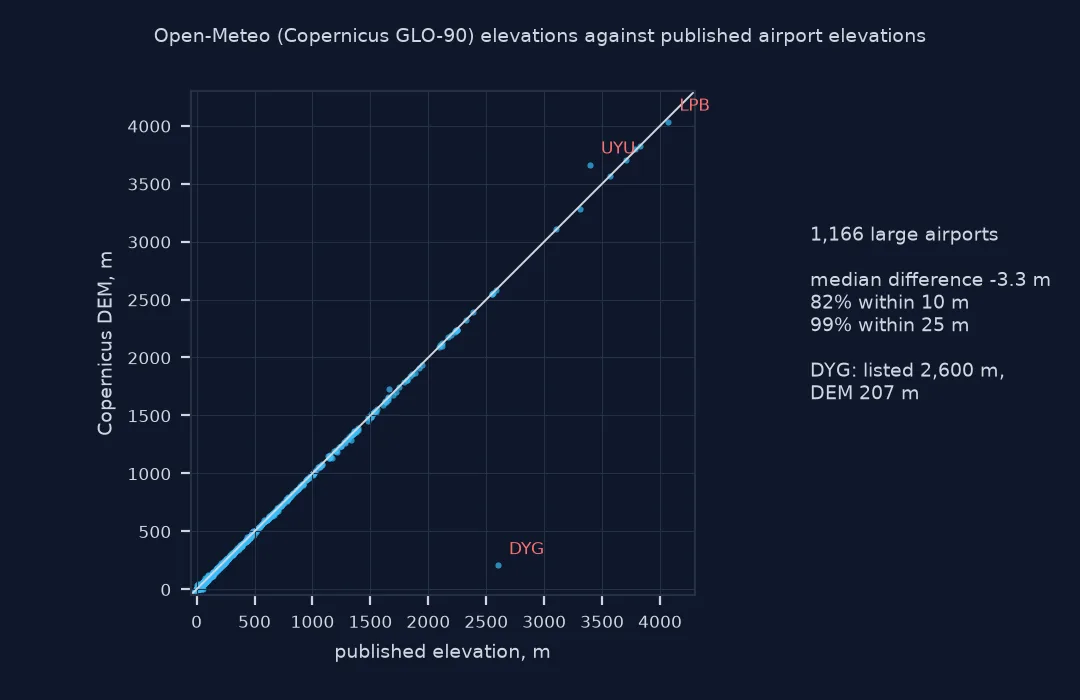
The DEM is a median 3.3 m below the published elevation, which is the highest point of the landing area, and the median absolute difference is 3.7 m. 82% of airports agree within 10 m and 99% within 25 m; only four differ by more than 50 m.
3. The largest disagreements
List the airports where the DEM and the published elevation differ most, and look for a reason in the coordinates:
worst = AP[ok].reindex(AP.diff_m[ok].abs().nlargest(6).index)
print(worst[["name", "dem_m", "published_m", "diff_m"]].round(0).to_string())
name dem_m published_m diff_m
iata_code
DYG Zhangjiajie Hehua International Airport 207.0 2600.0 -2393.0
UYU Joya Andina International Airport 3665.0 3394.0 271.0
AWA Hawassa International Airport 1727.0 1661.0 66.0
NMI Navi Mumbai International Airport 1.0 56.0 -55.0
DIL Presidente Nicolau Lobato International Airport 6.0 47.0 -41.0
ULN Buyant-Ukhaa International Airport 1292.0 1330.0 -38.0
The two largest differences look like errors in the published values, not the DEM. OurAirports lists Zhangjiajie at 8,530 ft, 2,600 m, while the DEM gives 207 m; at 2,600 m it would be one of the highest airports in the world, so the listed value is very likely an entry error; Uyuni's listed 11,136 ft, 3,394 m, is 271 m below the DEM's 3,665 m, the altitude of the Altiplano around it. The rest, 38 to 66 m, are airports on slopes or plateau edges where a 90 m cell and the runway's highest point differ.
A summit the model cannot reach
The data used on this page
The large airports with an IATA code in OurAirports, a public-domain database, with their published elevations in feet, and the Open-Meteo elevation API, which serves the Copernicus DEM GLO-90 and is free for non-commercial use without a key. The setup saves the API's answers so later runs need no requests.
import hashlib
import json
import time
from pathlib import Path

import numpy as np
import pandas as pd
import requests

Path("data").mkdir(exist_ok=True)
p = Path("data/airports.csv")
if not p.exists():
    r = requests.get("https://davidmegginson.github.io/ourairports-data/airports.csv", timeout=300)
    r.raise_for_status()
    p.write_bytes(r.content)
AP = pd.read_csv(p, keep_default_na=False, na_values=[""])
AP = AP[(AP.type == "large_airport") & AP.iata_code.notna()].set_index("iata_code")
AP["published_m"] = AP.elevation_ft * 0.3048
def elevation(lats, lons):
    """Elevations for up to 100 points from Open-Meteo, cached on disk; waits out the per-minute limit."""
    params = {"latitude": ",".join(f"{v:.5f}" for v in lats), "longitude": ",".join(f"{v:.5f}" for v in lons)}
    key = Path(f"data/openmeteo_elev_{hashlib.md5((params['latitude'] + params['longitude']).encode()).hexdigest()[:12]}.json")
    if not key.exists():
        for attempt in range(5):
            r = requests.get("https://api.open-meteo.com/v1/elevation", params=params, timeout=60)
            if r.status_code != 429:
                break
            time.sleep(65)                                             # the free tier counts each coordinate per minute
        r.raise_for_status()
        key.write_text(json.dumps(r.json()["elevation"]))
        time.sleep(20)
    return json.loads(key.read_text())
cache = Path("data/openmeteo_elevation_large_airports.json")
if not cache.exists():
    out = []
    for i in range(0, len(AP), 100):
        b = AP.iloc[i:i + 100]
        out += elevation(b.latitude_deg, b.longitude_deg)
    cache.write_text(json.dumps(dict(zip(AP.index, out))))
AP["dem_m"] = pd.Series(json.loads(cache.read_text()))
print(f"{len(AP):,} large airports; {AP.dem_m.notna().sum():,} elevations from the API; {AP.published_m.notna().sum():,} published")
1,172 large airports; 1,172 elevations from the API; 1,166 published
The API returned an elevation for all 1,172 airports; OurAirports has a published elevation for 1,166. At the free tier's per-minute limit, the first run takes about four minutes.
Example 1: a summit the model cannot reach
A 90 m cell averages the terrain around a peak. Ask for Everest's summit and compare with its surveyed height of 8,848.86 m (the 2020 China-Nepal survey):
dem = elevation([27.98806], [86.92528])[0]
print(f"Everest summit: DEM {dem:,.0f} m, surveyed 8,848.86 m, difference {dem - 8848.86:+,.0f} m")
Everest summit: DEM 8,724 m, surveyed 8,848.86 m, difference -125 m
At Everest's summit coordinates the DEM returns 8,724 m, 125 m below the surveyed 8,848.86 m: the 90 m cell averages the summit with the slopes around it.
A DEM returns a cell, not a point
A digital elevation model is a grid; an elevation service returns the value of the cell containing the point, or an interpolation between neighbouring cells. The Copernicus DEM is a surface model derived from TanDEM-X radar, so over forests and cities it measures the top of the canopy or the roofs, smoothed to 90 m. Published airport elevations are surveyed heights of the runway system's highest point. On flat, open airfields the two agree to within a few metres; where an airport sits on a slope, beside a cliff, or where its listed coordinates point at a terminal or a city centre instead of the runway, they can differ by tens or hundreds of metres.
Heights also have a datum. The Copernicus DEM gives heights above the EGM2008 geoid, close to mean sea level; GPS receivers report heights above the WGS84 ellipsoid, which differ from the geoid by up to about 100 m depending on location. Mixing the two is a common source of "my GPS altitude disagrees with the map" by tens of metres. For summits, ridges and other sharp features, a 90 m model is a poor tool: it smooths peaks down, as the Everest example shows, and a 30 m model or a local lidar survey is needed.
Ocean points, rate limits and units
- Ocean points: the Copernicus DEM gives 0 over the sea; it is not a bathymetry model.
- Rate limits: free APIs cap requests per minute and per day; batch coordinates and cache the answers.
- Units: OurAirports gives feet; 1 ft = 0.3048 m exactly.
- Offline: for many points, download DEM tiles and sample them with rasterio instead of calling an API.
Internal links
- How to extract an elevation profile along a line in Python — sampling a DEM yourself
- Digital elevation models explained — what the grid contains
- Latitude and longitude explained — the third coordinate
FAQ
How do I get elevation from latitude and longitude in Python?
Call an elevation API such as Open-Meteo's (https://api.open-meteo.com/v1/elevation?latitude=..&longitude=..) with up to 100 coordinates per request, or sample a downloaded DEM with rasterio.
How accurate are elevation APIs?
At airports the Copernicus 90 m DEM is within a few metres of published elevations for most sites, with larger errors on slopes, near cliffs and where coordinates are imprecise; step 2 gives the distribution.
Why is the elevation of a mountain too low?
The DEM averages each 90 m cell, so a sharp summit is lowered; Everest comes out 125 m short.
Is the elevation above sea level or the ellipsoid?
Copernicus DEM heights are above the EGM2008 geoid, approximately mean sea level; GPS heights are above the ellipsoid.