
OpenStreetMap Data Completeness Explained
On this page
Problem statement
"Is OpenStreetMap complete here?" is the first question anyone should ask before counting, measuring or routing with OSM data, and it has no single answer. Completeness differs by feature type, by attribute and by place. A city's roads can be fully mapped while its building heights are mostly missing, its shops well covered and its opening hours sparse. Measuring it takes two kinds of check: extrinsic, comparing OSM with an independent reference, and intrinsic, reading OSM's own history and tags for signs of saturation.
This page assesses the OpenStreetMap data for Washington, D.C. three ways. It compares OSM's road network with the Census Bureau's TIGER roads, reads the growth curves of buildings and roads from the full OSM history with the ohsome API, and measures how often key attributes are filled in.
Quick answer
Compare OSM's car roads with an official reference, here TIGER, inside the same boundary:
osm_km = H.km.sum()
tiger_km = T.km.sum()
print(f"OSM car roads: {osm_km:,.0f} km of ways; TIGER roads (excluding alleys, ramps and walkways): {tiger_km:,.0f} km; ratio {osm_km / tiger_km:.2f}")
OSM car roads: 1,981 km of ways; TIGER roads (excluding alleys, ramps and walkways): 2,102 km; ratio 0.94
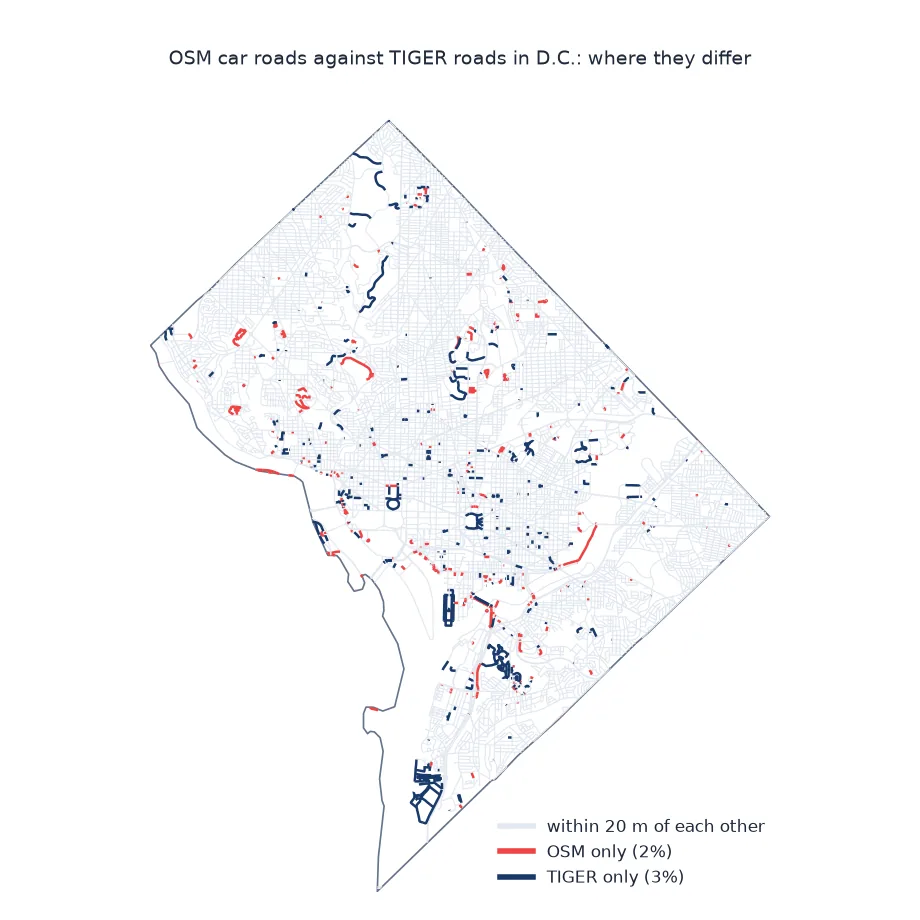
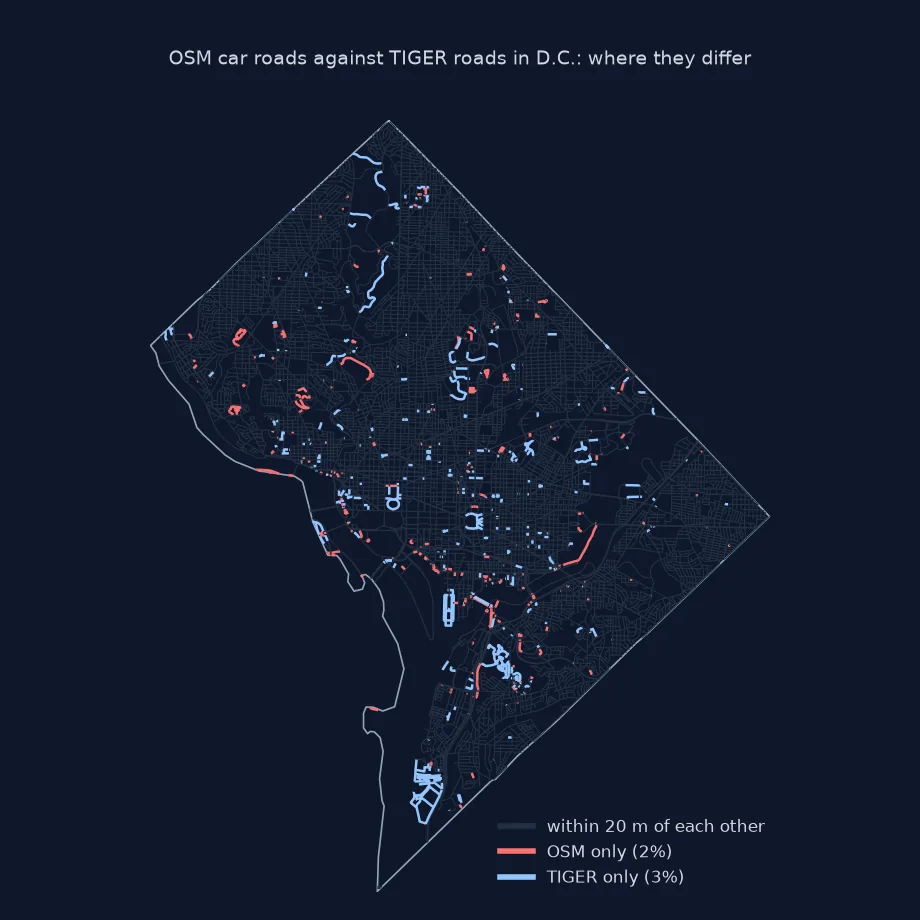
OSM has 1,981 km of car-road ways against TIGER's 2,102 km, a ratio of 0.94, even though OSM draws divided roads twice. The totals are close, but that is not yet proof of agreement.
Extrinsic road checks, saturation curves, attribute completeness
1. Extrinsic: roads by class
Match classes roughly, OSM highway groups against TIGER's MAF/TIGER Feature Class Codes (MTFCC):
osm_cls = H.groupby("group").km.sum()
TIGER_GROUP = {"S1100": "major road", "S1200": "major road", "S1400": "minor road"}
tig_cls = T.assign(group=T.MTFCC.map(TIGER_GROUP)).groupby("group").km.sum()
print(pd.DataFrame({"OSM km": osm_cls, "TIGER km": tig_cls}).round(0).astype(int).to_string())
OSM km TIGER km
group
major road 594 262
minor road 1387 1840
By class the two disagree sharply: OSM has 594 km of major roads to TIGER's 262, and TIGER has more minor roads, 1,840 km to 1,387. The two systems classify roads differently, and OSM's major roads are doubled where divided, so class totals cannot be compared directly.
2. Intrinsic: saturation curves
A feature type whose count has stopped growing is probably close to complete, unless mapping simply stopped. Read the yearly counts from the history:
for name, flt in (("buildings", "building=* and geometry:polygon"), ("shops", "shop=* and (geometry:point or geometry:polygon)"),
                  ("restaurants", "amenity=restaurant and (geometry:point or geometry:polygon)")):
    r = ohsome("elements/count", filter=flt, time="2016-01-01/2026-07-01/P2Y")
    v = [int(x["value"]) for x in r["result"]]
    print(f"{name:>11}: {v}; growth over the last two years {v[-1] / v[-2] - 1:+.1%}")
buildings: [160532, 160578, 160493, 160211, 160428, 161051]; growth over the last two years +0.4%
shops: [1364, 1631, 1739, 1790, 1906, 2154]; growth over the last two years +13.0%
restaurants: [838, 980, 1039, 1052, 1066, 1081]; growth over the last two years +1.4%
Buildings have barely grown, +0.4% in the last two years, consistent with a layer that has been complete since the imports. Restaurants are close to flat (+1.4%). Shops are still rising fast, +13.0%, so shops are probably not yet fully mapped.
3. Attribute completeness
Features can be present while their attributes are not. Measure a few that analyses rely on:
checks = {
    "buildings with an address": "tags['building'] IS NOT NULL AND tags['addr:housenumber'] IS NOT NULL",
    "buildings with levels": "tags['building'] IS NOT NULL AND tags['building:levels'] IS NOT NULL",
    "restaurants with opening_hours": "tags['amenity'] = 'restaurant' AND tags['opening_hours'] IS NOT NULL",
    "restaurants with cuisine": "tags['amenity'] = 'restaurant' AND tags['cuisine'] IS NOT NULL",
}
base = {"buildings": "tags['building'] IS NOT NULL", "restaurants": "tags['amenity'] = 'restaurant'"}
for label, cond in checks.items():
    denom = base["buildings" if label.startswith("buildings") else "restaurants"]
    print(f"{label:>31}: {q(cond) / q(denom):.0%}")
buildings with an address: 72%
buildings with levels: 36%
restaurants with opening_hours: 45%
restaurants with cuisine: 82%
72% of buildings have an address, but only 36% have levels. Among restaurants, 82% have a cuisine tag and 45% opening hours. Attribute completeness varies more between tags than between feature types.
Where OSM and TIGER differ
The data used on this page
The Geofabrik OpenStreetMap extract for the District of Columbia dated 1 January 2026 (© OpenStreetMap contributors, ODbL); the US Census Bureau's TIGER/Line 2023 roads for the District, without alleys (S1730), ramps (S1630), walkways (S1710) and private roads (S1740); the 2023 1:500,000 boundary; and the ohsome API for history, with cached responses.
import hashlib
import json
from pathlib import Path

import duckdb
import geopandas as gpd
import osmium
import pandas as pd
import requests

Path("data").mkdir(exist_ok=True)
def cached(path, url):
    p = Path(path)
    if not p.exists():
        r = requests.get(url, timeout=600)
        r.raise_for_status()
        p.write_bytes(r.content)
    return p
PBF = cached("data/district-of-columbia-260101.osm.pbf", "https://download.geofabrik.de/north-america/us/district-of-columbia-260101.osm.pbf")
C = gpd.read_file(cached("data/cb_2023_us_county_500k.zip", "https://www2.census.gov/geo/tiger/GENZ2023/shp/cb_2023_us_county_500k.zip"))
DC = C[C.GEOID == "11001"].to_crs(4326)
T = gpd.read_file(cached("data/tl_2023_11001_roads.zip", "https://www2.census.gov/geo/tiger/TIGER2023/ROADS/tl_2023_11001_roads.zip"))
T = gpd.clip(T[T.MTFCC.isin(["S1100", "S1200", "S1400"])].to_crs(4326), DC).to_crs(32618)
T["km"] = T.length / 1000

fp = (osmium.FileProcessor(str(PBF)).with_locations().with_filter(osmium.filter.EntityFilter(osmium.osm.WAY))
      .with_filter(osmium.filter.TagFilter(*[("highway", v) for v in ("motorway", "trunk", "primary", "secondary", "tertiary", "residential", "unclassified", "living_street")]))
      .with_filter(osmium.filter.GeoInterfaceFilter(tags=["highway"])))
H = gpd.GeoDataFrame.from_features(fp, crs=4326)
H = gpd.clip(H[H.geom_type == "LineString"], DC).to_crs(32618)
H["km"] = H.length / 1000
H["group"] = H.highway.map(lambda h: "major road" if h in ("motorway", "trunk", "primary", "secondary") else "minor road")

con = duckdb.connect(); con.sql("INSTALL spatial; LOAD spatial")
def q(where):
    return con.sql(f"SELECT count(*) FROM ST_ReadOSM('{PBF}') WHERE {where}").fetchone()[0]

BPOLYS = DC.assign(geometry=DC.geometry.simplify(0.0005))[["GEOID", "geometry"]].to_json()
def ohsome(endpoint, **params):
    params["bpolys"] = BPOLYS
    key = hashlib.md5((endpoint + json.dumps(params, sort_keys=True)).encode()).hexdigest()
    f = Path(f"data/ohsome_{key}.json")
    if not f.exists():
        r = requests.post(f"https://api.ohsome.org/v1/{endpoint}", data=params, timeout=600)
        r.raise_for_status()
        f.write_text(r.text)
    return json.loads(f.read_text())
print(f"OSM car-road ways: {len(H):,}; TIGER road segments: {len(T):,}")
OSM car-road ways: 13,579; TIGER road segments: 3,893
The comparison uses 13,579 OSM car-road ways and 3,893 TIGER road segments inside the District.
Example 1: where OSM and TIGER differ
Buffer each dataset and measure how much of the other lies within 20 m of it:
o = H.union_all().buffer(20); t = T.union_all().buffer(20)
print(f"TIGER length within 20 m of an OSM car road: {T.intersection(o).length.sum() / T.length.sum():.0%}")
print(f"OSM car-road length within 20 m of a TIGER road: {H.intersection(t).length.sum() / H.length.sum():.0%}")
TIGER length within 20 m of an OSM car road: 97%
OSM car-road length within 20 m of a TIGER road: 98%
Spatially the two agree well: 97% of TIGER's length lies within 20 m of an OSM car road, and 98% of OSM's within 20 m of a TIGER road. The road geometry is effectively complete. What differs is classification, not coverage.
Completeness is relative to something
Completeness is always relative to something. Extrinsic checks compare OSM with a reference dataset: official road centrelines, building registers, school lists, or another open source. They give direct answers but inherit the reference's own gaps and definitions. TIGER counts each road once as a centreline, while OSM maps divided roads as two ways, so length ratios above one can still mean good agreement. Intrinsic checks need no reference. History shows saturation, a count that rose and then levelled off, while tag statistics show how often attributes are filled in. A flat curve can also mean that mappers left, which is why the two kinds of evidence should be read together.
The results usually split along a familiar line. Geometry of common features, roads and buildings, is close to complete in well-mapped cities, often because of imports. Points of interest are good where they are visible and frequently visited. Attributes lag far behind: addresses, building levels, opening hours and cuisine are filled in for a minority of features. The practical rule is to check the specific features and tags an analysis depends on, in the specific place, and to report the coverage alongside the result.
Definitions, imports and positional accuracy
- Definitions differ: TIGER includes some roads OSM tags as
service, and OSM includes paths TIGER leaves out; match classes before comparing totals. - Imports: imported data looks complete but carries the import's age; check
dcgis:captureyear-style tags or the history for when it arrived. - Positional accuracy: completeness is not accuracy; a buffer comparison mixes both.
- Tools: the ohsome quality API and HeiGIT's OSM quality indicators automate several of these checks.
Internal links
- How to analyse OpenStreetMap history with the ohsome API — the history behind saturation
- How to get building heights and levels from OpenStreetMap — an attribute gap in detail
- Fixing an OSM tag filter that misses features — completeness of a query, not the data
FAQ
How complete is OpenStreetMap?
It depends on the feature, the attribute and the place; roads and buildings are often near complete in cities, while attributes such as addresses or opening hours are much sparser.
How do I check OSM completeness?
Compare with an official reference for the same area (extrinsic), and read the history and tag coverage for saturation (intrinsic).
Why is OSM road length longer than official data?
OSM maps divided roads as one way per direction and includes classes the reference may exclude.
What does a flat history curve mean?
Usually that the feature is close to completely mapped, though it can also mean mapping stopped; check with a reference.