
How to Analyse OpenStreetMap History in Python With the ohsome API
On this page
Problem statement
A snapshot of OpenStreetMap says what is mapped today, not how it got there. For questions about data quality, such as when a city's buildings were mapped, whether the road network is still growing, or how many people maintain the map, you need the full history. Processing the OSM history file yourself means a dump of over 100 GB. The ohsome API from HeiGIT answers the same questions with a single HTTP request: counts, lengths, areas, ratios and contributor numbers for any polygon at any set of dates since 2007.
This page uses the ohsome API to trace the history of OpenStreetMap in Washington, D.C. It counts buildings and measures road length year by year, finds the jump left by a bulk import, tracks how many buildings carry a height tag, and counts the contributors active each year.
Quick answer
POST a filter, a polygon and a time series to the ohsome API and read the result into pandas:
r = ohsome("elements/count", filter="building=* and geometry:polygon", time="2008-01-01/2026-07-01/P1Y")
B = pd.DataFrame(r["result"]).assign(year=lambda d: d.timestamp.str[:4].astype(int)).set_index("year")["value"].astype(int)
print(B.to_string())
year
2008 5
2009 22
2010 152
2011 94675
2012 93850
2013 95349
2014 98251
2015 160345
2016 160532
2017 160536
2018 160578
2019 160517
2020 160493
2021 160354
2022 160211
2023 160075
2024 160428
2025 160715
2026 161051
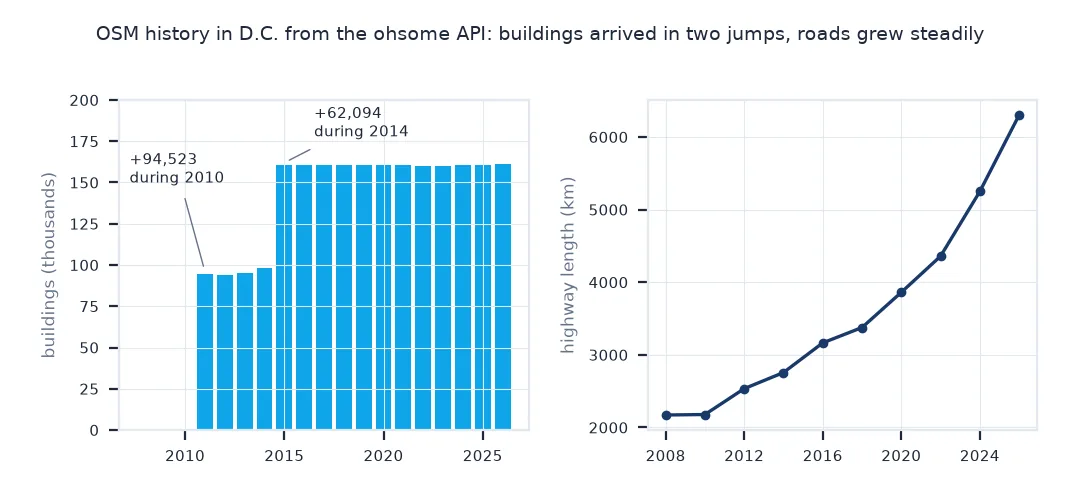
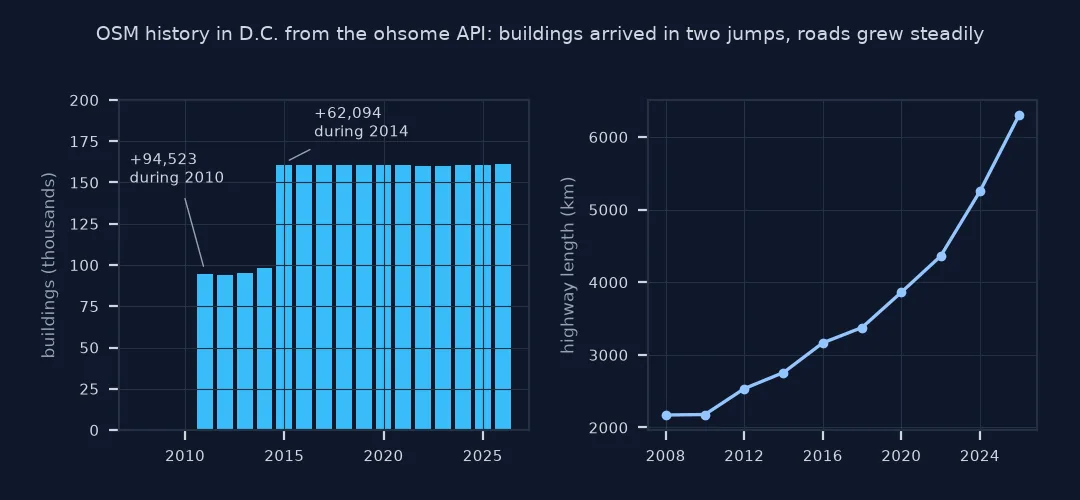
In January 2008 the District had 5 building polygons in OSM, and by January 2010 still only 152. A year later there were 94,675, and after another jump in 2014, 160,345 by 2015. Since then the count has barely moved, to 161,051 in 2026.
Find imports, road length over time, detail completeness
1. Find the imports
A count that jumps by tens of thousands in one year is not ordinary mapping. Measure the yearly change:
change = B.diff().dropna().astype(int)
print("largest yearly increases:", change.nlargest(3).to_dict())
print(f"share of today's {B.iloc[-1]:,} buildings added in those three years: {change.nlargest(3).sum() / B.iloc[-1]:.0%}")
largest yearly increases: {2011: 94523, 2015: 62094, 2014: 2902}
share of today's 161,051 buildings added in those three years: 99%
Two years account for almost all of it: 94,523 buildings were added during 2010 and 62,094 during 2014. Together with the next-largest year, they brought in 99% of today's buildings, the signature of bulk imports, not of tracing by hand.
2. Road length over time
elements/length sums the length of matching lines, in metres:
r = ohsome("elements/length", filter="highway=* and type:way", time="2008-01-01/2026-07-01/P2Y")
Lh = pd.DataFrame(r["result"]).assign(year=lambda d: d.timestamp.str[:4].astype(int)).set_index("year")["value"] / 1000
print((Lh.round(0).astype(int)).to_string())
year
2008 2172
2010 2179
2012 2535
2014 2757
2016 3165
2018 3377
2020 3861
2022 4359
2024 5250
2026 6303
Highway length tells a different story. It grew steadily from 2,172 km in 2008 to 6,303 km in 2026, and fastest at the end: 2,442 km were added between 2020 and 2026 alone.
3. How complete the details are
elements/count/ratio divides the count of a second filter by the first. Track the share of buildings that carry building:levels or height:
r = ohsome("elements/count/ratio", filter="building=* and geometry:polygon",
           filter2="building=* and geometry:polygon and (building:levels=* or height=*)", time="2012-01-01/2026-07-01/P2Y")
ratio = pd.DataFrame(r["ratioResult"]).assign(year=lambda d: d.timestamp.str[:4].astype(int)).set_index("year")["ratio"]
print((ratio * 100).round(1).to_string())
year
2012 0.0
2014 0.2
2016 35.1
2018 35.8
2020 36.0
2022 36.2
2024 36.7
2026 36.6
The share of buildings with building:levels or height was zero until 2014 and jumped to 35.1% by 2016, in step with the 2014 jump in buildings. It has crept up only to 36.6% since.
Contributors per year
The data used on this page
The ohsome API (HeiGIT, Heidelberg), which computes statistics over the full OpenStreetMap history (© OpenStreetMap contributors, ODbL); its history data ran to 27 July 2026 when this page was run. The query polygon is the District of Columbia from the US Census Bureau's 2023 cartographic boundaries, simplified to keep the request small. Responses are cached, since past counts do not change.
import hashlib
import json
from pathlib import Path

import geopandas as gpd
import pandas as pd
import requests

Path("data").mkdir(exist_ok=True)
def cached(path, url):
    p = Path(path)
    if not p.exists():
        r = requests.get(url, timeout=600)
        r.raise_for_status()
        p.write_bytes(r.content)
    return p
C = gpd.read_file(cached("data/cb_2023_us_county_500k.zip", "https://www2.census.gov/geo/tiger/GENZ2023/shp/cb_2023_us_county_500k.zip"))
DCG = C[C.GEOID == "11001"].to_crs(4326)[["GEOID", "geometry"]]
DCG["geometry"] = DCG.geometry.simplify(0.0005)
BPOLYS = DCG.to_json()

def ohsome(endpoint, **params):
    params["bpolys"] = BPOLYS
    key = hashlib.md5((endpoint + json.dumps(params, sort_keys=True)).encode()).hexdigest()
    f = Path(f"data/ohsome_{key}.json")
    if not f.exists():
        r = requests.post(f"https://api.ohsome.org/v1/{endpoint}", data=params, timeout=600)
        r.raise_for_status()
        f.write_text(r.text)
    return json.loads(f.read_text())

meta = requests.get("https://api.ohsome.org/v1/metadata", timeout=60).json()
print(f"ohsome API {meta['apiVersion']}; history from {meta['extractRegion']['temporalExtent']['fromTimestamp'][:10]}")
ohsome API 1.10.4; history from 2007-10-08
The API, version 1.10.4, holds OSM history from 8 October 2007.
Example 1: contributors per year
users/count counts the distinct users who edited matching features in each period. Count those who edited buildings or highways in D.C.:
r = ohsome("users/count", filter="building=* or highway=*", time="2008-01-01/2026-01-01/P2Y")
U = pd.DataFrame(r["result"]).assign(start=lambda d: d.fromTimestamp.str[:4])
print(U[["start", "value"]].astype({"value": int}).to_string(index=False))
start value
2008 98
2010 158
2012 467
2014 588
2016 531
2018 722
2020 832
2022 735
2024 755
Fewer than a hundred people edited buildings or highways in D.C. in 2008-09. Since 2018 the figure has been between 722 and 832 per two-year period.
An index of every version since 2007
The ohsome API is built on an index of the complete OpenStreetMap history, every version of every element since 2007. For each requested timestamp, it reconstructs the state of the map, applies the filter and computes the aggregate: a count, a length, an area, or a ratio between two filters. Contribution endpoints look at the edits between timestamps instead, and user endpoints count distinct editors. Filters use a compact language, with tags (building=*), element types (type:way), geometry types (geometry:polygon) and boolean operators, and the area of interest can be bounding boxes, a circle or any GeoJSON polygon.
History reveals things a snapshot hides. A building count that leaps from under a thousand to nearly a hundred thousand in a year is the signature of an import, a bulk load of an official dataset, not of mappers tracing one house at a time. A road length that has stopped growing suggests a mapped network that is now maintained rather than extended. A detail tag whose share rises slowly shows how completeness improves. Because the past does not change, these results are reproducible, but the latest timestamp available lags the live map by weeks, here to 27 July 2026.
Time limits, large areas and contributions
- Time limits: requesting dates beyond the data's end returns an error; read the end date from
/metadatafirst. - Large areas: split big polygons or use coarser time steps; the public instance has request time limits.
- Group by:
/elements/count/groupBy/tagand/groupBy/boundaryreturn several series in one request. - Contributions:
/contributions/countseparates creations, deletions and tag changes, which helps find imports and mass edits.
Internal links
- OSM data completeness explained — what history says about quality
- How to get building heights and levels from OpenStreetMap — the height tags in today's data
- How to read an OpenStreetMap PBF file in Python — today's snapshot
FAQ
How do I get the history of OpenStreetMap data?
Use the ohsome API: send a filter, an area and a list of dates, and it returns counts, lengths or areas for each date from the full history.
How can I tell if OSM data was imported?
Look for a sudden jump in counts; an increase of tens of thousands of features in one period is typical of an import.
Is the ohsome API free?
Yes, the public instance at api.ohsome.org needs no key; heavy users should check its fair-use guidance.
How current is ohsome data?
It lags the live map; read /metadata for the latest timestamp it covers.