
Aggregation and suppression rules explained
Problem statement
Aggregation is the only privacy defence that removes the individual record rather than disguising it, which is why every statistical agency reaches for it first. It is also the one people most often get wrong, because the protection comes from the smallest published cell, not from the geography on the map.
Two failures do almost all the damage:
- The map is aggregated and the table is not. Central London crime data summarised to 500 m cells has a median of 214 crimes per cell and nothing below 2. Cross it by the fourteen crime categories the same release publishes and 52.4% of the non-empty cells hold fewer than five incidents.
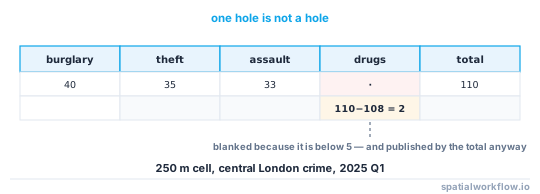
- Suppression is applied cell by cell. A suppressed cell in a row whose total is published is not suppressed; it is a subtraction. In that same table, six cells were the only suppressed value in their row and could be recovered exactly.
This guide sets out the threshold rules, the arithmetic that defeats naive suppression, and how to choose the geography instead of inheriting it.
Quick answer
Apply the threshold to the finest cell any user can reach, and suppress complementary cells so no row or column has exactly one hole:
import pandas as pd

table = pd.crosstab(cells, categories)
MIN = 5

suppressed = table.where(table >= MIN)

# a row with exactly one hole gives that hole away
holes = suppressed.isna().sum(axis=1)
needs_more = holes[holes == 1].index
print(f"{len(needs_more)} row(s) need a complementary suppression")
If needs_more is non-empty, the release leaks. Suppress the next-smallest value in each of those rows as well, and re-check until every row and column has either no holes or at least two.
Step-by-step solution
1. Enumerate everything a user can ask for
The release is not the file you wrote; it is every view of it. A map with filters for month and category publishes cell × month × category, not cell. Write out the full cross-product before choosing a threshold.
2. Pick a threshold and apply it to that cross-product
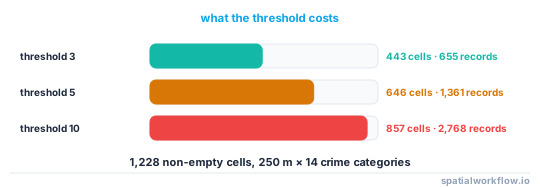
Common floors are 3 (general statistics), 5 (most open data) and 10 (health). The threshold is a count of subjects, so if one person can contribute several rows, count people, not rows.
3. Choose a geography that meets the threshold instead of forcing one
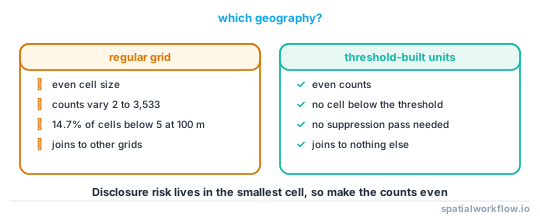
Grid cells give an even geometry and uneven counts; population-based units — census output areas, or a quadtree that splits only where counts allow — give even counts and uneven geometry. For disclosure control, even counts are what you need. The London crime extract at 100 m, 250 m and 500 m cells shows the trade directly:
| cell size | occupied cells | median count | cells below 5 | crimes suppressed |
|---|---|---|---|---|
| 100 m | 497 | 15 | 73 (14.7%) | 208 (1.1%) |
| 250 m | 130 | 60 | 7 (5.4%) | 19 (0.1%) |
| 500 m | 44 | 214 | 2 (4.5%) | 5 (0.0%) |
4. Suppress primary cells, then complementary ones
Primary suppression hides cells below the threshold. Complementary suppression hides enough additional cells that no suppressed value can be derived from published margins. A cell is recoverable whenever it is the only hole in a published row or column.
5. Decide whether to publish the margins at all
The simplest complementary suppression is to not publish the totals. If the row total is absent, one hole stays a hole. That is often cheaper than suppressing a second real value, and it is the option agencies use least because totals are what people want.
6. Consider rounding instead of suppression
Controlled rounding — rounding every cell to a base of 3 or 5, with the rounding chosen so margins stay consistent — publishes a number everywhere and removes exact small counts. It is usually more useful than a table full of holes, and it is what several national censuses now do.
7. Check the time series
A cell suppressed in March and published in April, with a published annual total, gives March away. Suppression decisions have to be made across the whole series, not per release.
Code examples
Example 1 — where the threshold actually bites
import pandas as pd

crimes = pd.read_parquet("london_crimes_2025q1.parquet")   # 19,619 records, 14 categories
cells = (crimes.x // 250).astype(int).astype(str) + "_" + (crimes.y // 250).astype(int).astype(str)

by_cell = cells.value_counts()
print(f"cell only:       {len(by_cell)} cells, {(by_cell < 5).sum()} below 5")

table = pd.crosstab(cells, crimes.category)
nz = table.values[table.values > 0]
print(f"cell x category: {len(nz):,} non-empty, {(nz < 5).sum():,} below 5 "
      f"({(nz < 5).mean():.1%}), holding {nz[nz < 5].sum():,} crimes")
cell only: 130 cells, 7 below 5
cell x category: 1,228 non-empty, 643 below 5 (52.4%), holding 1,343 crimes
The same data is comfortably above the threshold as a map and more than half below it as a table.
Example 2 — finding the recoverable cells
small = (table > 0) & (table < 5)

row_holes = small.sum(axis=1)
col_holes = small.sum(axis=0)

print(f"rows with exactly one suppressed cell: {(row_holes == 1).sum()} of {len(table)}")
print(f"columns with exactly one suppressed cell: {(col_holes == 1).sum()} of {table.shape[1]}")
rows with exactly one suppressed cell: 6 of 130
columns with exactly one suppressed cell: 0 of 14
Six cells are published in all but name. The fix is to suppress a second value in each of those six rows, or to drop the row totals.
Example 3 — a quadtree that splits only where the count allows
def quadtree(points, x0, y0, size, min_count=5, max_depth=10, depth=0):
    """Split a cell only while both halves would still meet the threshold."""
    inside = points[(points.x >= x0) & (points.x < x0 + size) &
                    (points.y >= y0) & (points.y < y0 + size)]
    half = size / 2
    if depth >= max_depth or len(inside) < 4 * min_count:
        return [(x0, y0, size, len(inside))] if len(inside) else []
    kids = []
    for dx, dy in [(0, 0), (half, 0), (0, half), (half, half)]:
        kids += quadtree(points, x0 + dx, y0 + dy, half, min_count, max_depth, depth + 1)
    return kids if all(c[3] >= min_count for c in kids) else \
        ([(x0, y0, size, len(inside))] if len(inside) else [])

cells = quadtree(crimes, x0, y0, 4096, min_count=5)
print(f"{len(cells)} cells, smallest count {min(c[3] for c in cells)}, "
      f"sizes {sorted({c[2] for c in cells})}")
Every published cell meets the threshold by construction, and the cell size varies instead of the counts.
Explanation
Why the finest reachable cell is the unit
Disclosure is about what a user can isolate, and a filter is a query. Publishing a 500 m grid alongside a category filter is publishing the cross-product whether or not you ever materialise that table. The rule is: apply the threshold to the join of every dimension you expose.
Why complementary suppression is not optional
Suppression hides values, not information. If a row of five categories publishes a total of 140 and four values of 40, 35, 33 and 30, the fifth is 2 — arithmetic, not an attack. Agencies solve this as a linear programme that suppresses the least total information subject to every suppressed cell having a feasible range wider than some interval; a threshold-based heuristic that guarantees two holes per row and column covers most open-data cases.
Why aggregation composes and masking does not
Two count tables of the same people published a year apart can be differenced, but the difference is still a count — the individual record is not there to be recovered. Two masked point files can be averaged towards the truth. That structural difference is why aggregation is the defence that survives a publication schedule.
Why a count of zero is not safe either
A published zero says nobody in this cell has this attribute, which can be as disclosive as a one — especially combined with a known population. Some agencies suppress zeros in small populations for exactly this reason, or publish "fewer than 5" as a band rather than distinguishing 0 from 4.
Edge cases or notes
- Count subjects, not rows. One person with six clinic visits is one subject.
- Bands beat holes. "<5" everywhere is more useful than a mixture of exact values and blanks.
- Percentages leak the denominator. A rate of 100% in a cell of 3 publishes the 3.
- Ratios and means leak too. A mean of one value is the value.
- Boundary changes across years break the protection. Two vintages of the same area can be differenced.
- Do not publish both the aggregate and the points. It happens more often than it should.
- Zero cells may need suppressing. Especially when the population of the cell is public.
- Document the rule, not just the result. Users must know whether a blank is a zero or a suppression.
Internal links
- How to suppress small counts in a spatial table in Python — the implementation, including complementary suppression
- Suppressed cells can be recovered from the totals — the failure this guide prevents
- How to aggregate points to units that meet a minimum count — building the geography
- Spatial k-anonymity explained — the same threshold applied to points
- Differential privacy for spatial counts explained — the alternative to suppression
- The modifiable areal unit problem explained — why the geography changes the answer
- Small area rates explained — what small denominators do to a rate
- Margins of error explained — published uncertainty as another disclosure channel
FAQ
What count is small enough to suppress?
Three, five and ten are the usual thresholds. Five is the common floor for open data; health and other sensitive releases use ten or more.
Do I apply the threshold to the map or to the table?
To the finest cell a user can reach through any filter. A 500 m grid that looks safe can be more than half below the threshold once crossed with a category.
What is complementary suppression?
Suppressing extra cells so that no hidden value can be derived from published totals. A row with exactly one hole and a published total has no hole at all.
Is rounding better than suppression?
Often. Controlled rounding to a base of 3 or 5 publishes a number everywhere and removes exact small counts, which users find far more usable than a table of blanks.
Are zeros safe to publish?
Not always. A zero in a small population can be as revealing as a one, especially when combined with a public denominator.
Why does aggregation survive repeat publication when masking does not?
Because it removes the individual record. Repeated count tables can be differenced, but there is no per-person row left to recover.