
Anonymised points still identify individuals
Problem statement
The dataset went through the process. Names were dropped, coordinates were masked or rounded, the map was checked, and somebody still recognised a case. Or a journalist joined the release to an address file and got a list. Or a second release of the same data, a year later, turned out to be enough on its own.
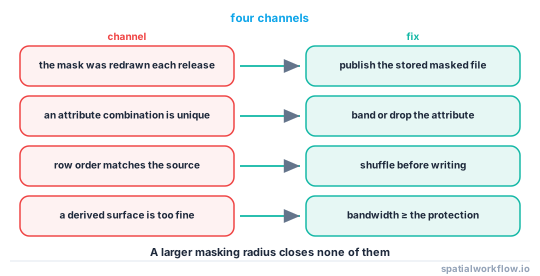
Every one of these has the same shape: the release was checked against one attack and defeated by another. The four that account for most real failures are the average-over-releases attack, the attribute attack, the row-order attack and the derived-surface attack. None of them requires special access, and none of them is stopped by a larger masking radius.
Quick answer
Check the four channels, not just the geometry:
# 1. Did the same points get masked twice with different draws?
assert previous_release.geometry.equals(current_release.geometry), "redrawn mask"

# 2. Is any record unique on its attributes within its neighbourhood?
key = list(zip(cell_id, *[gdf[c] for c in quasi_identifiers]))
assert pd.Series(key).value_counts().min() >= 5, "unique attribute combination"

# 3. Does the row order match the source?
assert not released.reset_index(drop=True).index.equals(source.index), "row order preserved"

# 4. Was any derived surface built at a bandwidth finer than the protection?
assert kde_bandwidth_m >= mask_radius_m, "KDE reveals the inputs"
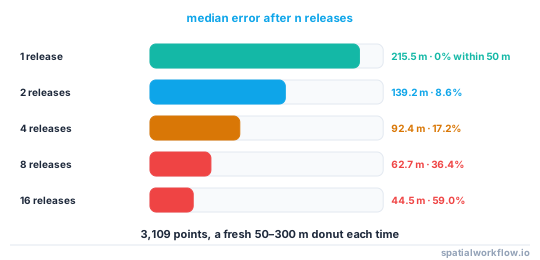
The first is the most common and the most damaging. Sixteen independently drawn 50–300 m donut masks of the same 3,109 points, averaged, put 59.0% of them within 50 m of their true location and landed 12.8% on exactly the right address.
Step-by-step solution
1. Check whether the mask was redrawn
If the release is periodic and the code re-runs the mask each time, the protection decays as 1/√n:
| releases | median error | within 50 m | exact nearest address |
|---|---|---|---|
| 1 | 215.5 m | 0.0% | 1.6% |
| 2 | 139.2 m | 8.6% | 3.2% |
| 4 | 92.4 m | 17.2% | 5.4% |
| 8 | 62.7 m | 36.4% | 8.7% |
| 16 | 44.5 m | 59.0% | 12.8% |
The fix is to publish the same masked coordinates every time. Store the file; do not store only the code.
2. Check the attributes as a key
Geometry narrows the candidate set; attributes finish it. Count records sharing both a neighbourhood and an attribute combination, and treat any combination that is unique as a failure. Rare categories, exact ages and precise timestamps are the usual culprits.
3. Check the row order
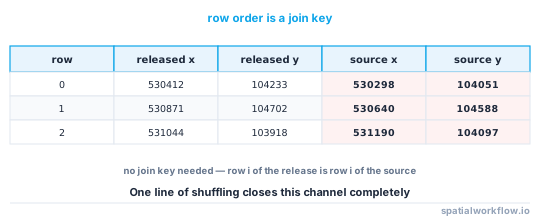
A masked file written in the source's row order can be joined back to the source by position. The published index is enough; so is the order of features in a GeoJSON. Shuffle before writing, and drop any index column.
4. Check the derived products
A kernel density surface at a bandwidth smaller than the masking radius has a maximum near every input point. A choropleth at a geography finer than the protection does the same thing with cells. Derive everything from the masked points, and match the bandwidth to the claimed protection.
5. Check the second dataset
Two releases of the same population at different geographies can be intersected; two time slices can be differenced. If a yearly total and eleven monthly values are published, the twelfth is arithmetic.
6. Check the exports
An SVG or PDF of a "blurred" scatter carries one vector element per marker with exact coordinates. A test export of 3,109 points at 5% opacity produced a 466 KB SVG containing 3,193 <use> elements — one per marker plus the axis ticks — each with its own position. The blur is in the rendering only.
7. Re-run the risk audit on the artefact
Everything above is a property of what shipped, not of what you intended. How to run a privacy check before publishing a spatial dataset is the gate that reads the file back.
Code examples
Example 1 — reproduce the averaging attack on your own release
import numpy as np
from scipy.spatial import cKDTree

rng = np.random.default_rng(3)
tree = cKDTree(true_xy)
acc = np.zeros_like(true_xy)

for i in range(1, 17):
    acc += donut(true_xy, 50, 300, rng)          # a fresh draw, as a naive pipeline would
    est = acc / i
    err = np.hypot(*(est - true_xy).T)
    _, idx = tree.query(est, k=1)
    if i in (1, 2, 4, 8, 16):
        print(f"{i:2d} releases: median {np.median(err):6.1f} m | within 50 m "
              f"{(err < 50).mean():5.1%} | nearest is the true address "
              f"{(idx == np.arange(len(true_xy))).mean():5.1%}")
1 releases: median 215.5 m | within 50 m 0.0% | nearest is the true address 1.6%
2 releases: median 139.2 m | within 50 m 8.6% | nearest is the true address 3.2%
4 releases: median 92.4 m | within 50 m 17.2% | nearest is the true address 5.4%
8 releases: median 62.7 m | within 50 m 36.4% | nearest is the true address 8.7%
16 releases: median 44.5 m | within 50 m 59.0% | nearest is the true address 12.8%
Example 2 — find the records that are unique on geometry plus attributes
import pandas as pd

def unique_records(gdf, quasi, cell_m=250):
    cell = list(zip((gdf.geometry.x // cell_m).astype(int),
                    (gdf.geometry.y // cell_m).astype(int)))
    key = pd.Series(list(zip(cell, *[gdf[c] for c in quasi])))
    counts = key.map(key.value_counts())
    return gdf.assign(group_size=counts.values).query("group_size < 5")

risky = unique_records(released, ["age_band", "sex", "month"])
print(f"{len(risky)} of {len(released)} records in a group smaller than 5")
print(risky[["age_band", "sex", "month", "group_size"]].head())
Example 3 — break the row-order link before writing
released = released.sample(frac=1, random_state=20260915).reset_index(drop=True)
released = released.drop(columns=[c for c in released.columns
                                  if c.lower() in {"index", "fid", "objectid", "source_id"}])
released.to_file("release.gpkg", layer="cases", driver="GPKG")
Shuffling is free and closes a channel that otherwise recovers every point exactly. Note that the row order in the source must not be reconstructible either — a sort by identifier is the same leak.
Explanation
Why averaging works
A donut mask adds independent zero-mean noise. The mean of n independent draws has a standard error 1/√n of a single draw, so the estimate converges on the truth at a rate anyone can compute. Nothing about the radius changes this; a larger radius only means more releases are needed. Publishing the same file every time removes the extra samples entirely.
Why attributes beat geometry
A neighbourhood with fifty candidate households is ample protection until the release also says the subject is a 91-year-old man. Each attribute divides the candidate set, and demographic attributes divide it fast. This is exactly the structure that re-identified medical records from a voter roll in the 1990s and it has not changed.
Why row order is a real attack
The order of features in a file is data. A masked release written with to_file on a GeoDataFrame that was never reordered has row i corresponding to source row i, and any copy of the source — including an older, unmasked release — recovers every point exactly. It costs one line to close and is almost never checked.
Why derived surfaces leak
Smoothing is a convolution, not a deletion. A kernel density surface built from the true points with a 25 m bandwidth has a local maximum at each of them; an SVG scatter is not smoothed at all, only drawn transparently. If the protection claimed is 300 m, no published derivative may resolve anything finer.
Edge cases or notes
- A single redraw is already a loss. Two releases halve the error in the average.
- Sorting is ordering. Sorting by any source-derived key is as revealing as leaving the order alone.
- Free-text fields leak. A note saying "opposite the church" is a coordinate.
- Photograph metadata leaks. Strip it before shipping the folder.
- Counts plus points is both. Publishing an aggregate and the masked points lets one check the other.
- An old unmasked release cannot be recalled. If one exists, everything after it is joinable to it.
- Small groups fail at any radius. If a category has three members in a city, geometry is not the problem.
- Document the attacks you tested. A privacy statement that lists what was checked is worth more than one that says "anonymised".
Internal links
- Re-identification risk in spatial data explained — the joins these attacks use
- How to apply donut geomasking to sensitive points in Python — storing the mask rather than the seed
- Spatial k-anonymity explained — why composition breaks the guarantee
- A shared file still contains the original coordinates — the file-level leaks
- How to run a privacy check before publishing a spatial dataset — testing all four channels automatically
- Differential privacy for spatial counts explained — the defence built for repeat releases
- Kernel density explained — why a density surface still contains the inputs
- How to measure re-identification risk in a point dataset — the audit before release
FAQ
Why can masked points still be traced back?
Usually because the mask was redrawn for each release. Averaging sixteen independent 50–300 m masks put 59% of points within 50 m of the truth and picked the exact right address for 12.8%.
Is a bigger masking radius the fix?
No. It slows the averaging attack and does nothing about attributes, row order or derived surfaces.
How does row order identify anyone?
If the released file keeps the source's row order, row i of the release is row i of the source, so any copy of the source restores every true coordinate exactly.
Can attributes identify someone when the geometry is safe?
Yes. Each published attribute divides the candidate set; two or three demographic fields will take fifty candidates down to one.
Is a heat map safe if the points are not?
Only if the bandwidth is at least the protection claimed. A fine-bandwidth kernel density surface has a peak at every input point.
What should I do if an unmasked version was already published?
Treat everything afterwards as joinable to it. No later masking can undo a released coordinate; the response is to change what is published, not how it is displaced.