
How to measure re-identification risk in a point dataset
Problem statement
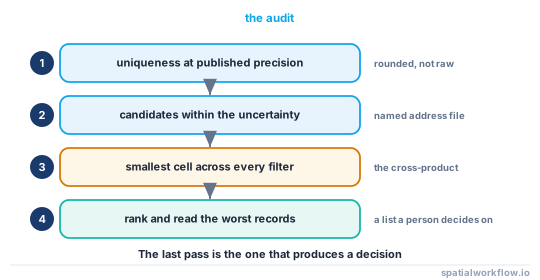
Before you can decide how to protect a point dataset you have to know how exposed it is, and "it looks fine on the map" is not a measurement. The audit has to produce numbers somebody can put in a data-sharing agreement: how many records sit alone on a location, how many candidate subjects each released point leaves, what the smallest publishable cell contains, and which handful of records carry most of the risk.
The hard part is not the code. It is remembering that the dataset you are auditing is not the file — it is the file plus every filter the release exposes, plus whatever an attacker can join to it. This guide runs that audit end to end on two real datasets: 3,109 OpenStreetMap address points in Brighton & Hove, and 4,950 UK police crime records for central Leicester that have already been anonymised by the publisher.
Quick answer
Three numbers, in this order:
import numpy as np, pandas as pd, geopandas as gpd
from scipy.spatial import cKDTree

pts = gpd.read_file("release.gpkg").to_crs(27700)          # a metric CRS
xy = np.c_[pts.geometry.x, pts.geometry.y]

# 1. how unique is each location?
key = pd.Series(list(map(tuple, xy.round(1))))
print("rows alone on their coordinate:", int((key.value_counts() == 1).sum()))

# 2. how many candidate subjects does each point leave?
tree = cKDTree(np.c_[addresses.geometry.x, addresses.geometry.y])
k = np.array([len(tree.query_ball_point(p, 50)) for p in xy])
print(f"k at 50 m: min {k.min()}, median {np.median(k):.0f}, below 5: {(k < 5).sum()}")

# 3. what is the smallest cell the release exposes?
cells = pts.groupby(["month", "category"]).size()
print("smallest published cell:", cells.min())
On the unmasked Brighton addresses the first number is 3,109 of 3,109 — every record alone. On the published Leicester crime extract the third number is 1, in 1,878 of 2,760 cells.
Step-by-step solution
1. Reproject to metres before anything else
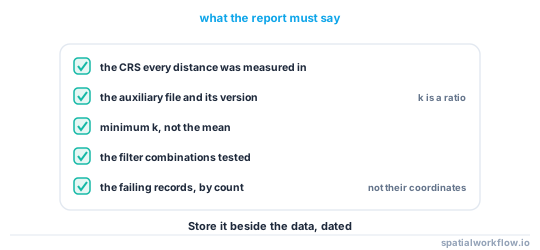
Every distance in the audit is in metres. Reproject once at the top, and record the CRS in the report — a risk number without a CRS is not reproducible.
2. Measure coordinate uniqueness
Count how many records share each rounded coordinate. Round at the precision you intend to publish, not at full precision, or you measure the source rather than the release.
for dp in (6, 5, 4, 3, 2):
    key = pd.Series(list(zip(lat.round(dp), lon.round(dp))))
    vc = key.value_counts()
    print(f"{dp} dp: {len(vc):5,} distinct, {int((vc == 1).sum()):5,} occupied by one record")
6 dp: 3,109 distinct, 3,109 occupied by one record
5 dp: 3,108 distinct, 3,107 occupied by one record
4 dp: 2,516 distinct, 1,999 occupied by one record
3 dp: 487 distinct, 143 occupied by one record
2 dp: 22 distinct, 0 occupied by one record
Three decimal places — a cell of about 111 m by 70 m at this latitude — still leaves 143 points alone in their cell.
3. Count candidate subjects against a real auxiliary file
This is the number that means something. Use the most complete address or premises file you can obtain, and record which one. Spatial k-anonymity explained covers what the count means.
4. Enumerate the smallest cell the release exposes
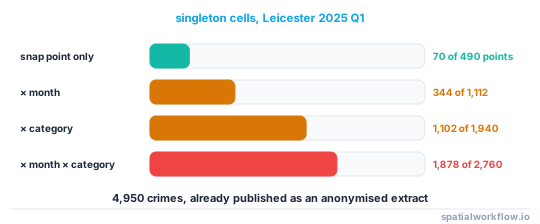
Cross every dimension a user can filter by. The Leicester extract is a good example of the gap between the two:
| unit | cells | cells of exactly one |
|---|---|---|
| snap point | 490 | 70 (14.3%) |
| point × month | 1,112 | 344 (30.9%) |
| point × category | 1,940 | 1,102 (56.8%) |
| point × month × category | 2,760 | 1,878 (68.0%) |
5. Rank the records by risk and look at the top
Risk is concentrated. The isolated points, the rare categories and the records whose attributes are unique in their neighbourhood are a small, enumerable set, and they are where the release decision actually lives.
6. Test the attributes as well as the geometry
For each record, count how many other records share both its neighbourhood and its attribute combination. A record that is unique on both is a re-identification waiting for an auxiliary file.
7. Write the report as a file, not a message
The audit belongs next to the data, with the date, the auxiliary source, the CRS, the parameters and the numbers. How to run a privacy check before publishing a spatial dataset turns it into a pipeline gate.
Code examples
Example 1 — the full uniqueness profile
import numpy as np, pandas as pd, geopandas as gpd

def uniqueness_profile(gdf, quasi_identifiers=(), round_m=1):
    xy = pd.Series(list(zip((gdf.geometry.x / round_m).round().astype(int),
                            (gdf.geometry.y / round_m).round().astype(int))))
    out = {"rows": len(gdf), "distinct_locations": xy.nunique()}
    vc = xy.value_counts()
    out["locations_with_one_record"] = int((vc == 1).sum())
    if quasi_identifiers:
        key = pd.Series(list(zip(xy, *[gdf[c] for c in quasi_identifiers])))
        kvc = key.value_counts()
        out["quasi_id_cells"] = len(kvc)
        out["cells_of_one"] = int((kvc == 1).sum())
        out["records_in_cells_of_one"] = int(kvc[kvc == 1].sum())
    return out

crimes = gpd.read_file("leicester_2025q1.gpkg").to_crs(27700)
print(uniqueness_profile(crimes, ["month", "category"]))
{'rows': 4950, 'distinct_locations': 490, 'locations_with_one_record': 70,
'quasi_id_cells': 2760, 'cells_of_one': 1878, 'records_in_cells_of_one': 1878}
Example 2 — candidate counts at several radii
from scipy.spatial import cKDTree

tree = cKDTree(np.c_[addresses.geometry.x, addresses.geometry.y])
released = np.c_[pts.geometry.x, pts.geometry.y]

rows = []
for radius in (25, 50, 100, 250, 500):
    k = np.array([len(tree.query_ball_point(p, radius)) for p in released])
    rows.append({"radius_m": radius, "k_min": int(k.min()),
                 "k_median": float(np.median(k)),
                 "below_5": int((k < 5).sum()), "below_10": int((k < 10).sum())})
print(pd.DataFrame(rows).to_string(index=False))
Report the whole table. A single radius hides the fact that the failing points are the same ones at every radius.
Example 3 — the records that carry the risk
d, _ = cKDTree(released).query(released, k=6)
isolation = d[:, 5]                                  # distance to the 5th nearest released point

worst = pts.assign(isolation_m=isolation).nlargest(20, "isolation_m")
print(worst[["category", "isolation_m"]].round(0).to_string(index=False))
print(f"\n{(isolation > 500).sum()} points are more than 500 m from their 5th nearest neighbour")
Twenty rows is a list a person can read and make a decision about — drop them, generalise them, or accept them. That is what the audit is for.
Explanation
Why uniqueness is measured at the published precision
The source file is always unique; that is not news. What matters is whether the release is unique, so every uniqueness count must be computed after rounding, masking or aggregation, using exactly the values you intend to write.
Why the auxiliary file must be named
The candidate count is a ratio between your points and somebody else's records. Using OpenStreetMap — 3,109 address nodes for a city of around 290,000 people — gives smaller candidate counts than a complete national address file would, and a different pattern of failures. Neither is wrong; an unstated choice is.
Why the filter cross-product is the real unit
Users do not download the file; they filter the map. The Leicester extract is published as an already-anonymised product and is safe at the level of a bare point. At the level its own map exposes, two-thirds of cells describe one incident, and a person who knows roughly when and what will recover it.
Why risk is reported as a distribution
A mean candidate count of 400 tells you nothing about the point with two candidates, and the point with two candidates is the release. Always report the minimum, the count below the threshold, and the list of offenders.
Edge cases or notes
- Audit the output of your pipeline, not the input. Masking code with a bug produces an unmasked release that the input-side audit passed.
- Empty attributes are attributes. A null category can be as distinguishing as a rare one.
- Duplicated subjects inflate k. Two records for the same person are one candidate.
- Check the CRS on both layers. A silent CRS mismatch makes every distance meaningless and every k enormous.
- Sample only for speed, never for the report. The rare points are the ones a sample misses.
- Re-run after every schema change. Adding a column changes the quasi-identifier set.
- Keep the audit script in the repository. It is the evidence, and it has to be re-runnable.
- Include the derived products. A KDE raster and an SVG map are part of the release.
Internal links
- Re-identification risk in spatial data explained — what the numbers mean
- Spatial k-anonymity explained — the candidate-count threshold
- How to run a privacy check before publishing a spatial dataset — turning the audit into a gate
- Geoprivacy explained: why coordinates are personal data — why this audit exists
- Anonymised points still identify individuals — what a passing audit still misses
- How to find the nearest point in GeoPandas — the neighbour search underneath
- How to validate a GeoDataFrame against a schema before analysis — the same idea for data quality
- How to reduce coordinate precision safely in Python — acting on the uniqueness profile
FAQ
What should I measure first?
How many records are alone on their coordinate at the precision you intend to publish. If that number is large, nothing else in the audit matters yet.
Which address file should I use as the attacker's data?
The most complete one you can legally obtain. OpenStreetMap is a usable free substitute, but state that you used it — its coverage is partial and the resulting risk numbers are optimistic about coverage.
What radius should I count candidates in?
The uncertainty your release admits to: the rounding cell, the masking radius, or the aggregation polygon. Report several radii so the shape of the risk is visible.
Why does my already-anonymised dataset still fail?
Usually because the threshold was applied to the map and not to the filters. Crossing a safe-looking snap point with month and category made 68.0% of cells singletons in the Leicester extract.
Do attributes need auditing too?
Yes. Count how many records share both a neighbourhood and an attribute combination; uniqueness on both is the condition an attacker needs.
How often should the audit run?
On every release, automatically, and again whenever a column is added or a filter is exposed in the UI.