
More Eruptions Every Century: The Volcano Record Is Filling In
On this page
Problem statement
Count the Smithsonian's confirmed eruptions by century and the number climbs steeply towards the present, as if the planet were becoming more volcanic. It is not: the record is. An eruption enters the table only if someone saw it and wrote it down, or if it left a deposit that a geologist later found and dated. Small eruptions on remote volcanoes went unrecorded until satellites, and small prehistoric ones left little to find. Large eruptions are recorded much further back. This page measures how the counts grow by size, and finds for each VEI the year from which counting is fair.
Quick answer
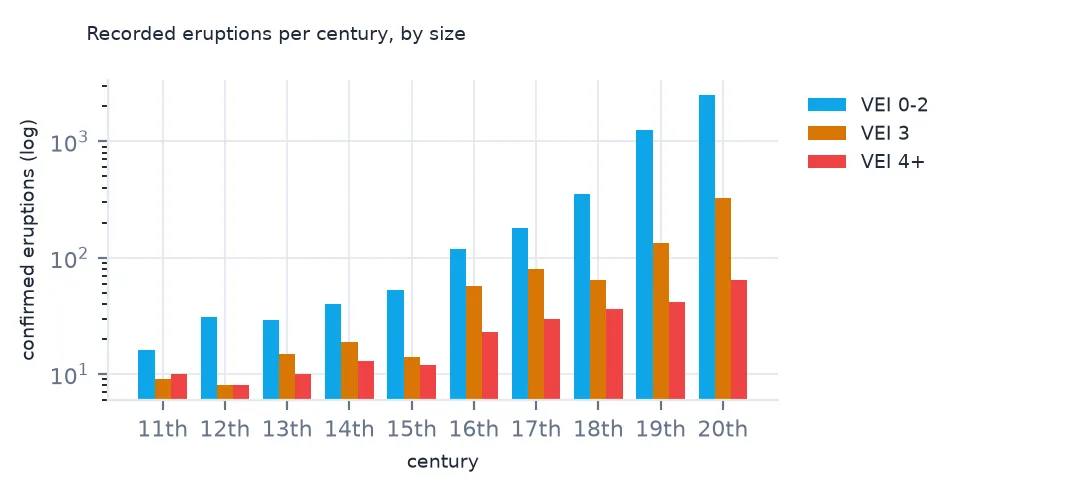
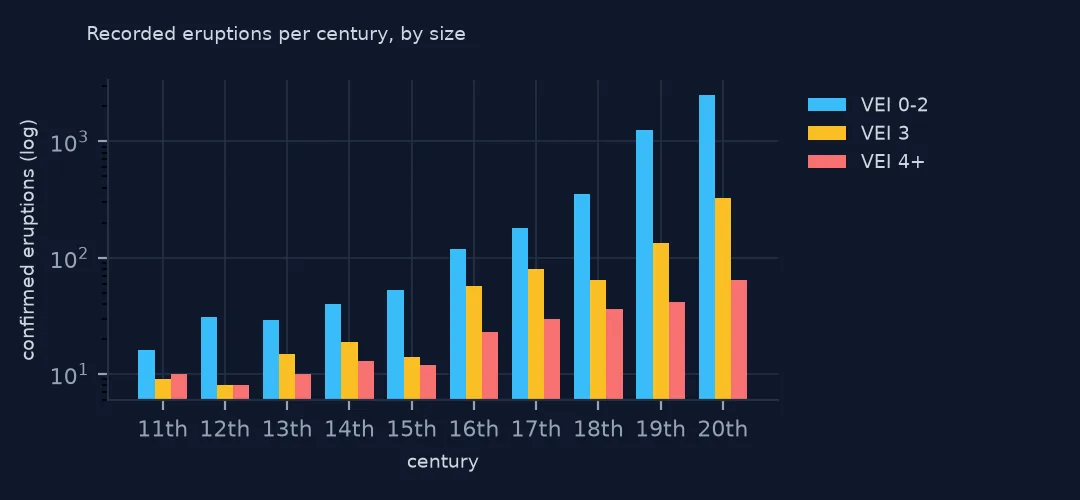
Count confirmed eruptions per century by VEI class; the rise is steep for small eruptions and gentle for large ones:
c = eru[(eru.Activity_Type == "Confirmed Eruption") & (eru.StartDateYear >= 1)].copy()
c["century"] = (c.StartDateYear - 1) // 100 * 100 + 1
c["vei_class"] = pd.cut(c.ExplosivityIndexMax, [-1, 2, 3, 8], labels=["VEI 0-2", "VEI 3", "VEI 4+"]).cat.add_categories("no VEI").fillna("no VEI")
t = c.pivot_table(index="century", columns="vei_class", values="Eruption_Number", aggfunc="count", observed=False).fillna(0).astype(int)
print(t.loc[[1001, 1501, 1601, 1701, 1801, 1901]].to_string())
vei_class VEI 0-2 VEI 3 VEI 4+ no VEI
century
1001 16 9 10 35
1501 119 57 23 49
1601 179 80 30 47
1701 350 64 36 54
1801 1250 134 42 76
1901 2524 327 65 61
Small eruptions, VEI 0 to 2, grow from 16 in the 11th century to 2,524 in the 20th, more than 150-fold. Eruptions of VEI 4 and more grow from 10 to 65, under sevenfold, and most of that growth is before 1800. The steeper the climb, the more of it is the record rather than the volcanoes.
Where counting is fair
1. Per decade since 1500
d = c[(c.StartDateYear >= 1500) & (c.StartDateYear < 2020)].assign(decade=lambda x: x.StartDateYear // 10 * 10)
per = d.pivot_table(index="decade", columns="vei_class", values="Eruption_Number", aggfunc="count", observed=False).fillna(0)
print(per.loc[[1500, 1600, 1700, 1800, 1850, 1900, 1950, 2000]].astype(int).to_string())
vei_class VEI 0-2 VEI 3 VEI 4+ no VEI
decade
1500 11 1 1 7
1600 15 4 4 5
1700 31 5 1 7
1800 54 6 3 11
1850 142 15 4 12
1900 231 18 6 14
1950 312 29 7 9
2000 334 49 9 0
By decade, small eruptions climb through the whole of the 19th and 20th centuries, from 54 in the 1800s to 334 in the 2000s, as observers, then volcano observatories, then satellites watched more volcanoes. Large eruptions level off much earlier, at a handful a decade. The "no VEI" column shrinks to zero for the 2000s, because recent eruptions are always given an index.
2. A completeness year per size
for s in ["VEI 0-2", "VEI 3", "VEI 4+"]:
    late = per.loc[1960:2010, s].mean()
    full = per[s][per[s].rolling(5, min_periods=5).mean() >= 0.8 * late]
    print(f"{s}: 1960-2019 average {late:.1f} a decade; first decade whose 50-year average reaches 80% of it: {full.index.min() - 40}")
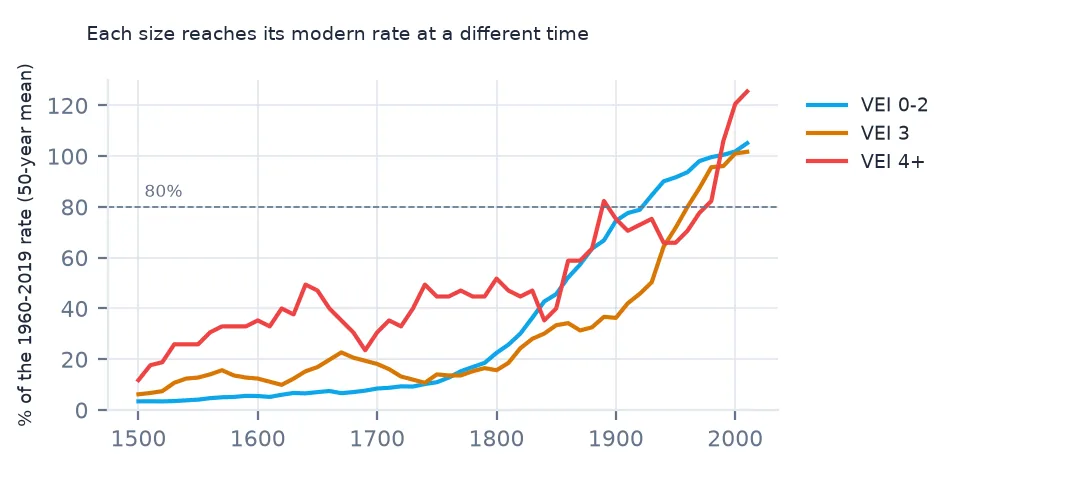
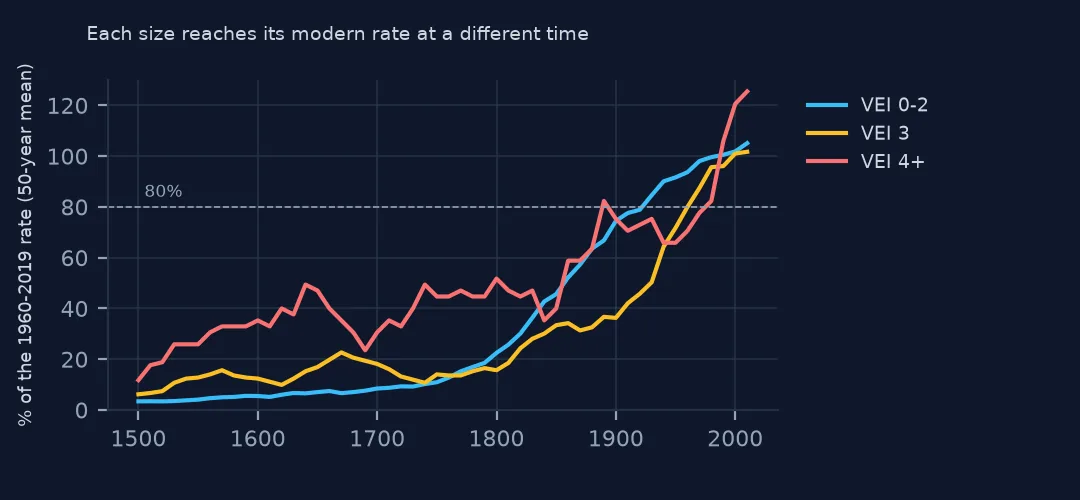
VEI 0-2: 1960-2019 average 283.5 a decade; first decade whose 50-year average reaches 80% of it: 1910
VEI 3: 1960-2019 average 48.5 a decade; first decade whose 50-year average reaches 80% of it: 1950
VEI 4+: 1960-2019 average 8.5 a decade; first decade whose 50-year average reaches 80% of it: 1870
Take the rate of 1960 to 2019 as the reference, and look for the first fifty years whose average reaches 80% of it. For VEI 4 and larger that is from 1870, for small eruptions from 1910. VEI 3 only reaches it from 1950, because its count kept growing into the 2000s, as more small explosive eruptions at remote volcanoes were caught by satellites. Before those years, a count of that size understates how often it happens.
3. Volcanoes recorded erupting
first = c.groupby("Volcano_Number").StartDateYear.min()
print(f"volcanoes whose first recorded CE eruption is after 1900: {(first >= 1900).sum()} of {len(first)}")
volcanoes whose first recorded CE eruption is after 1900: 115 of 678
115 of the 678 volcanoes with a Common Era eruption have none recorded before 1900. They are mostly in remote places: the Mariana, Tonga, Vanuatu, Ogasawara and Kuril island arcs, the Afar desert and the Alaska Peninsula, and 44 of them are below sea level. Many had been erupting long before, with nobody there to report it.
Trends that survive
The data used on this page
The Smithsonian Institution Global Volcanism Program's Volcanoes of the World database (version 5.3 is cited as doi:10.5479/si.GVP.VOTW5-2025.5.3): its Holocene volcano and eruption tables, read from the program's WFS service on 19 October 2026 and saved on this site, because the database is edited as eruptions are reported.
from pathlib import Path
import zipfile

import geopandas as gpd
import numpy as np
import pandas as pd
import requests

Path("data").mkdir(exist_ok=True)
# Smithsonian Global Volcanism Program, Volcanoes of the World: Holocene volcanoes, Holocene eruptions and Pleistocene
# volcanoes as GeoJSON from its WFS service, with Natural Earth's populated places and 1:110m countries.
# Saved 19 October 2026, because the database is edited as eruptions are reported.
# Live: https://webservices.volcano.si.edu/geoserver/GVP-VOTW/ows?service=WFS&version=2.0.0&request=GetFeature
#       &outputFormat=json&typeName=GVP-VOTW:Smithsonian_VOTW_Holocene_Volcanoes (and ..._Holocene_Eruptions)
ARCHIVE = "gvp-votw-2026-10-19.zip"
if not Path(f"data/{ARCHIVE}").exists():
    Path(f"data/{ARCHIVE}").write_bytes(requests.get(f"https://data.spatialworkflow.io/{ARCHIVE}", timeout=600).content)
Z = zipfile.ZipFile(f"data/{ARCHIVE}")
vol = gpd.read_file(Z.open("Smithsonian_VOTW_Holocene_Volcanoes.json"))
eru = gpd.read_file(Z.open("Smithsonian_VOTW_Holocene_Eruptions.json"))
print(f"Volcanoes of the World: {len(vol):,} Holocene volcanoes, {len(eru):,} eruptions")
Volcanoes of the World: 1,214 Holocene volcanoes, 11,089 eruptions
Example 1: large eruptions since 1800
big = d[(d.vei_class == "VEI 4+") & (d.StartDateYear >= 1800)]
print(big.groupby(big.StartDateYear // 50 * 50).size().to_string())
StartDateYear
1800 19
1850 25
1900 31
1950 33
2000 25
In fifty-year bins, eruptions of VEI 4 and larger rise from 19 in 1800-1849 to 31 and 33 in the two halves of the 20th century. The last bin, 25, covers only 2000 to 2026, so it is on course for a similar rate. Counted only for large eruptions from the late 19th century on, the rate is roughly steady.
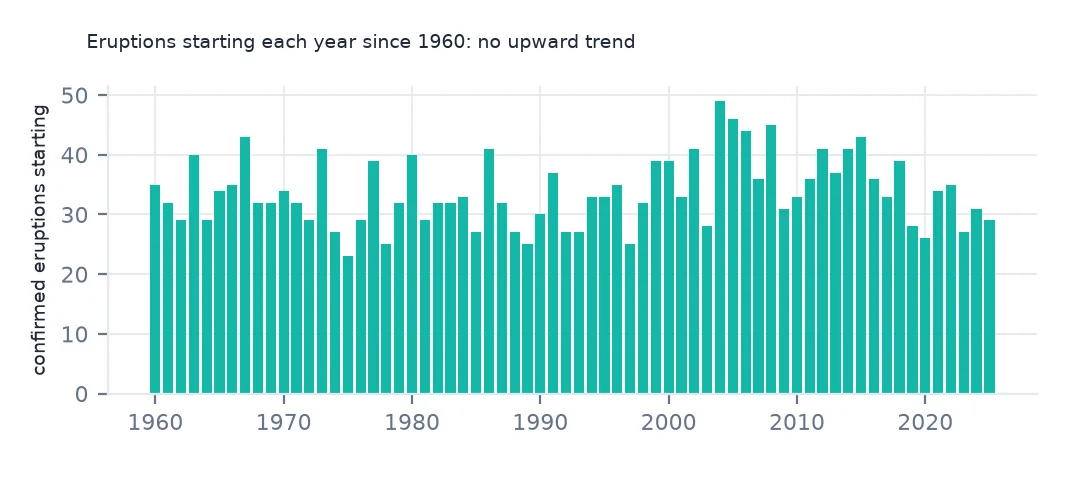
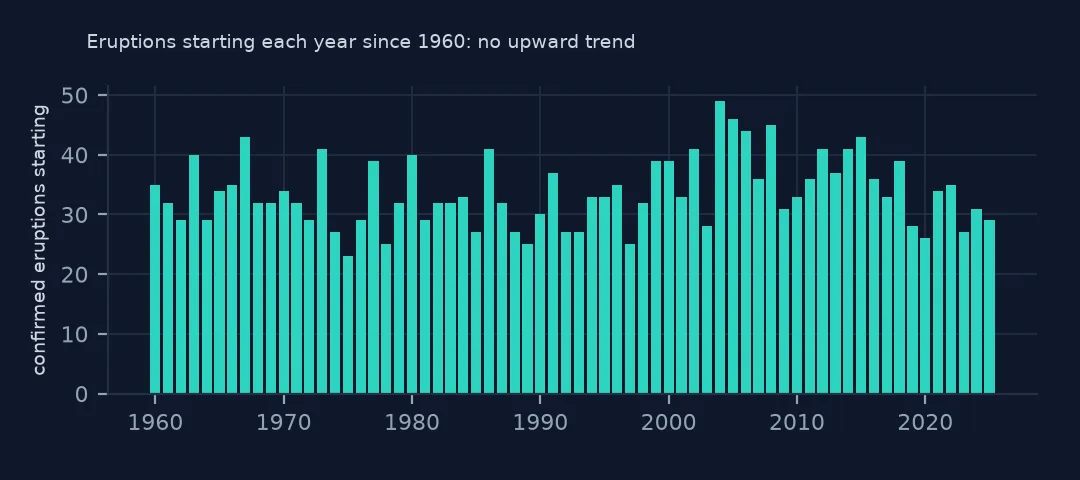
Example 2: eruptions per year since 1960
y = c[(c.StartDateYear >= 1960) & (c.StartDateYear <= 2025)].groupby("StartDateYear").size()
print(f"1960s: {y.loc[1960:1969].mean():.1f} a year; 1990s: {y.loc[1990:1999].mean():.1f}; 2010s: {y.loc[2010:2019].mean():.1f}")
1960s: 34.1 a year; 1990s: 31.8; 2010s: 36.7
Since 1960, when the record of all sizes is close to complete, the number of confirmed eruptions a year has stayed between about 32 and 37 in each decade. That is a fair answer to the question of whether volcanoes have become more active. The rise in the full table is the record filling in.
Internal links
- Eruptions by explosivity — the counts that need a fair period
- Negative years and radiocarbon — the prehistoric part of the record
- What the records hold — how eruptions enter the table
- Earthquake counts that rise over time — the same effect in an earthquake catalogue