
Eruption Years Before Year 1: Negative Years and Radiocarbon Dates
On this page
Problem statement
Sort the Smithsonian's eruptions by year and the oldest comes out at -55500; plot them on a date axis and pandas refuses everything before 1678. The year column holds years before the Common Era as negative numbers, and most eruptions of the Holocene were never seen by anyone: their years come from radiocarbon, ice cores, tree rings or layers of ash. Some of those radiocarbon years are calibrated to calendar years and some are not, and an uncalibrated radiocarbon year in the early Holocene can be off from the calendar by a thousand years or more. This page shows how the years are stored, which methods produced them, and how to keep them comparable.
Quick answer
Keep the year as an integer, never a timestamp; split it from the dating method and its uncertainty, and flag uncalibrated radiocarbon:
yr = eru[["Volcano_Name", "StartDateYear", "StartDateYearUncertainty", "StartEvidenceMethod"]].copy()
yr["era"] = np.where(yr.StartDateYear <= 0, "BCE", "CE")
yr["uncalibrated"] = yr.StartEvidenceMethod.eq("Isotopic: 14C (uncalibrated)")
print(yr.era.value_counts().to_string())
print(f"oldest {yr.StartDateYear.min()}, uncalibrated radiocarbon years: {yr.uncalibrated.sum():,}; year 0 used: {(yr.StartDateYear == 0).sum()}")
era
CE 8774
BCE 2315
oldest -55500, uncalibrated radiocarbon years: 984; year 0 used: 1
8,774 eruptions are dated in the Common Era and 2,315 before it, written as negative years, the oldest -55500. 984 years come from uncalibrated radiocarbon. One eruption is dated to year 0, which the BCE/CE calendar doesn't have (1 BCE is followed by 1 CE). The column is best read as a number line of approximate years, where an off-by-one at the boundary is far smaller than the uncertainty of any date that old.
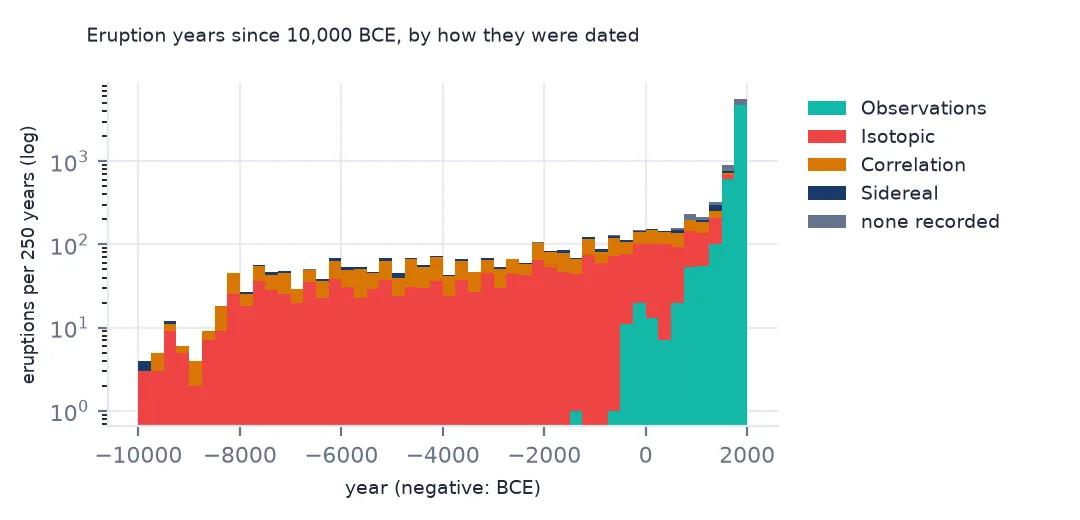
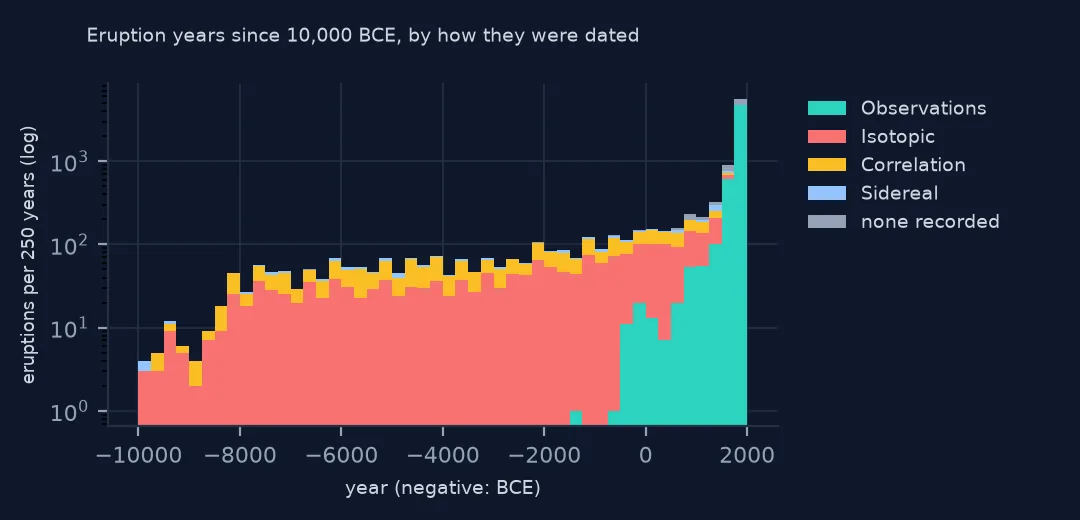
Years, methods and uncertainty
1. How old, by method
print(yr.groupby("StartEvidenceMethod").StartDateYear.agg(["size", "median"]).sort_values("size", ascending=False).head(7).to_string()) size median
StartEvidenceMethod
Observations: Reported 6468 1923.0
Correlation: Tephrochronology 1043 -2000.0
Isotopic: 14C (uncalibrated) 984 -1320.0
Isotopic: 14C (calibrated) 869 -1200.0
Sidereal: Varve Count 187 190.0
Observations: Hydrophonic 72 1982.5
Correlation: Magnetism 58 475.0
The method follows the age. Reported observations have a median year of 1923, and hydrophone detections 1982.5. Matched ash layers have a median of 2000 BCE, and radiocarbon dates of 1320 and 1200 BCE. Before written records, a year in this column is a laboratory measurement with an error bar, not an observation.
2. Uncertainty
has = yr.StartDateYearUncertainty.notna()
print(f"with a year uncertainty: {has.sum():,}; median ±{yr[has].StartDateYearUncertainty.median():.0f} years; before 1 CE: ±{yr[has & (yr.era == 'BCE')].StartDateYearUncertainty.median():.0f}")
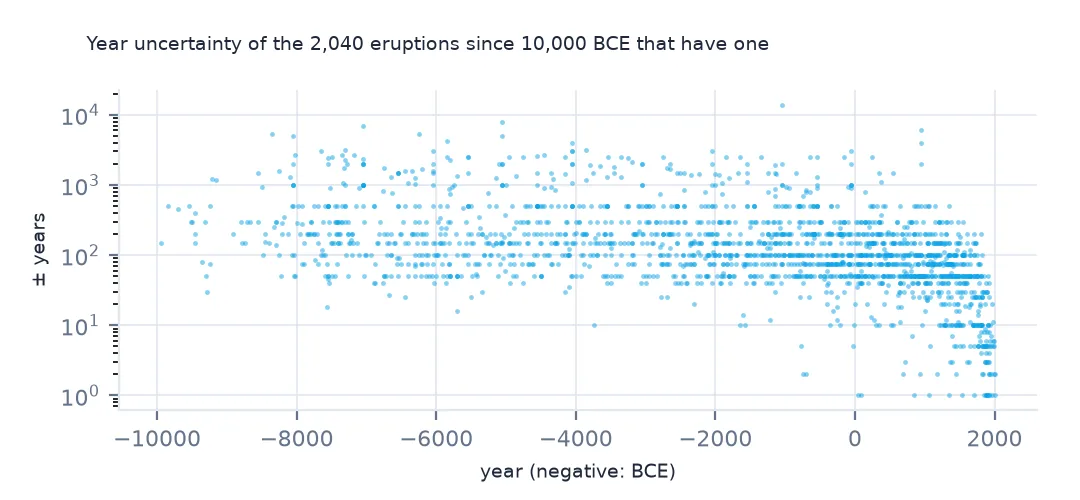
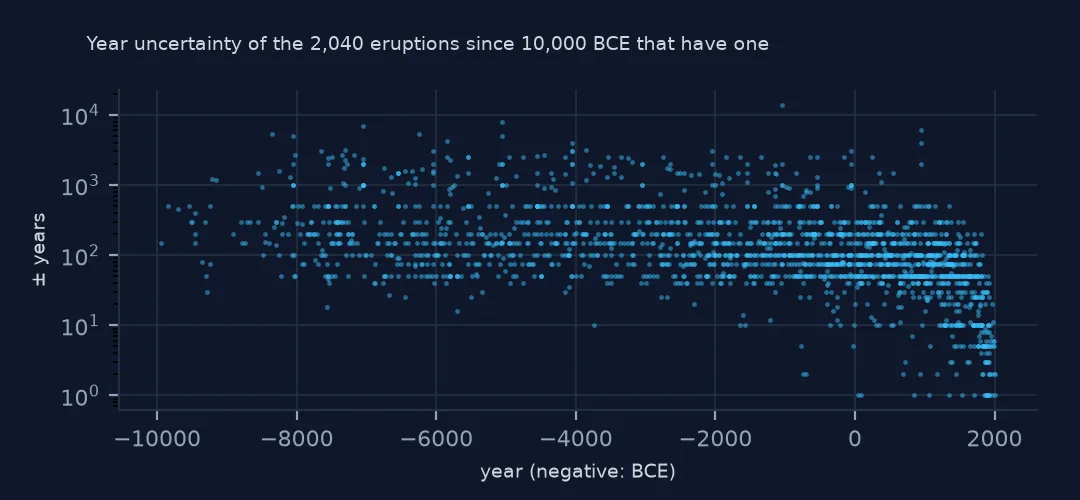
with a year uncertainty: 2,047; median ±100 years; before 1 CE: ±150
2,047 eruptions carry a year uncertainty, with a median of ±100 years, and ±150 for those before the Common Era. Many of the others have none recorded rather than none in fact. Sorting or binning by decade over those centuries gives a precision the dates don't have.
3. Why datetime fails
try:
    pd.to_datetime(yr.StartDateYear.astype(str), format="%Y")
except (ValueError, pd.errors.OutOfBoundsDatetime) as err:
    print(type(err).__name__, str(err)[:70])
ValueError time data "-104" doesn't match format "%Y". You might want to try:
%Y doesn't accept negative years, and pandas timestamps can't go back further than 1677 anyway. Keep prehistoric years as integers or floats, plot them on a numeric axis, and convert only recent, day-precise dates to timestamps.
Comparing ages
The data used on this page
The Smithsonian Institution Global Volcanism Program's Volcanoes of the World database (version 5.3 is cited as doi:10.5479/si.GVP.VOTW5-2025.5.3): its Holocene volcano and eruption tables, read from the program's WFS service on 19 October 2026 and saved on this site, because the database is edited as eruptions are reported.
from pathlib import Path
import zipfile

import geopandas as gpd
import numpy as np
import pandas as pd
import requests

Path("data").mkdir(exist_ok=True)
# Smithsonian Global Volcanism Program, Volcanoes of the World: Holocene volcanoes, Holocene eruptions and Pleistocene
# volcanoes as GeoJSON from its WFS service, with Natural Earth's populated places and 1:110m countries.
# Saved 19 October 2026, because the database is edited as eruptions are reported.
# Live: https://webservices.volcano.si.edu/geoserver/GVP-VOTW/ows?service=WFS&version=2.0.0&request=GetFeature
#       &outputFormat=json&typeName=GVP-VOTW:Smithsonian_VOTW_Holocene_Volcanoes (and ..._Holocene_Eruptions)
ARCHIVE = "gvp-votw-2026-10-19.zip"
if not Path(f"data/{ARCHIVE}").exists():
    Path(f"data/{ARCHIVE}").write_bytes(requests.get(f"https://data.spatialworkflow.io/{ARCHIVE}", timeout=600).content)
Z = zipfile.ZipFile(f"data/{ARCHIVE}")
vol = gpd.read_file(Z.open("Smithsonian_VOTW_Holocene_Volcanoes.json"))
eru = gpd.read_file(Z.open("Smithsonian_VOTW_Holocene_Eruptions.json"))
print(f"Volcanoes of the World: {len(vol):,} Holocene volcanoes, {len(eru):,} eruptions")
Volcanoes of the World: 1,214 Holocene volcanoes, 11,089 eruptions
Example 1: years before present
yr["bp"] = 1950 - yr.StartDateYear
print(yr.sort_values("StartDateYear").head(3)[["Volcano_Name", "StartDateYear", "bp", "StartEvidenceMethod"]].to_string(index=False))
Volcano_Name StartDateYear bp StartEvidenceMethod
Golden Trout Creek -55500 57450 Isotopic: Cosmic Ray Exposure
Quetrupillan -11345 13295 Isotopic: 14C (calibrated)
Yojoa, Lago -11073 13023 Isotopic: 14C (calibrated)
The oldest eruption in the table is at Golden Trout Creek in California in 55,500 BCE, dated by cosmic-ray exposure and far older than the Holocene. The next two, Quetrupillán in Chile and Lago Yojoa in Honduras, fall right at the start of the Holocene.
Radiocarbon laboratories report ages as years before present, where present is 1950. The table converts them to calendar-style years, so 1950 minus the year gives the age back, which is the scale to plot prehistoric eruptions on.
Example 2: calibrated and uncalibrated side by side
r = yr[yr.StartEvidenceMethod.str.startswith("Isotopic: 14C", na=False)]
print(r.groupby("StartEvidenceMethod").StartDateYear.describe()[["count", "min", "50%", "max"]].to_string())
count min 50% max
StartEvidenceMethod
Isotopic: 14C (calibrated) 869.0 -11345.0 -1200.0 1954.0
Isotopic: 14C (uncalibrated) 984.0 -10060.0 -1320.0 1820.0
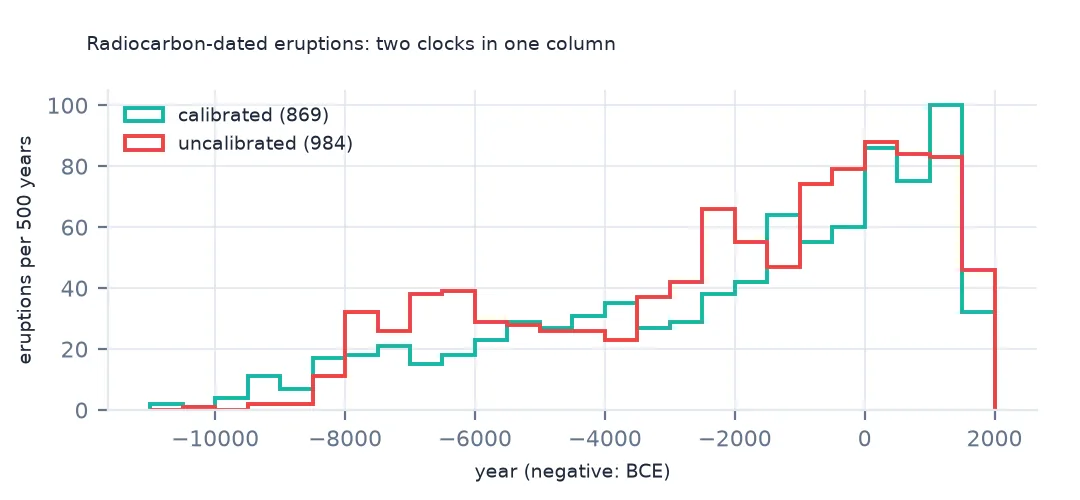
Calibrated and uncalibrated radiocarbon years sit side by side with similar ranges, but they are not on the same scale. Radiocarbon in the atmosphere has varied, so a raw radiocarbon age drifts from the calendar, by a thousand years or more in the early Holocene. The table doesn't convert the uncalibrated ones. Comparing an uncalibrated 8000 BCE with a calibrated 8000 BCE, or an ice-core year, compares two different clocks. Keep the method beside the year, and compare like with like.
Internal links
- Eruption dates — the month and day columns
- What the records hold — the dating methods
- An eruption record filling in — counting across these centuries
- Eruptions by explosivity — the largest prehistoric eruptions