
How to map transit routes and stops from GTFS shapes
On this page
Problem statement
TriMet's GTFS feed for Portland has 81 routes and 1,297 distinct shapes: every direction, branch, short-turn and depot run of a route is a shape of its own. A readable route map needs one line per route and direction, so the work is choosing the shape that stands for each — the one most trips use — joining it to the route's name, type and colour, and putting the stops on top. Done that way the feed draws as 159 lines, about 2,974 km of route.
Quick answer
Build a line per shape_id, then keep the shape used by the most trips for each route and direction:
import pandas as pd
import geopandas as gpd
from shapely.geometry import LineString

FEED = "trimet_gtfs"
routes = pd.read_csv(f"{FEED}/routes.txt", dtype=str)
trips = pd.read_csv(f"{FEED}/trips.txt", dtype=str)
pts = pd.read_csv(f"{FEED}/shapes.txt", dtype={"shape_id": str}).sort_values(
    ["shape_id", "shape_pt_sequence"])

lines = pts.groupby("shape_id")[["shape_pt_lon", "shape_pt_lat"]].apply(
    lambda g: LineString(g.to_numpy()))
shapes = gpd.GeoDataFrame({"shape_id": lines.index}, geometry=list(lines), crs=4326)

main = (trips.groupby(["route_id", "direction_id", "shape_id"]).size().rename("trips")
        .reset_index().sort_values("trips", ascending=False)
        .drop_duplicates(["route_id", "direction_id"]))
route_lines = shapes.merge(main, on="shape_id").merge(
    routes[["route_id", "route_short_name", "route_long_name", "route_type", "route_color"]],
    on="route_id")
route_lines["km"] = route_lines.to_crs(32610).length / 1000
print(len(shapes), "shapes ->", len(route_lines), "route-directions,",
      round(route_lines.km.sum()), "km")
1297 shapes -> 159 route-directions, 2974 km
route_color is a hex string without the #, and it is optional; fall back to a palette when it is blank.
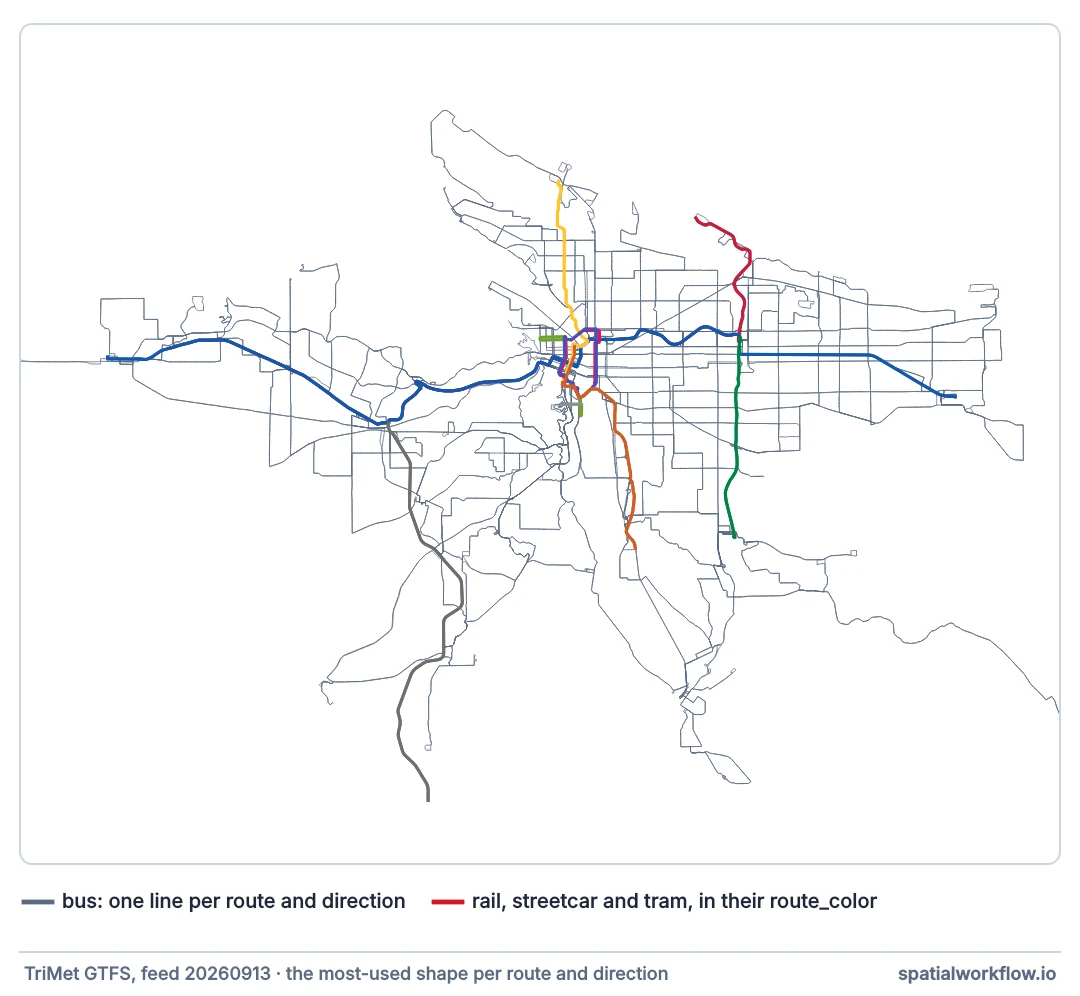
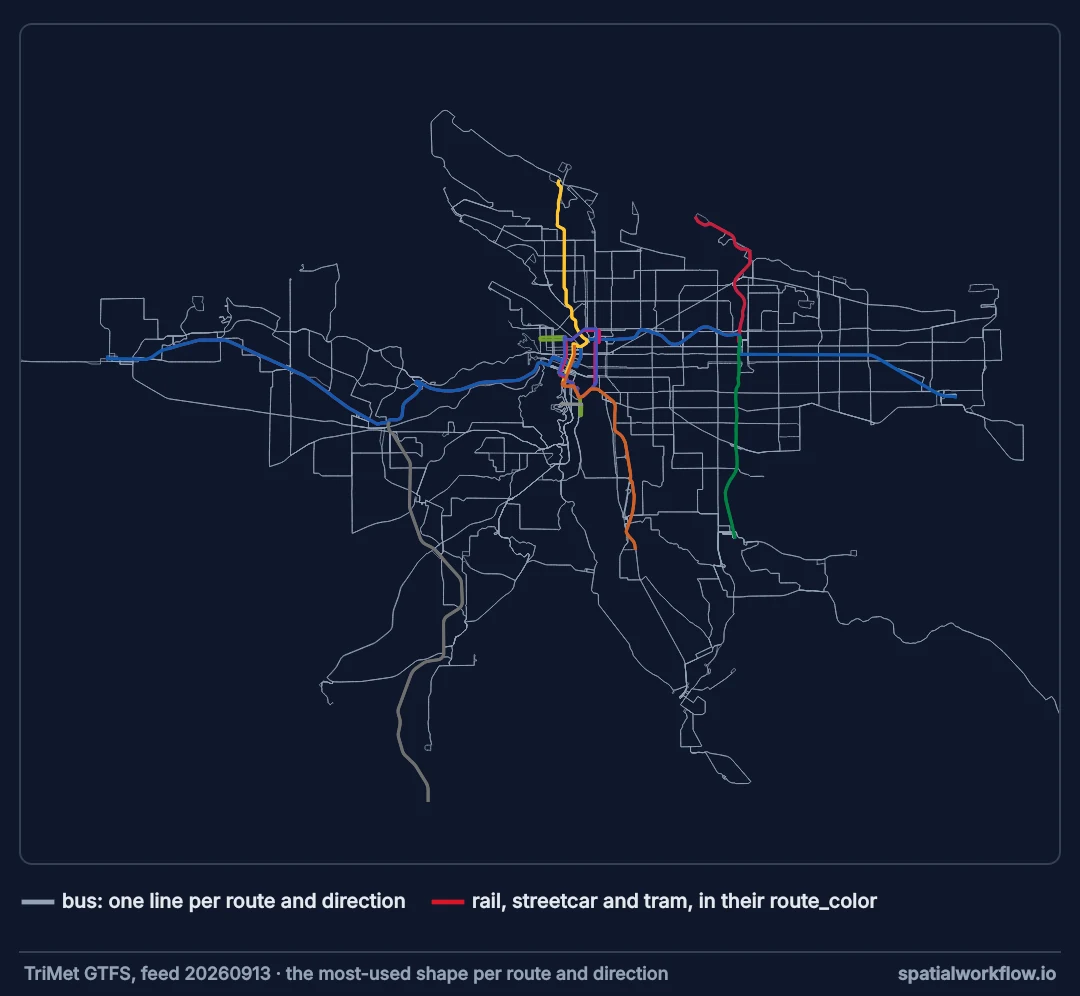
route_color; everything else is the bus network they sit on.Sort points, one line per shape, weight by service
1. Sort the points before building lines
shape_pt_sequence defines the order, and the file is not guaranteed to be sorted. A line built from unsorted points zig-zags across the city.
2. Build one line per shape
Group by shape_id and build a LineString. Vectorised construction with shapely.linestrings is faster for very large feeds, but a grouped apply is fine at this size.
3. Choose a representative shape
Count trips per route, direction and shape, and keep the most common. That drops short-turns and depot runs that would otherwise draw spurs all over the map.
4. Weight the drawing by service
A line's width or opacity should say how much service it carries. Trips per day from trips.txt on a resolved date is a good measure, as in the frequency guide.
5. Add stops, but only boarding points
Stops with location_type 1 are stations, not places to board; plotting them duplicates every rail station.
6. Project before measuring
Shape coordinates are WGS 84. Measure lengths in a projected CRS — UTM zone 10N for Portland — not in degrees.
Drawing Portland's routes from their shapes
The data used on this page
TriMet's GTFS feed for Portland, Oregon, downloaded from developer.trimet.org and unzipped to trimet_gtfs/. TriMet republishes it every few weeks, so counts of trips and stop times move between versions; the setup prints the version the numbers on this page came from.
import io
import os
import zipfile

import pandas as pd
import requests

if not os.path.exists("trimet_gtfs"):
    feed = requests.get("https://developer.trimet.org/schedule/gtfs.zip", timeout=600)
    zipfile.ZipFile(io.BytesIO(feed.content)).extractall("trimet_gtfs")
info = pd.read_csv("trimet_gtfs/feed_info.txt", dtype=str).iloc[0]
print(f"TriMet feed {info.feed_version}, valid {info.feed_start_date} to {info.feed_end_date}")
TriMet feed 20260927-20261007-0900, valid 20260927 to 20270227
Example 1 — what the route types look like
kinds = {"0": "light rail / streetcar", "2": "rail", "3": "bus", "6": "aerial tram"}
summary = (route_lines.assign(kind=route_lines.route_type.map(kinds))
           .groupby("kind").km.agg(["count", "median"]).round(1))
print(summary)
count median
kind
aerial tram 2 1.0
bus 141 18.0
light rail / streetcar 14 11.3
rail 2 23.4
Example 2 — draw it
import matplotlib
matplotlib.use("Agg")
import matplotlib.pyplot as plt

stops = pd.read_csv(f"{FEED}/stops.txt", dtype=str)
stops = stops[stops.location_type.fillna("0") == "0"]
stops = gpd.GeoDataFrame(stops, crs=4326, geometry=gpd.points_from_xy(
    stops.stop_lon.astype(float), stops.stop_lat.astype(float)))

rl = route_lines.to_crs(3857)
rl["color"] = "#" + rl.route_color.fillna("777777")
rl["width"] = rl.route_type.map({"0": 2.2, "2": 2.2}).fillna(0.6)
ax = rl.plot(color=rl.color, linewidth=rl.width, figsize=(9, 9))
stops.to_crs(3857).plot(ax=ax, markersize=0.3, color="#475569")
ax.set_axis_off()
plt.savefig("trimet_routes.png", dpi=150, bbox_inches="tight")
print("drew", len(rl), "lines and", len(stops), "stops")
drew 159 lines and 5959 stops
Example 3 — the unit trap in shape_dist_traveled
dist = pts.groupby("shape_id").shape_dist_traveled.max()
metres = shapes.set_index("shape_id").to_crs(32610).length
ratio = (dist / metres).median()
print(f"median shape_dist_traveled / length in metres: {ratio:.2f}")
median shape_dist_traveled / length in metres: 3.28
A ratio of 3.28 is metres-to-feet. GTFS does not fix the unit of shape_dist_traveled; each feed chooses, and TriMet chose feet. Use it only for ordering and interpolation within one feed, never as a distance in metres.
Shapes, representative paths and a distance column
Why shapes are separate from routes
Different trips on the same route follow different paths — one branch to the airport, another to a park-and-ride, a short-turn at a depot. Storing the path per trip through shape_id lets the feed describe that exactly, and it means a "route line" is something you derive, not something you read.
Why the most common shape is the right default
The map's job is to show the network a rider can use. A variant run twice a day adds a line to the map with the same visual weight as a line every ten minutes. Choosing by trip count keeps the lines that carry the service and makes the rare variants something you add deliberately.
Why the distance column is not a distance
shape_dist_traveled exists to let stop_times say how far along a shape each stop is, so a consumer can cut the shape between stops. The specification only requires it to increase along the shape and to use the same unit in both files. Treating it as metres gives lengths 3.28 times too long on TriMet's feed, which is plausible enough to survive a first look.
Missing shapes, colours and loops
- Missing
shapes.txtmeans routes can only be drawn stop to stop — see the straight-lines fix. - Blank
route_coloris common; choose a colour by route type. - Overlapping routes on a shared corridor draw on top of each other; offset them or aggregate to segments.
- Loop routes start and end at the same stop and can look like a closed ring.
- Antimeridian is not an issue for city feeds, but national rail feeds that cross it need care.
- Export to GeoPackage keeps colours and names as attributes.
Internal links
- GTFS explained — where shapes fit
- GTFS routes draw as straight lines between stops — when there is no shapes file
- How to calculate service frequency at every stop from GTFS — weighting the map by service
- How to clip a GTFS feed to a study area — smaller maps, smaller feeds
- How to choose and test a colour ramp in Python — colours when
route_coloris blank - How to read and write GeoPackage files in Python — saving the result
FAQ
How do I draw GTFS routes?
Build a line per shape_id from shapes.txt, then keep the most-used shape for each route and direction.
Why do I get many lines per route?
Because routes have shapes for each direction, branch and short-turn. Choose one per direction by trip count.
What unit is shape_dist_traveled?
Whatever the feed chose. TriMet uses feet. Do not assume metres.
What colour should each route be?
route_color if present, prefixed with #; otherwise a colour by route type.
Should I plot every stop?
Plot boarding points only; stations with location_type 1 duplicate their platforms.