
How to Map Bike-Share Trips as Flows in Python
On this page
Problem statement
Bike-share systems publish every trip: where it started, where it ended, when, and on what kind of bike. A month of trips is a dense origin–destination dataset at street scale, and a flow map of it shows how a city moves on two wheels. The trip files need cleaning first. Electric bikes report a slightly different coordinate on every trip, some trips have no end station, and a share of rides end where they began. Flows also change direction through the day, and one map of all trips averages the morning and evening patterns into nothing.
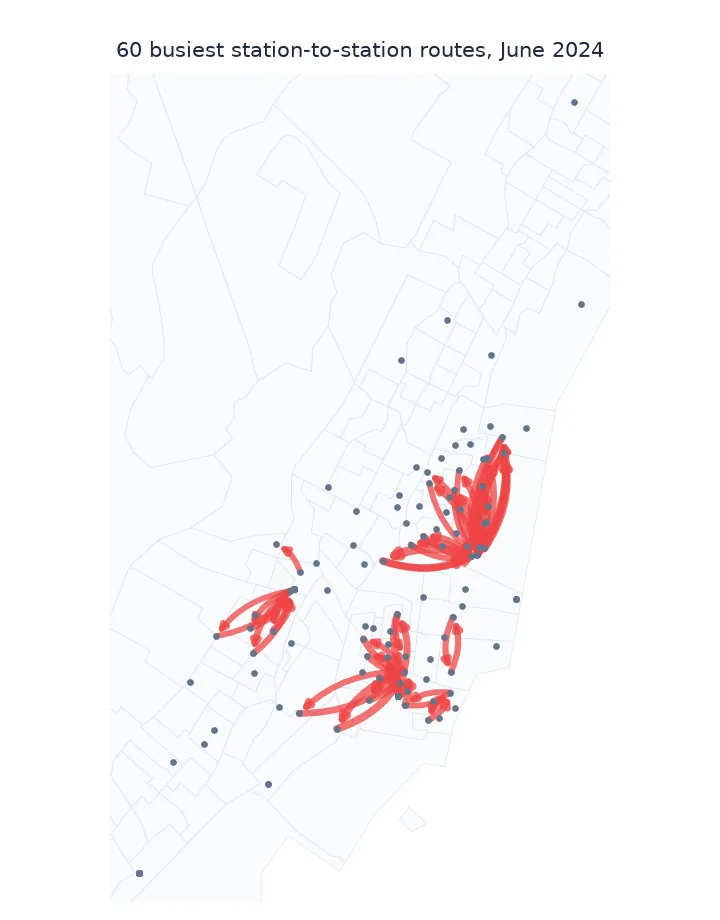
This page turns a month of Citi Bike trips in Jersey City and Hoboken into station-to-station flows. It maps the busiest routes and the morning imbalance that the operator has to rebalance by truck.
Quick answer
Give each station one location, count trips by start and end station, drop round trips, and draw the largest flows:
trips = trips.dropna(subset=["start_station_id", "end_station_id"])
pairs = trips.groupby(["start_station_id", "end_station_id"]).size().rename("trips").reset_index()
pairs = pairs[pairs.start_station_id != pairs.end_station_id]
top = pairs.nlargest(60, "trips").sort_values("trips")
fig, ax = plt.subplots(figsize=(7, 8))
TRACTS.plot(ax=ax, color="#f2f2f2", edgecolor="#d0d0d0", lw=0.3)
for _, r in top.iterrows():
    (x0, y0), (x1, y1) = XY[r.start_station_id], XY[r.end_station_id]
    ax.annotate("", (x1, y1), (x0, y0), arrowprops=dict(arrowstyle="-|>", color="#c0392b", alpha=0.7,
                lw=0.3 + 3 * np.sqrt(r.trips / top.trips.max()), connectionstyle="arc3,rad=0.2", shrinkA=0, shrinkB=1))
ax.set_xlim(*XLIM); ax.set_ylim(*YLIM); ax.set_axis_off()
fig.savefig("data/citibike_flows.png", dpi=150)
print(f"{len(pairs):,} station pairs; top 60 carry {top.trips.sum():,} of {pairs.trips.sum():,} trips ({top.trips.sum() / pairs.trips.sum():.0%})")
5,718 station pairs; top 60 carry 15,990 of 105,047 trips (15%)
One location per station, non-flows counted, time of day
1. Give each station one location
Docked trips repeat the station's coordinates exactly; electric bikes report wherever the bike was. Take the median per station and check how far individual trips stray from it:
starts = trips[["start_station_id", "start_lat", "start_lng"]].set_axis(["sid", "lat", "lng"], axis=1)
loc = starts.groupby("sid")[["lat", "lng"]].median()
dev = starts.join(loc, on="sid", rsuffix="_m")
dist_m = np.hypot((dev.lat - dev.lat_m) * 111_320, (dev.lng - dev.lng_m) * 111_320 * np.cos(np.radians(40.73)))
print(f"{len(loc)} stations; trip start within 20 m of its station median: {(dist_m < 20).mean():.0%}; "
      f"by bike type: " + ", ".join(f"{k} {(dist_m[trips.rideable_type == k] < 20).mean():.0%}" for k in sorted(trips.rideable_type.unique())))
157 stations; trip start within 20 m of its station median: 91%; by bike type: classic_bike 99%, electric_bike 84%
2. Count what cannot be a flow
Trips with no end station cannot be placed; round trips start and end at the same dock and would be zero-length lines:
raw = len(RAW)
no_end = RAW.end_station_id.isna().sum()
rt = (trips.start_station_id == trips.end_station_id).sum()
print(f"{raw:,} trips: {no_end:,} without an end station ({no_end / raw:.1%}), {rt:,} round trips ({rt / len(trips):.1%} of the rest)")
111,115 trips: 441 without an end station (0.4%), 5,626 round trips (5.1% of the rest)
3. Split by time of day
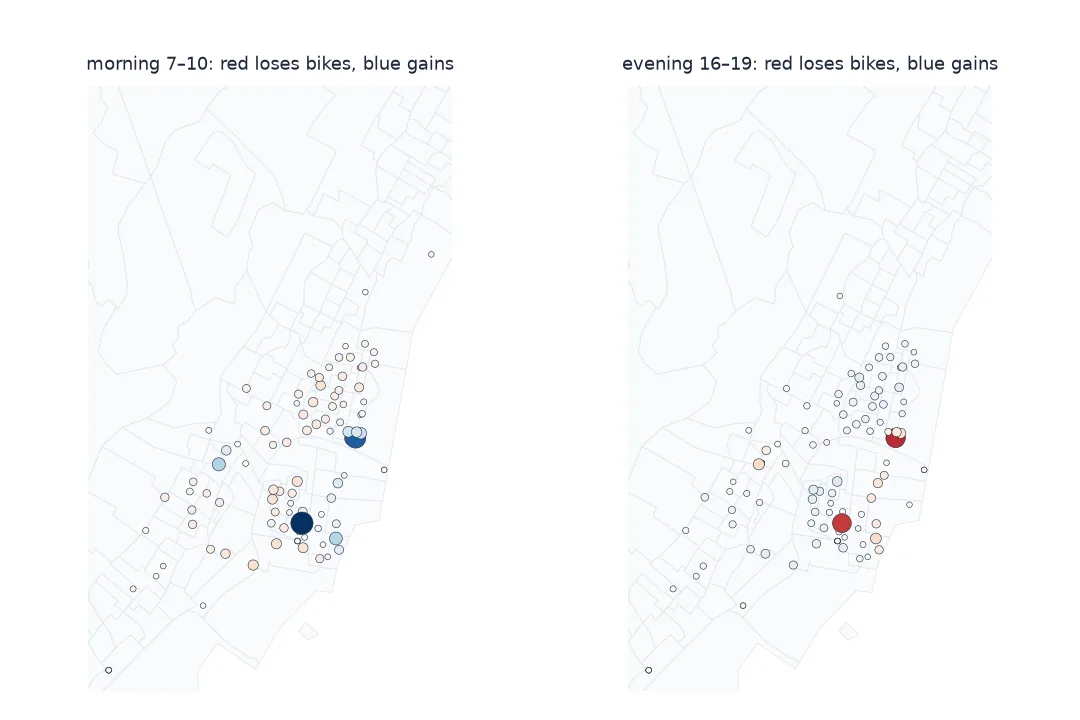
Morning and evening flows run in opposite directions. Net departures per station (trips out minus trips in) show which docks empty in the morning:
hour = trips.started_at.dt.hour
def net(mask):
    out = trips[mask].groupby("start_station_id").size()
    inn = trips[mask].groupby("end_station_id").size()
    return out.sub(inn, fill_value=0)

am, pm = net(hour.between(7, 9)), net(hour.between(16, 18))
both = pd.concat([am.rename("am"), pm.rename("pm")], axis=1).fillna(0)
print(f"stations that lose bikes in the morning peak: {(both.am > 0).sum()}; correlation of morning and evening net: {both.am.corr(both.pm):+.2f}")
print("biggest morning net loss:", NAMES[both.am.idxmax()], f"({both.am.max():+.0f} over the month)")
stations that lose bikes in the morning peak: 62; correlation of morning and evening net: -0.97
biggest morning net loss: Liberty Light Rail (+239 over the month)
The busiest routes by name
The data used on this page
Citi Bike system data, Jersey City and Hoboken trips for June 2024 (JC-202406-citibike-tripdata), and 2023 census tract outlines for New Jersey from the cartographic boundary files, projected to New Jersey State Plane (EPSG:3424).
import zipfile
from pathlib import Path

import geopandas as gpd
import matplotlib
matplotlib.use("Agg")
import matplotlib.pyplot as plt
import numpy as np
import pandas as pd
import requests

Path("data").mkdir(exist_ok=True)
SRC = {"JC-202406-citibike-tripdata.csv.zip": "https://s3.amazonaws.com/tripdata/JC-202406-citibike-tripdata.csv.zip",
       "cb_2023_34_tract_500k.zip": "https://www2.census.gov/geo/tiger/GENZ2023/shp/cb_2023_34_tract_500k.zip"}
for name, url in SRC.items():
    if not Path("data", name).exists():
        Path("data", name).write_bytes(requests.get(url, timeout=600).content)
with zipfile.ZipFile("data/JC-202406-citibike-tripdata.csv.zip") as z:
    RAW = pd.read_csv(z.open("JC-202406-citibike-tripdata.csv"), parse_dates=["started_at", "ended_at"],
                      dtype={"start_station_id": str, "end_station_id": str})
trips = RAW.dropna(subset=["start_station_id", "end_station_id"]).copy()
st = trips.groupby("start_station_id")[["start_lat", "start_lng"]].median()
pts = gpd.GeoSeries(gpd.points_from_xy(st.start_lng, st.start_lat), crs=4326).to_crs(3424)
XY = dict(zip(st.index, zip(pts.x, pts.y)))
NAMES = trips.groupby("start_station_id").start_station_name.first().to_dict()
x0, y0, x1, y1 = pts.total_bounds
XLIM, YLIM = (x0 - 1500, x1 + 1500), (y0 - 1500, y1 + 1500)
TRACTS = gpd.read_file("data/cb_2023_34_tract_500k.zip").to_crs(3424).cx[XLIM[0]:XLIM[1], YLIM[0]:YLIM[1]]
print(f"{len(RAW):,} trips in June 2024, {len(XY)} start stations, {len(TRACTS)} tracts in view")
111,115 trips in June 2024, 157 start stations, 149 tracts in view
Example 1: the busiest routes by name
named = pairs.nlargest(5, "trips").assign(start=lambda d: d.start_station_id.map(NAMES), end=lambda d: d.end_station_id.map(NAMES))
print(named[["start", "end", "trips"]].to_string(index=False))
start end trips
Hoboken Terminal - Hudson St & Hudson Pl Hoboken Ave at Monmouth St 551
Grove St PATH Marin Light Rail 463
12 St & Sinatra Dr N South Waterfront Walkway - Sinatra Dr & 1 St 440
Marin Light Rail Grove St PATH 398
South Waterfront Walkway - Sinatra Dr & 1 St 12 St & Sinatra Dr N 388
A trip file is the finest origin-destination table
A bike-share trip file is an origin–destination table at the finest grain. Each row is one trip, so the flow between two stations is a count of rows. Three cleaning steps come before any line is drawn: one coordinate per station, no trips without an end, no round trips. After that the main decision is time. A month of trips summed over all hours mixes the commute in with the evening return and the weekend leisure ride, and their directions cancel.
The morning imbalance is the operational story behind a bike-share flow map. Stations where people start more trips than they end run empty, and stations that receive more fill up. If the evening exactly reversed the morning, station by station, the correlation between morning and evening net departures would be −1. In Jersey City in June 2024 it was −0.97: the evening almost exactly undoes the morning over the month. The imbalance still has to be managed within each peak, while docks empty and fill. The busiest routes and the biggest morning loss, Liberty Light Rail, are rail stations: bike share here is largely a link to the train.
Hudson crossings, station ids and electric bikes
- Trips across the Hudson: 465 trips in this file (0.4%) end at New York stations, whose IDs are numeric rather than
JC/HB. Their coordinates come only from the end of the trip, so take station locations from both start and end columns if you map them. - Station IDs change when stations move or are renumbered; check a station's coordinates over several months before joining.
- Electric bikes report GPS positions; use the station ID, not the coordinates, to assign trips.
- Short trips (under a minute, same station) are often failed undocks; filter by duration if they matter.
- Privacy: individual trip records with exact times can identify people in some cases; publish aggregates.
Internal links
- How to make a flow map in Python — widths, curves and order
- How to build an origin–destination matrix — the table form of station pairs
FAQ
Where can I get bike-share trip data?
Many systems publish it: Citi Bike (New York and Jersey City), Divvy (Chicago), Capital Bikeshare (Washington) and others release monthly CSV files of anonymised trips.
How do I turn bike trips into flows?
Group trips by start and end station and count them; drop round trips and trips without an end station; map the largest pairs.
Why do electric bike trips have different coordinates for the same station?
They report GPS positions rather than the dock's fixed location. Assign trips by station ID and use one coordinate per station.
What does net departures per station show?
Where bikes accumulate or run out: stations with more starts than ends in a period empty out and need rebalancing.