
How to calculate service frequency at every stop from GTFS
On this page
Problem statement
A frequency map is the most requested product built from GTFS, and the steps look simple: count departures at each stop in a time window, turn the count into a headway, colour the stops. Each step has a trap. The date must be resolved through the calendar, drop-off-only calls must be excluded, departures must be split by route and direction, and the window must be stated — otherwise the map describes a timetable nobody rides.
On TriMet's Tuesday timetable, 5,729 stops have a boardable departure between 07:00 and 09:00. Measured properly — the best single route in one direction, with a guard against stops served by two buses a minute apart — 1,919 of them have a headway of 15 minutes or better.
Quick answer
Filter to one service day and window, compute the median gap per stop, route and direction, and keep the best per stop:
import numpy as np
import pandas as pd

FEED = "trimet_gtfs"
DAYS = ["monday", "tuesday", "wednesday", "thursday", "friday", "saturday", "sunday"]
cal = pd.read_csv(f"{FEED}/calendar.txt", dtype=str)
cd = pd.read_csv(f"{FEED}/calendar_dates.txt", dtype=str)
trips = pd.read_csv(f"{FEED}/trips.txt", dtype=str)

def services_on(date):
    d = pd.Timestamp(date); ds, dow = d.strftime("%Y%m%d"), DAYS[d.dayofweek]
    weekly = set(cal.loc[(cal[dow] == "1") & (cal.start_date <= ds) & (cal.end_date >= ds), "service_id"])
    ex = cd[cd.date == ds]
    return (weekly | set(ex.loc[ex.exception_type == "1", "service_id"])) \
        - set(ex.loc[ex.exception_type == "2", "service_id"])

def to_secs(s):
    p = s.str.split(":", expand=True).astype(int)
    return p[0] * 3600 + p[1] * 60 + p[2]

def stop_headways(date, start_h, end_h):
    day = trips[trips.service_id.isin(services_on(date))]
    st = pd.read_csv(f"{FEED}/stop_times.txt",
                     usecols=["trip_id", "departure_time", "stop_id", "pickup_type"],
                     dtype={"trip_id": str, "stop_id": str})
    st = st[st.trip_id.isin(day.trip_id) & (st.pickup_type != 1)]
    st["dep"] = to_secs(st.departure_time)
    st = st[(st.dep >= start_h * 3600) & (st.dep < end_h * 3600)]
    st = st.merge(day[["trip_id", "route_id", "direction_id"]], on="trip_id")

    def med_gap(x):
        x = np.sort(x.to_numpy())
        return np.median(np.diff(x)) / 60 if len(x) > 1 else np.nan

    per_rd = (st.groupby(["stop_id", "route_id", "direction_id"]).dep
              .agg(departures="size", median_gap=med_gap).reset_index())
    # two buses a minute apart are not a one-minute service
    per_rd["headway"] = np.maximum(per_rd.median_gap, (end_h - start_h) * 60 / per_rd.departures)
    best = per_rd.sort_values("headway").drop_duplicates("stop_id")
    return best.rename(columns={"route_id": "best_route"}), st

best, peak = stop_headways("2027-01-26", 7, 9)
print(len(best), "stops;", int((best.headway <= 15).sum()), "with a route every 15 min or better")
5729 stops; 1919 with a route every 15 min or better
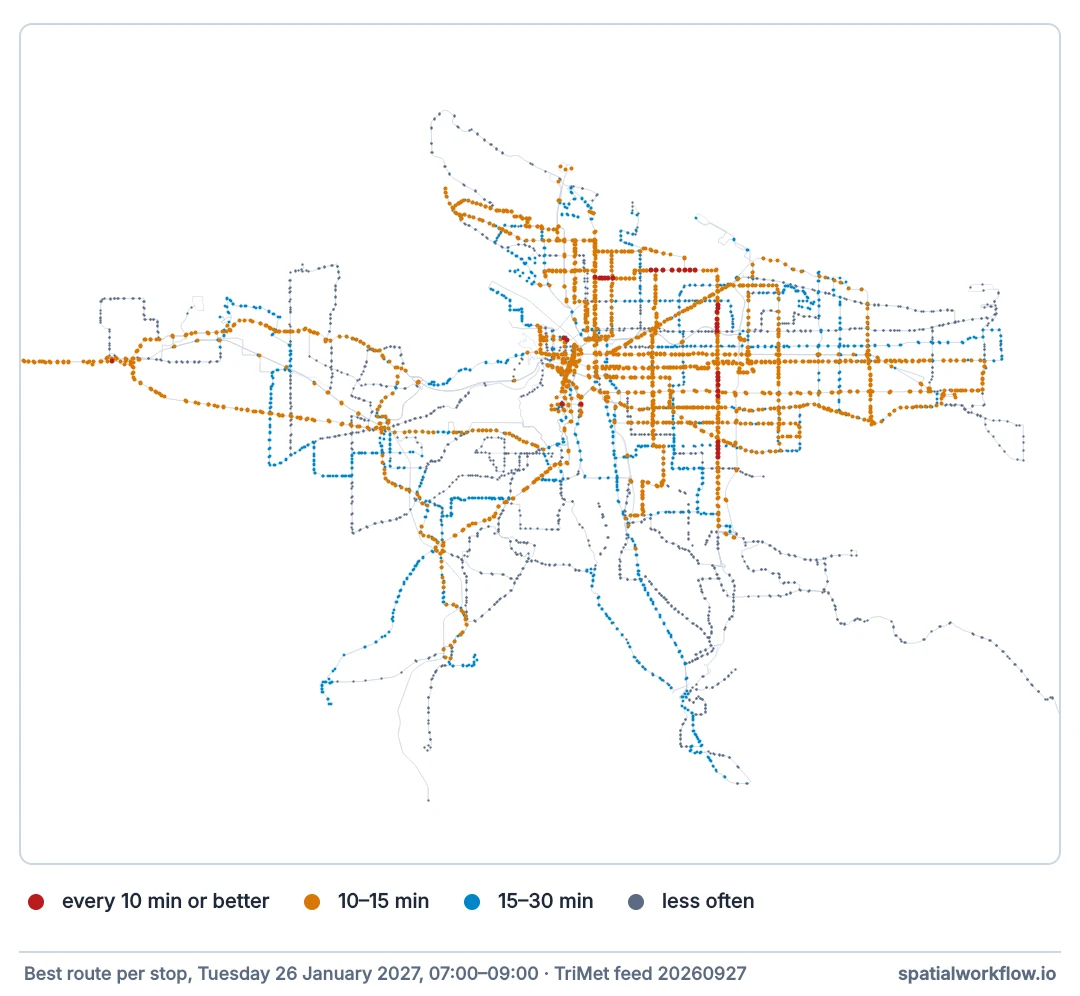
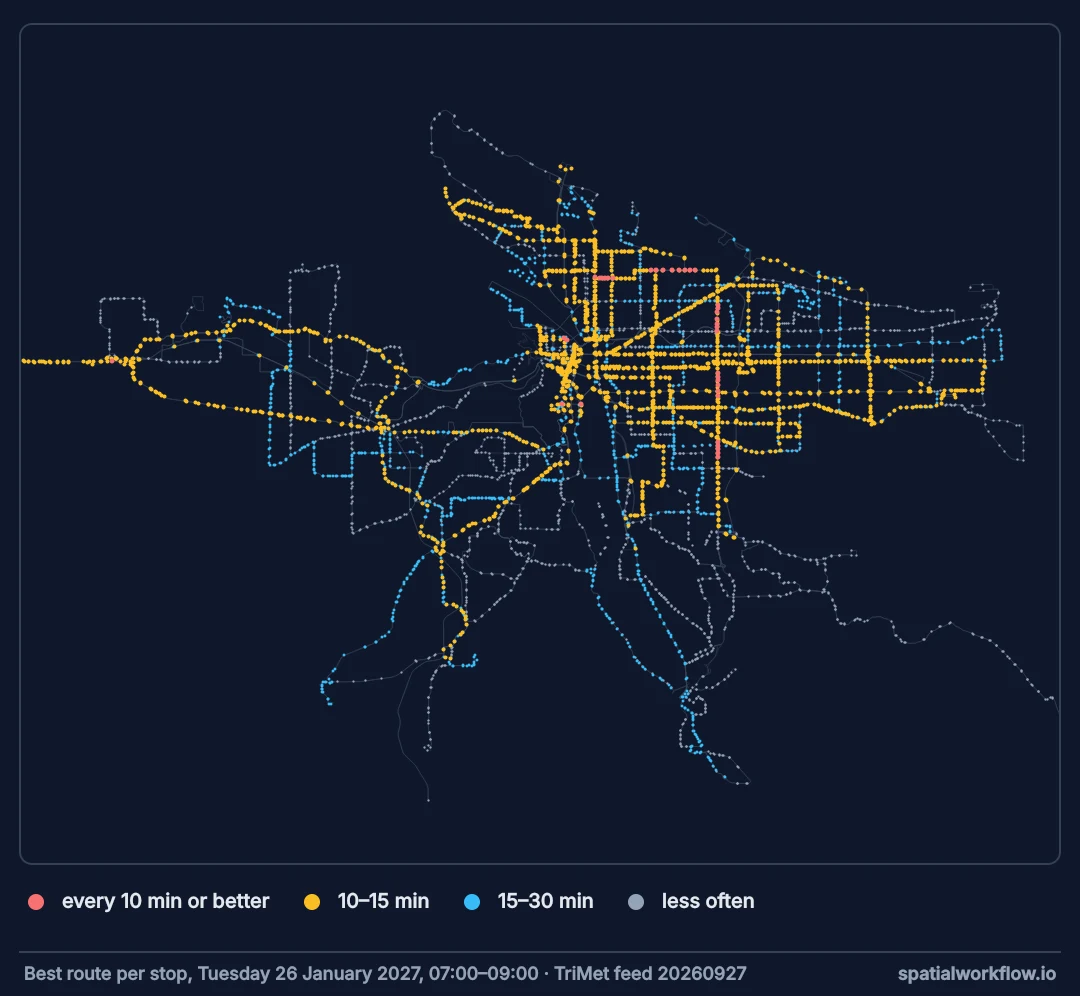
The np.maximum line is a guard. A median gap describes a pattern only when there are enough departures to form one: two buses two minutes apart have a median gap of 2.0, and without the guard they put a stop in the "10 minutes or better" band. Taking the larger of the median gap and window ÷ departures stops that. A stop with one departure gets NaN, which is also correct — one bus in two hours has no headway.
Resolve the date, drop alighting-only calls, take median gaps
1. Resolve the date
Use a date with no calendar exceptions, as in the active-service guide.
2. Drop calls where nobody can board
pickup_type = 1 means no pickup. TriMet's Gateway Transit Center has a "drop off only" stop with 68 morning departures that no rider can take.
3. Choose and state the window
Peak and base service differ. Compute each window separately and label the output.
4. Split by route and direction
Loop and terminal stops are served both ways, and trunk stops by routes that diverge. The headway a rider can use is per route and direction.
5. Take the median gap, keep the best
The median resists one irregular gap. The best route-direction per stop is the service a rider there can rely on; keep the route ID so the map can say which.
6. Join to stop locations and classify
Join to stops.txt, build points, and classify into bands whose edges are the thresholds you will state in the legend.
Frequency bands for every stop
The data used on this page
TriMet's GTFS feed for Portland, Oregon, downloaded from developer.trimet.org and unzipped to trimet_gtfs/. TriMet republishes it every few weeks, so counts of trips and stop times move between versions; the setup prints the version the numbers on this page came from.
import io
import os
import zipfile

import pandas as pd
import requests

if not os.path.exists("trimet_gtfs"):
    feed = requests.get("https://developer.trimet.org/schedule/gtfs.zip", timeout=600)
    zipfile.ZipFile(io.BytesIO(feed.content)).extractall("trimet_gtfs")
info = pd.read_csv("trimet_gtfs/feed_info.txt", dtype=str).iloc[0]
print(f"TriMet feed {info.feed_version}, valid {info.feed_start_date} to {info.feed_end_date}")
TriMet feed 20260927-20261007-0900, valid 20260927 to 20270227
Example 1 — bands for the map, and what the guard removes
bands = pd.cut(best.headway, [0, 10, 15, 30, 60, np.inf],
               labels=["<=10", "10-15", "15-30", "30-60", ">60"])
print(bands.value_counts(sort=False).to_dict(), "| no headway:", int(best.headway.isna().sum()))
raw = best.median_gap <= 10
print("<= 10 min by raw median gap:", int(raw.sum()), "| after the guard:", int((best.headway <= 10).sum()))
{'<=10': 37, '10-15': 1882, '15-30': 1533, '30-60': 1596, '>60': 449} | no headway: 232
<= 10 min by raw median gap: 134 | after the guard: 37
Example 2 — the drop-off-only trap
st_all = pd.read_csv(f"{FEED}/stop_times.txt", usecols=["trip_id", "stop_id", "pickup_type",
                     "departure_time"], dtype={"trip_id": str, "stop_id": str})
day = trips[trips.service_id.isin(services_on("2027-01-26"))]
st_all = st_all[st_all.trip_id.isin(day.trip_id)]
st_all["dep"] = to_secs(st_all.departure_time)
w = st_all[(st_all.dep >= 7 * 3600) & (st_all.dep < 9 * 3600)]
stops = pd.read_csv(f"{FEED}/stops.txt", dtype=str)
g = w[w.stop_id == "8194"]
print(stops.set_index("stop_id").stop_name["8194"], "| departures:", len(g),
      "| boardable:", int((g.pickup_type != 1).sum()))
Gateway TC (drop off only stop) | departures: 68 | boardable: 0
Example 3 — to a GeoPackage, with the parameters in the file
import geopandas as gpd

out = best.merge(stops[["stop_id", "stop_name", "stop_lat", "stop_lon"]], on="stop_id")
out = gpd.GeoDataFrame(out, crs=4326, geometry=gpd.points_from_xy(
    out.stop_lon.astype(float), out.stop_lat.astype(float)))
out["band"] = pd.cut(out.headway, [0, 10, 15, 30, 60, np.inf],
                     labels=["<=10", "10-15", "15-30", "30-60", ">60"]).astype(str)
out["service_date"], out["window"] = "2027-01-26", "07:00-09:00"
out.drop(columns=["stop_lat", "stop_lon"]).to_file(
    "trimet_frequency_20270126_0700-0900.gpkg", layer="stops")
print(out[["stop_name", "best_route", "departures", "median_gap", "headway", "band"]]
      .sort_values(["headway", "stop_name"]).head(4).to_string(index=False))   # ties break by name
stop_name best_route departures median_gap headway band
Marquam Hill Upper Tram Terminal 208 24 5.0 5.0 <=10
South Waterfront Lower Tram Terminal 208 24 5.0 5.0 <=10
SE Baseline St & 2nd 57 16 3.0 7.5 <=10
6400 Block NE Killingsworth 72 12 10.0 10.0 <=10
Best route per stop, not all departures
Why "best route per stop" and not "all departures"
A rider at a stop needs a vehicle going their way. Summing departures across routes and directions answers a different question — how busy the stop is — and makes terminals and loop stops look far more frequent than they are. The best single route-direction is conservative: a stop on two 20-minute routes that share a corridor offers better than 20 minutes to some riders, and the map will not show it. That is the right direction to be wrong in.
Why the median gap
The mean gap is pulled up by one long gap at the edge of the window and down by a pair of buses a minute apart. The median describes the regular pattern, which is what a frequency band claims to show.
Why the parameters go in the file name
A frequency map is always for a date and a window, and without them it cannot be reproduced or compared. Writing them into the layer's attributes and the file name keeps them attached when the file travels without its notebook.
Window edges, parent stations and night service
- Window edges clip gaps; widen the window by one headway and trim, if precision matters.
frequencies.txtfeeds give headways directly; use them instead of counting.- Parent stations carry no departures; aggregate platforms to the station if the map is at station level.
- Short-turns share route IDs; the headway past the turn-back point is longer.
- Night service needs the previous service day's trips past 24:00.
- Cache the day's stop times as Parquet if you compute several windows.
Internal links
- Transit frequency and headways explained — why these choices matter
- How to find the trips running on a given date in GTFS — the date filter
- How to measure the population served by frequent transit — what this feeds
- How to map transit routes and stops from GTFS shapes — the route layer underneath
- stop_times.txt is too big to load comfortably — faster reads
- Choropleth classification explained — choosing band edges
FAQ
How do I calculate bus frequency per stop from GTFS?
Filter stop times to one service date and window, drop drop-off-only calls, compute the median gap per route and direction, and keep the best per stop.
Should I count all departures at a stop?
Not for a frequency map. That counts both directions and diverging routes as one service.
What time window should I use?
The one that matches the question — typically 07:00–09:00 for peak and 10:00–14:00 for base — reported separately.
What does a NaN headway mean?
Fewer than two departures in the window. It should be shown as "infrequent", not dropped.
What about drop-off-only stops?
Exclude calls with pickup_type = 1; no rider can board them.
How do I make the result reproducible?
Store the service date, window and feed version in the output.