
How to Find Parks and Green Space in OpenStreetMap With Python
On this page
Problem statement
How much park is there per resident, and how far do people live from one? Questions like these start with a map of parks, and OpenStreetMap is the most detailed open source for one. Parks are tagged leisure=park, but green space more broadly includes woods, nature reserves, playing fields, golf courses and cemeteries. Large parks are often multipolygon relations, and small parks overlap with the land-use polygons around them, so a careless total counts the same ground twice.
This page extracts the parks of Washington, D.C. from the OpenStreetMap extract of 1 January 2026. It measures their area and size distribution, finds the largest, computes park area per resident with the Census population, and checks how much of the District lies within 400 m of a park.
Quick answer
Read leisure=park with areas enabled, clip to the boundary, and measure the union:
fp = (osmium.FileProcessor(str(PBF)).with_areas()
      .with_filter(osmium.filter.TagFilter(("leisure", "park")))
      .with_filter(osmium.filter.GeoInterfaceFilter(tags=["leisure", "name", "operator"])))
P = gpd.GeoDataFrame.from_features(fp, crs=4326)
P = gpd.clip(P[P.geom_type.isin(["Polygon", "MultiPolygon"])], DC).to_crs(32618)
P["ha"] = P.area / 1e4
park_km2 = P.union_all().area / 1e6
print(f"{len(P):,} park polygons inside D.C.; {park_km2:.1f} km² ({park_km2 / LAND_KM2:.0%} of the land)")
724 park polygons inside D.C.; 21.2 km² (13% of the land)
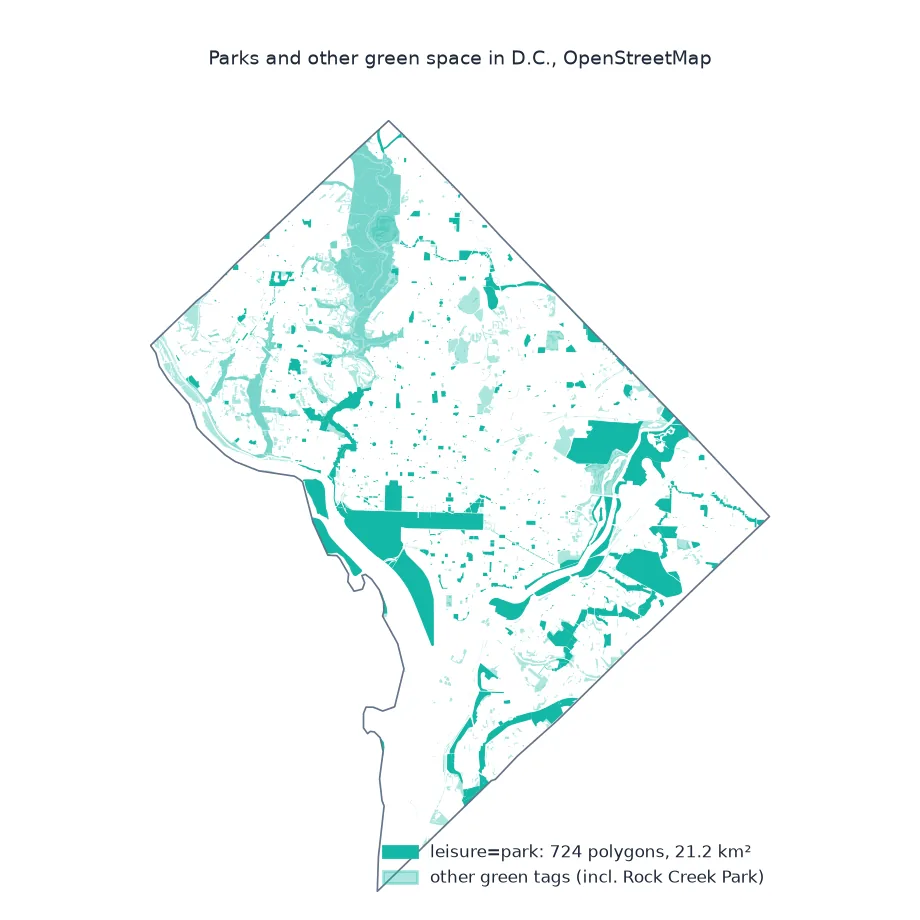
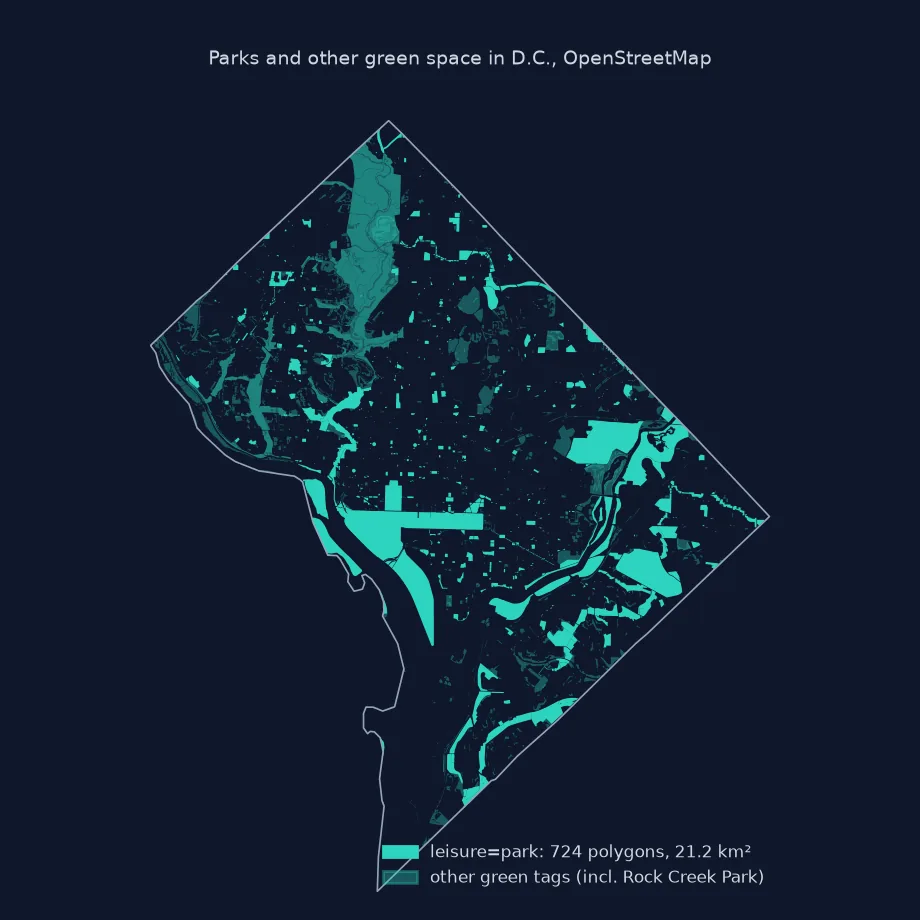
There are 724 leisure=park polygons inside the District, together 21.2 km², 13% of the land.
Size distribution, park area per resident, 400 m access
1. Size distribution and the largest parks
Most parks are small; a few large ones hold most of the area:
bins = [0, 0.1, 1, 10, 100, 1e6]
sizes = pd.cut(P.ha, bins, labels=["<0.1 ha", "0.1-1 ha", "1-10 ha", "10-100 ha", ">100 ha"]).value_counts(sort=False)
print(sizes.to_dict())
print(P.nlargest(5, "ha")[["name", "operator", "ha"]].round(0).to_string(index=False))
{'<0.1 ha': 280, '0.1-1 ha': 255, '1-10 ha': 154, '10-100 ha': 30, '>100 ha': 5}
name operator ha
National Mall National Park Service 301.0
U.S. National Arboretum NaN 183.0
Fort Dupont Park NaN 153.0
East Potomac Park National Park Service 137.0
Kenilworth Park & Aquatic Gardens National Park Service 132.0
Most parks are tiny: 280 are under 0.1 hectare, and only 5 are over 100 hectares. The largest leisure=park polygon is now the National Mall (301 ha), followed by the National Arboretum (183 ha) and Fort Dupont Park (153 ha). Rock Creek Park is missing: in OSM it is tagged leisure=nature_reserve and boundary=national_park, not leisure=park, so a parks-only filter misses one of the city's largest green spaces.
2. Park area per resident
pop = int(est.loc[est.GEOID == "11001", "POPESTIMATE2023"].iloc[0])
print(f"population 2023: {pop:,}; park area per resident: {park_km2 * 1e6 / pop:.0f} m²")
nps = P[P.operator.fillna("").str.contains("National Park Service")]
print(f"parks operated by the National Park Service: {len(nps)} polygons, {nps.union_all().area / 1e6:.1f} km² ({nps.union_all().area / 1e6 / park_km2:.0%} of park area)")
population 2023: 678,972; park area per resident: 31 m²
parks operated by the National Park Service: 40 polygons, 8.3 km² (39% of park area)
That is 31 m² of leisure=park per resident. Only 40 polygons, 39% of the park area, carry National Park Service as operator. Several NPS parks, Fort Dupont among them, have no operator tag, so the true federal share is higher.
3. Within 400 m of a park
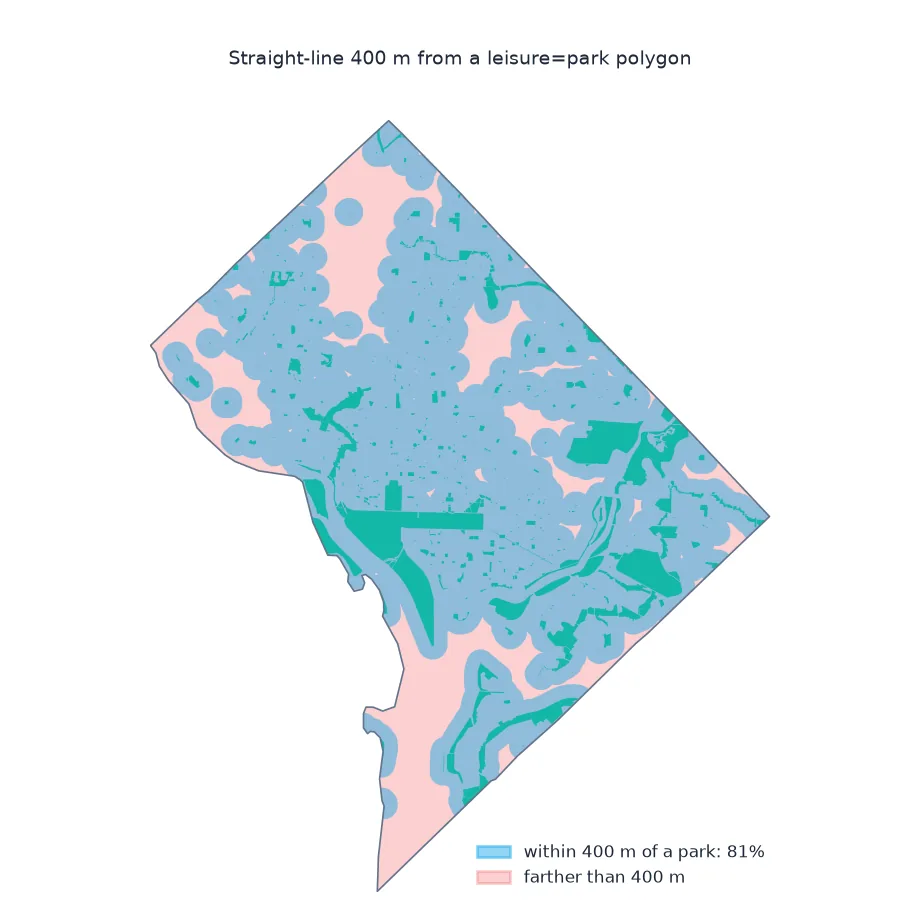
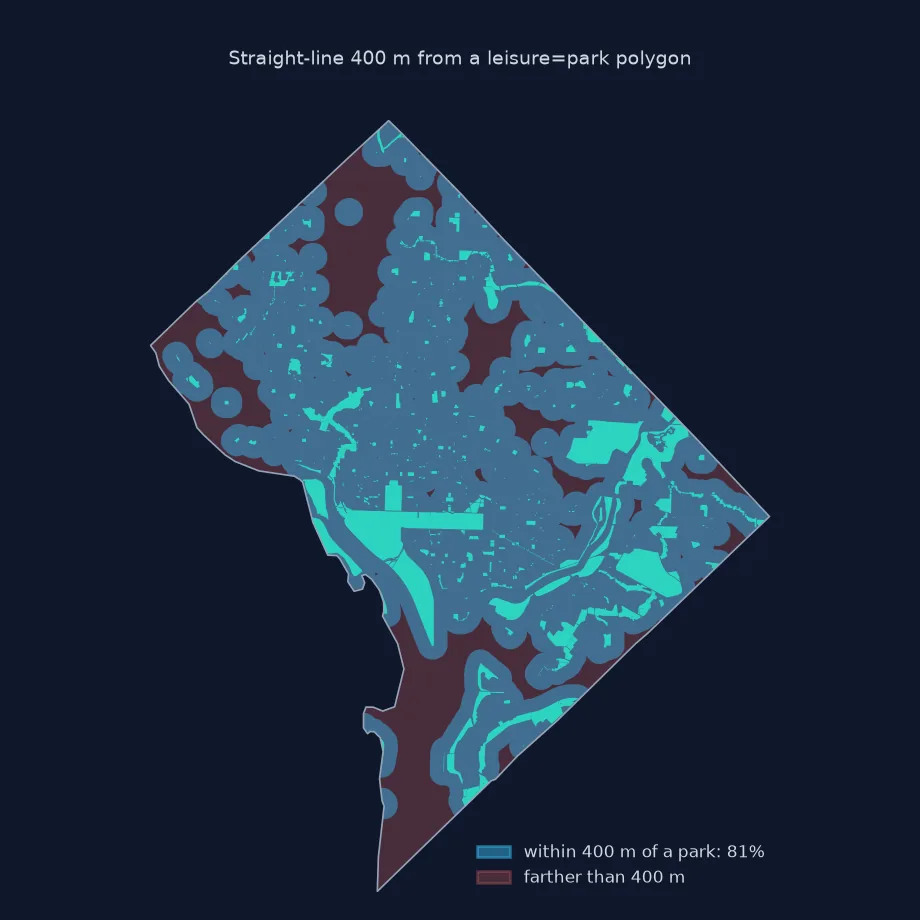
A 400 m buffer, about five minutes' walk, around every park shows which parts of the District are close to one. Small parks matter here, not area:
near = P.buffer(400).union_all().intersection(DC.to_crs(32618).geometry.iloc[0])
print(f"land within 400 m of a park: {near.area / 1e6:.1f} km² of {DC.to_crs(32618).area.iloc[0] / 1e6:.1f} km² ({near.area / DC.to_crs(32618).area.iloc[0]:.0%} of the District)")
small = P[P.ha < 1]
print(f"parks under 1 ha: {len(small):,} ({len(small) / len(P):.0%} of parks, {small.ha.sum() / P.ha.sum():.1%} of summed park area)")
land within 400 m of a park: 143.3 km² of 176.9 km² (81% of the District)
parks under 1 ha: 535 (74% of parks, 4.2% of summed park area)
81% of the District lies within 400 m of a park. The 535 parks under one hectare, 74% of all parks, hold only 4.2% of the area, but they are what puts so much of the city close to one.
Other kinds of green space
The data used on this page
The Geofabrik OpenStreetMap extract for the District of Columbia dated 1 January 2026 (© OpenStreetMap contributors, ODbL), the US Census Bureau's 2023 county cartographic boundaries at 1:500,000 and the Vintage 2023 population estimates.
from pathlib import Path

import geopandas as gpd
import osmium
import pandas as pd
import requests

Path("data").mkdir(exist_ok=True)
def cached(path, url):
    p = Path(path)
    if not p.exists():
        r = requests.get(url, timeout=600)
        r.raise_for_status()
        p.write_bytes(r.content)
    return p
PBF = cached("data/district-of-columbia-260101.osm.pbf", "https://download.geofabrik.de/north-america/us/district-of-columbia-260101.osm.pbf")
C = gpd.read_file(cached("data/cb_2023_us_county_500k.zip", "https://www2.census.gov/geo/tiger/GENZ2023/shp/cb_2023_us_county_500k.zip"))
DC = C[C.GEOID == "11001"].to_crs(4326)
LAND_KM2 = C.loc[C.GEOID == "11001", "ALAND"].iloc[0] / 1e6
est = pd.read_csv(cached("data/co-est2023-alldata.csv", "https://www2.census.gov/programs-surveys/popest/datasets/2020-2023/counties/totals/co-est2023-alldata.csv"),
                  encoding="latin-1", dtype={"STATE": str, "COUNTY": str})
est = est[est.SUMLEV == 50].assign(GEOID=lambda d: d.STATE + d.COUNTY)
print(f"D.C. land area: {LAND_KM2:.1f} km²")
D.C. land area: 158.3 km²
The District has 158.3 km² of land.
Example 1: other green space
Parks are not all of the green. Add the other green tags and compare:
fp = (osmium.FileProcessor(str(PBF)).with_areas()
      .with_filter(osmium.filter.TagFilter(("natural", "wood"), ("leisure", "nature_reserve"), ("leisure", "golf_course"),
                                           ("leisure", "pitch"), ("landuse", "cemetery"), ("landuse", "forest"), ("landuse", "grass")))
      .with_filter(osmium.filter.GeoInterfaceFilter(tags=["natural", "leisure", "landuse"])))
O = gpd.GeoDataFrame.from_features(fp, crs=4326)
O = gpd.clip(O[O.geom_type.isin(["Polygon", "MultiPolygon"])], DC).to_crs(32618)
all_green = pd.concat([P.geometry, O.geometry]).union_all()
outside = all_green.difference(P.union_all())
print(f"parks: {park_km2:.1f} km²; all green tags: {all_green.area / 1e6:.1f} km²; green outside parks: {outside.area / 1e6:.1f} km²")
parks: 21.2 km²; all green tags: 40.8 km²; green outside parks: 19.6 km²
Counting woods, nature reserves, pitches, golf courses, cemeteries and grass nearly doubles the green area to 40.8 km², with 19.6 km² outside the leisure=park polygons. Rock Creek Park is among it.
What leisure=park means
leisure=park marks an area kept open for recreation, usually public, from a pocket park on a street corner to a large wooded valley. Other green tags describe related things: natural=wood and landuse=forest for trees, leisure=nature_reserve for protected land, leisure=pitch and golf_course for sport, landuse=cemetery and grass. Which of these count as green space is a definition the analysis has to make, and the answer changes the numbers a great deal.
Washington's parks show why the measure matters as much as the data. Area is dominated by a few very large federal parks, so park area per resident is high, while access depends on many small parks spread through neighbourhoods. A buffer around every park measures that access better than area does. A proper analysis uses walking distances along the street network and the population of each block. Whatever the method, overlaps must be removed by taking unions, since park polygons often nest within each other and within land-use polygons.
Access tags, entrances and official data
- Access:
access=privateoraccess=nomarks parks the public cannot enter; filter them for accessibility studies. - Park entrances: large parks are reachable only at entrances and along paths; distance to the polygon edge overstates access.
- Name duplicates: one park can be split into several polygons with the same name; dissolve by name for park counts.
- Official data: many cities publish park boundaries; compare them with OSM before relying on either.
Internal links
- How to get land use polygons from OpenStreetMap in Python — the land-use layer
- How to generate isochrones in Python — walking distance instead of buffers
- Fixing OSM lakes that show as lines — why
with_areas()matters
FAQ
How do I get parks from OpenStreetMap?
Filter for leisure=park with areas enabled, keep the polygons, and take the union before measuring area.
What counts as green space in OSM?
Parks (leisure=park) plus, depending on the definition, woods, nature reserves, pitches, golf courses, cemeteries and grass.
How do I calculate park area per person?
Divide the union area of the park polygons inside the boundary by the population from census data.
How do I measure access to parks?
Buffer each park by a walking distance, or better, compute network distances from homes to park entrances.