
How to Get Land Use Polygons From OpenStreetMap in Python
On this page
Problem statement
OpenStreetMap's landuse tag outlines what land is used for: residential neighbourhoods, commercial and retail districts, industry, cemeteries, grass and forest. It is the only open land-use layer drawn at street-block detail for most cities. It is also a layer that nobody designed as a complete coverage. Polygons overlap, some areas have no land-use polygon at all, and the same green space can be landuse=grass, leisure=park or natural=wood depending on the mapper.
This page extracts every land-use polygon in Washington, D.C. from the OpenStreetMap extract of 1 January 2026. It measures area by class, checks how much of the District's land is covered and how much the polygons overlap, and compares the residential area with the Census population.
Quick answer
Read landuse with areas enabled, keep the polygons, clip to the boundary and measure in a metric CRS:
fp = (osmium.FileProcessor(str(PBF)).with_areas()
      .with_filter(osmium.filter.KeyFilter("landuse"))
      .with_filter(osmium.filter.GeoInterfaceFilter(tags=["landuse", "name"])))
L = gpd.GeoDataFrame.from_features(fp, crs=4326)
L = gpd.clip(L[L.geom_type.isin(["Polygon", "MultiPolygon"])], DC).to_crs(32618)
L["km2"] = L.area / 1e6
print(f"{len(L):,} land-use polygons inside D.C., {L.km2.sum():.1f} km² summed")
print(L.groupby("landuse").km2.sum().sort_values(ascending=False).head(8).round(2).to_string())
3,907 land-use polygons inside D.C., 58.9 km² summed
landuse
residential 34.08
military 9.98
grass 3.63
retail 1.88
industrial 1.77
civic_admin 1.56
cemetery 1.50
commercial 1.49
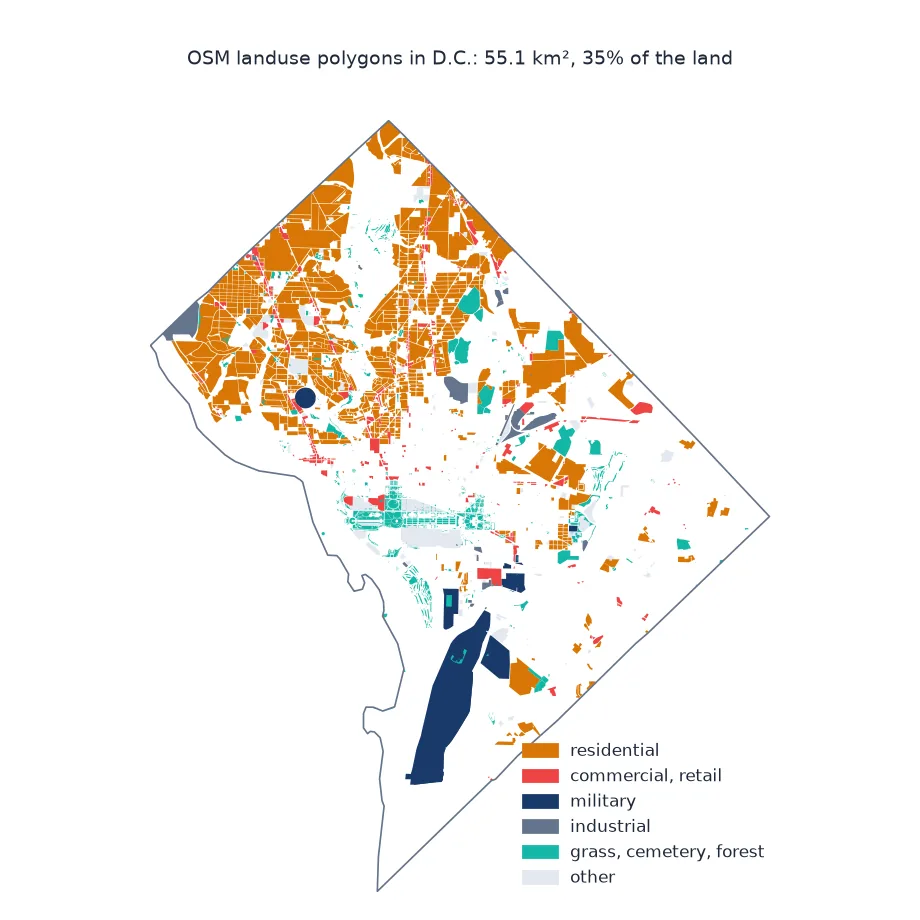
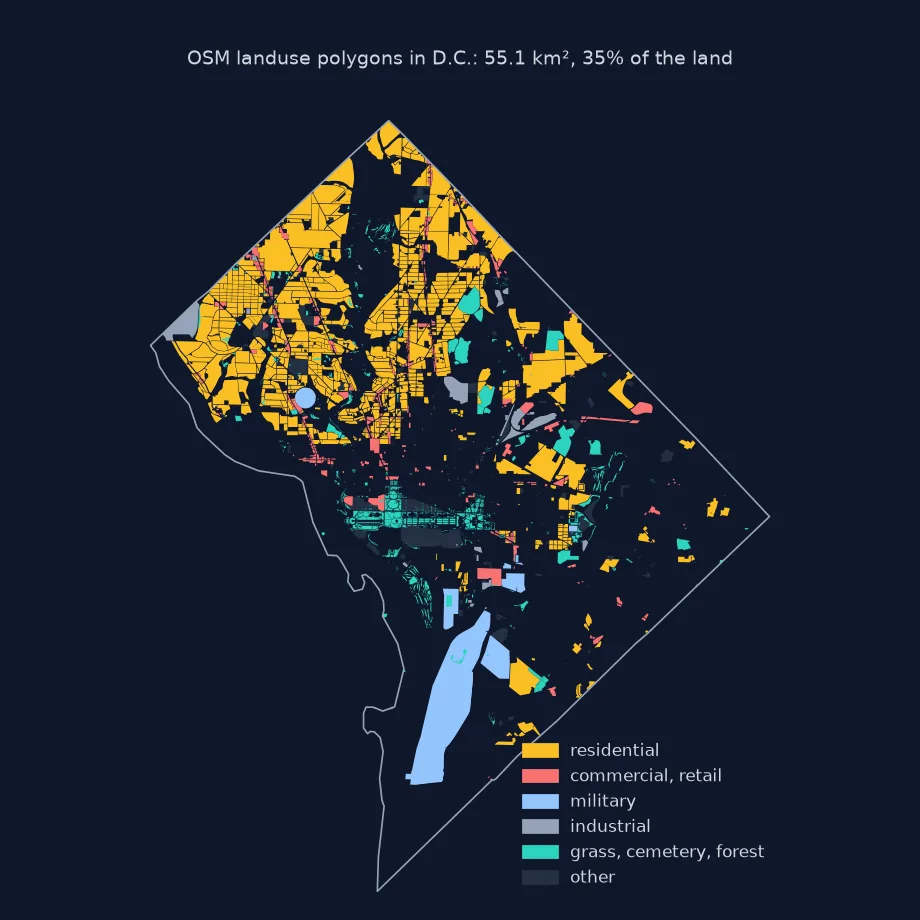
Inside the District, 3,907 land-use polygons sum to 58.9 km². Residential land dominates at 34.08 km², followed by military land at 9.98 km², most of it Joint Base Anacostia-Bolling. The retail and commercial classes are small, 1.88 and 1.49 km².
Coverage and overlaps, green space, residential land
1. Coverage and overlaps
Summed areas double-count wherever polygons overlap. Compare the sum with the area of their union, and with the District's land area:
union = L.union_all()
land_km2 = C.loc[C.GEOID == "11001", "ALAND"].iloc[0] / 1e6
print(f"sum of polygon areas: {L.km2.sum():.1f} km²; area of their union: {union.area / 1e6:.1f} km²")
print(f"D.C. land area (Census ALAND): {land_km2:.1f} km²; covered by some landuse polygon: {union.area / 1e6 / land_km2:.0%}")
sum of polygon areas: 58.9 km²; area of their union: 55.1 km²
D.C. land area (Census ALAND): 158.3 km²; covered by some landuse polygon: 35%
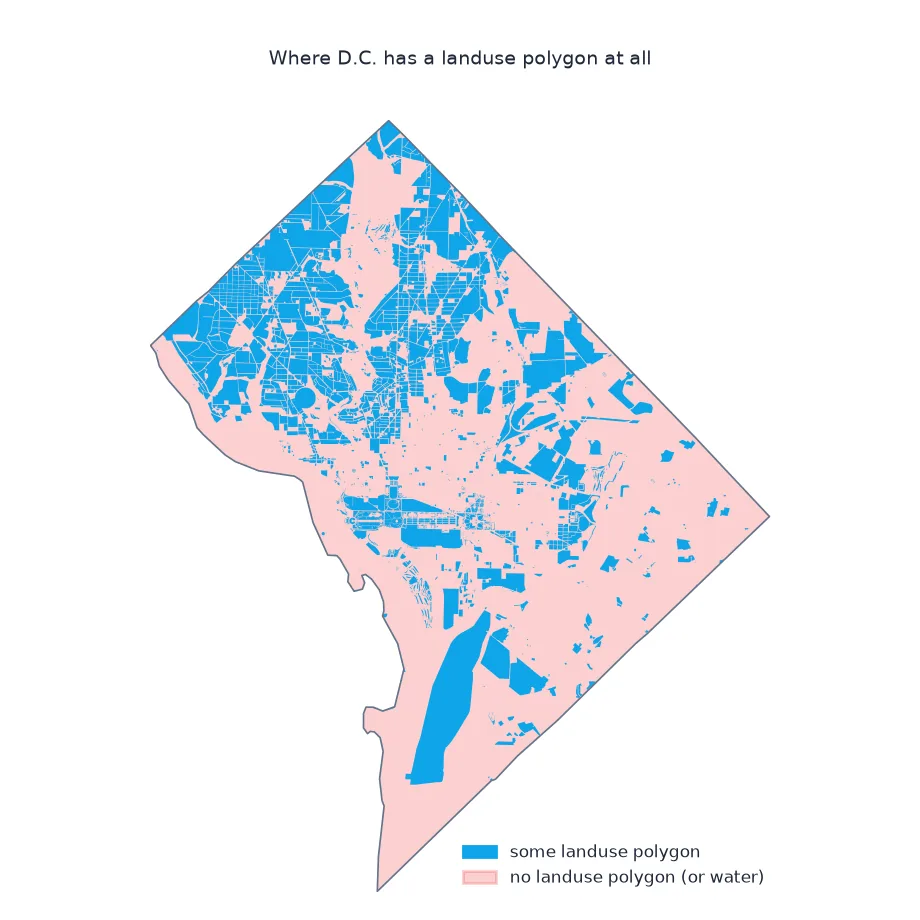
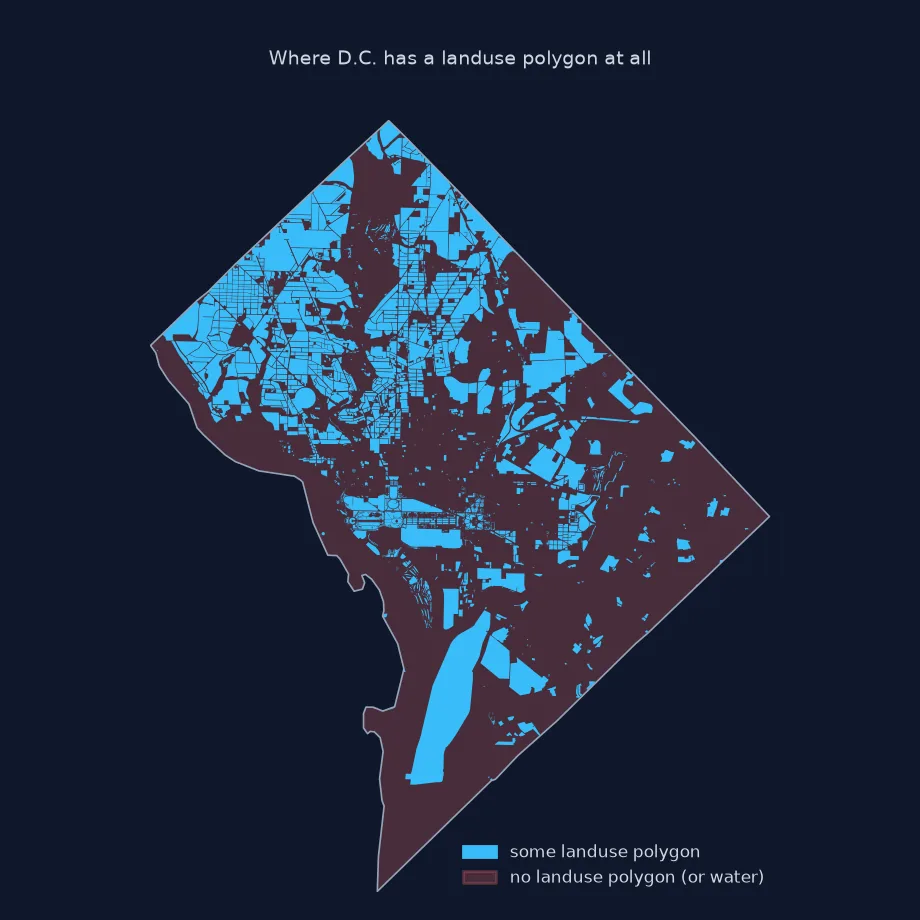
Overlaps account for 3.8 km² of the summed area: the union is 55.1 km². That union covers only 35% of the District's land, so the rest has no land-use polygon at all. Shares of "all land" computed from this layer would be badly wrong.
2. Land use and green space
Green space is split across keys. Combine landuse grass, forest and cemetery with leisure=park and natural=wood into one green layer:
fp = (osmium.FileProcessor(str(PBF)).with_areas()
      .with_filter(osmium.filter.TagFilter(("leisure", "park"), ("natural", "wood")))
      .with_filter(osmium.filter.GeoInterfaceFilter(tags=["leisure", "natural"])))
G2 = gpd.GeoDataFrame.from_features(fp, crs=4326)
G2 = gpd.clip(G2[G2.geom_type.isin(["Polygon", "MultiPolygon"])], DC).to_crs(32618)
green_lu = L[L.landuse.isin(["grass", "forest", "cemetery", "recreation_ground", "meadow"])]
green = pd.concat([green_lu.geometry, G2.geometry]).union_all()
print(f"green from landuse only: {green_lu.union_all().area / 1e6:.1f} km²; with leisure=park and natural=wood: {green.area / 1e6:.1f} km² ({green.area / 1e6 / land_km2:.0%} of the land)")
green from landuse only: 5.8 km²; with leisure=park and natural=wood: 38.4 km² (24% of the land)
Land-use tags alone find 5.8 km² of green space. Adding leisure=park and natural=wood raises it to 38.4 km², 24% of the land, because most of D.C.'s green is tagged with those keys instead.
3. Residential land and population
res = L[L.landuse == "residential"].union_all().area / 1e6
pop = int(est.loc[est.GEOID == "11001", "POPESTIMATE2023"].iloc[0])
print(f"residential land: {res:.1f} km²; population 2023: {pop:,}; {pop / res:,.0f} people per km² of residential land vs {pop / land_km2:,.0f} per km² of all land")
residential land: 34.1 km²; population 2023: 678,972; 19,923 people per km² of residential land vs 4,289 per km² of all land
The District's 678,972 residents live at 4,289 people per km² of land overall, but at 19,923 per km² of residential land, more than four and a half times as dense.
The largest land use polygons
The data used on this page
The Geofabrik OpenStreetMap extract for the District of Columbia dated 1 January 2026 (© OpenStreetMap contributors, ODbL), the US Census Bureau's 2023 county cartographic boundaries at 1:500,000 with their land area field, and the Vintage 2023 population estimates.
from pathlib import Path

import geopandas as gpd
import osmium
import pandas as pd
import requests

Path("data").mkdir(exist_ok=True)
def cached(path, url):
    p = Path(path)
    if not p.exists():
        r = requests.get(url, timeout=600)
        r.raise_for_status()
        p.write_bytes(r.content)
    return p
PBF = cached("data/district-of-columbia-260101.osm.pbf", "https://download.geofabrik.de/north-america/us/district-of-columbia-260101.osm.pbf")
C = gpd.read_file(cached("data/cb_2023_us_county_500k.zip", "https://www2.census.gov/geo/tiger/GENZ2023/shp/cb_2023_us_county_500k.zip"))
DC = C[C.GEOID == "11001"].to_crs(4326)
est = pd.read_csv(cached("data/co-est2023-alldata.csv", "https://www2.census.gov/programs-surveys/popest/datasets/2020-2023/counties/totals/co-est2023-alldata.csv"),
                  encoding="latin-1", dtype={"STATE": str, "COUNTY": str})
est = est[est.SUMLEV == 50].assign(GEOID=lambda d: d.STATE + d.COUNTY)
print(f"D.C. land area: {C.loc[C.GEOID == '11001', 'ALAND'].iloc[0] / 1e6:.1f} km²")
D.C. land area: 158.3 km²
The District has 158.3 km² of land, by the Census Bureau's measure.
Example 1: the largest polygons
big = L.nlargest(5, "km2")[["landuse", "name", "km2"]]
print(big.round(2).to_string(index=False))
print(f"polygons under 0.01 km² (1 ha): {(L.km2 < 0.01).sum():,} of {len(L):,}")
landuse name km2
military Joint Base Anacostia Bolling 4.80
military Bolling Air Force Base 2.47
residential NaN 0.94
civic_admin NaN 0.92
residential NaN 0.88
polygons under 0.01 km² (1 ha): 3,074 of 3,907
The two largest polygons are military: Joint Base Anacostia-Bolling, 4.80 km², and a second polygon named Bolling Air Force Base, 2.47 km², for part of the same installation. Most polygons are small: 3,074 of the 3,907 are under one hectare.
What landuse describes
landuse describes the primary use of an area of land, and its values cover the usual classes of urban planning: residential, commercial, retail, industrial, institutional and religious, plus cemetery, grass, forest, farmland, construction and many more. Mappers draw these polygons at very different scales. In one place a single polygon covers a whole neighbourhood; elsewhere every lawn is its own landuse=grass. The tag sits beside other area tags that describe land too, leisure=park, natural=wood, amenity=university, so a land-use map built from landuse alone misses much of what a reader would call land use.
That makes three checks essential before computing shares. Overlaps inflate summed areas, so measure the union. Coverage is incomplete, so report how much of the land has any land-use polygon before quoting percentages of the whole. And categories need deciding: which tags count as green space, and whether a university campus is institutional or something else. With those decisions made explicit, OSM land use supports comparisons such as density on residential land, which says more about how a city lives than density over its whole area.
Nested polygons, grass and global land cover
- Nested polygons: a park inside a residential polygon is both; decide whether the inner use replaces the outer one, for example by subtracting it.
- landuse=grass: in cities often road verges and lawns, not parks; keep it separate from
leisure=park. - Rasterising: for analyses with land-cover rasters, burn polygons in a fixed priority order.
- Global land cover: for consistent coverage, satellite products such as ESA WorldCover complement OSM's patchy polygons.
Internal links
- How to find parks and green space in OpenStreetMap with Python — green space in depth
- How to read an OpenStreetMap PBF file in Python — reading the extract
- OSM data completeness explained — how much is mapped
FAQ
How do I get land use from OpenStreetMap?
Filter for the landuse key with areas enabled, keep the polygons, and measure areas in a projected CRS.
Does OpenStreetMap land use cover everywhere?
No; coverage depends on mappers, and in D.C. part of the land has no land-use polygon. Measure the union of polygons against the land area first.
Why is the total land-use area larger than the city?
Polygons overlap; use the area of their union instead of the sum.
Is a park a land use in OSM?
Parks are usually leisure=park, not landuse; combine both keys for green space.