
My Points Plot in the Ocean: Fixing Swapped Latitude and Longitude
On this page
Problem statement
You build points from a CSV, plot them, and the whole dataset is in the sea — off Somalia, in Antarctica, or stacked on a single dot off the coast of Ghana.
df = pd.read_csv("data/raw/stops_clean.csv")
gdf = gpd.GeoDataFrame(df, geometry=gpd.points_from_xy(df["lat"], df["lon"]), crs="EPSG:4326")
print(gdf.total_bounds.round(2))      # x from 53.5 to 54.2, y from -3.05 to -2.08
[53.5 -3.05 54.2 -2.08]
Those are Lancashire's 8,640 bus stops from the Department for Transport's NaPTAN register (set up under Code examples), built with the arguments in the order people say them — latitude, longitude. Every point is now in the Indian Ocean, and nothing complained.
Three other mistakes put points in the wrong place and look much the same on a map — a dot at (0, 0), a cluster from decimal commas, a small offset from a wrongly declared CRS. The checks below tell the four apart.
Quick answer
Build points with longitude first, then sanity-check the range and the extent:
points_from_xy(lon, lat)— x is longitude, y is latitude- assert latitude is within ±90 and longitude within ±180
- drop rows where either coordinate is null or exactly zero
- print the extent and compare it against where the data should be
- set the CRS to match the numbers, and reproject rather than relabel
import geopandas as gpd
import pandas as pd

df = pd.read_csv("data/raw/stations.csv")
df["lon"] = pd.to_numeric(df["lon"], errors="coerce")
df["lat"] = pd.to_numeric(df["lat"], errors="coerce")

bad = df["lat"].abs().gt(90) | df["lon"].abs().gt(180)
print(f"{bad.sum()} rows out of range — likely swapped")
if bad.any():
    df.loc[bad, ["lon", "lat"]] = df.loc[bad, ["lat", "lon"]].to_numpy()

df = df.dropna(subset=["lon", "lat"])
df = df[~((df["lon"] == 0) & (df["lat"] == 0))]

gdf = gpd.GeoDataFrame(df, geometry=gpd.points_from_xy(df["lon"], df["lat"]), crs="EPSG:4326")
print(len(gdf), "rows;", gdf.total_bounds.round(2))      # [minx, miny, maxx, maxy] — longitude first
0 rows out of range — likely swapped
8575 rows; [-3.05 -3.04 54.17 54.2 ]
stations.csv is those stops as a messy export delivers them — some rows swapped, some blanks filled with zero, some written with decimal commas (the damage is listed in the setup). The range test found none of the swapped rows, because in Lancashire neither value exceeds 90 either way round, and the decimal-comma rows fell out as NaN and were dropped. A latitude above 90 is impossible, so any row failing that test is definitively swapped; the rows that pass it need a different check, below.
The four patterns
Axis order, ranges and Null Island
Remember the axis order
import geopandas as gpd

# correct: x = longitude (east–west), y = latitude (north–south)
gpd.points_from_xy(df["lon"], df["lat"])

# wrong: mirrors every point across the y = x diagonal
gpd.points_from_xy(df["lat"], df["lon"])
The rule is easy to lose because everyday speech says "latitude and longitude" and the GeoJSON specification says [longitude, latitude]. Naming the variables lon/lat rather than x/y removes most of the risk, because the call then reads wrongly when it is wrong.
Test the ranges
def coordinate_report(df, lon="lon", lat="lat"):
    out = {
        "rows": len(df),
        "lon_null": int(df[lon].isna().sum()),
        "lat_null": int(df[lat].isna().sum()),
        "lat_out_of_range": int(df[lat].abs().gt(90).sum()),
        "lon_out_of_range": int(df[lon].abs().gt(180).sum()),
        "null_island": int(((df[lon] == 0) & (df[lat] == 0)).sum()),
        "lon_range": (float(df[lon].min()), float(df[lon].max())),
        "lat_range": (float(df[lat].min()), float(df[lat].max())),
    }
    return out

raw = pd.read_csv("data/raw/stations.csv")
for col in ("lon", "lat"):
    raw[col] = pd.to_numeric(raw[col], errors="coerce")
for k, v in coordinate_report(raw).items():
    print(f"{k:18} {v}")
rows 8640
lon_null 40
lat_null 40
lat_out_of_range 0
lon_out_of_range 0
null_island 25
lon_range (-3.053714312, 54.171557175)
lat_range (-3.039060924, 54.20086452)
lat_out_of_range > 0 is proof of a swap. Zero out-of-range rows does not prove the opposite — a swap between two values that are both under 90 is perfectly possible, which is what the extent check below is for.
Compare the extent with where the data belongs
EXPECTED = {          # rough bounding boxes, lon/lat
    "uk":      (-8.7, 49.8, 1.8, 60.9),
    "germany": (5.9, 47.3, 15.0, 55.1),
    "kenya":   (33.9, -4.7, 41.9, 5.5),
}

def within_expected(gdf, key):
    minx, miny, maxx, maxy = gdf.total_bounds
    exp = EXPECTED[key]
    ok = (exp[0] - 1 <= minx and maxx <= exp[2] + 1
          and exp[1] - 1 <= miny and maxy <= exp[3] + 1)
    print(f"data bounds : {minx:.2f} {miny:.2f} {maxx:.2f} {maxy:.2f}")
    print(f"expected    : {exp}")
    print("within expected area:", ok)
    return ok

within_expected(gdf, "uk")
data bounds : -3.05 -3.04 54.17 54.20
expected : (-8.7, 49.8, 1.8, 60.9)
within expected area: False
For data that should be in the UK, longitudes near 51 and latitudes near -0.1 are the signature of a swap — both values are in range individually, and only the geography reveals it.
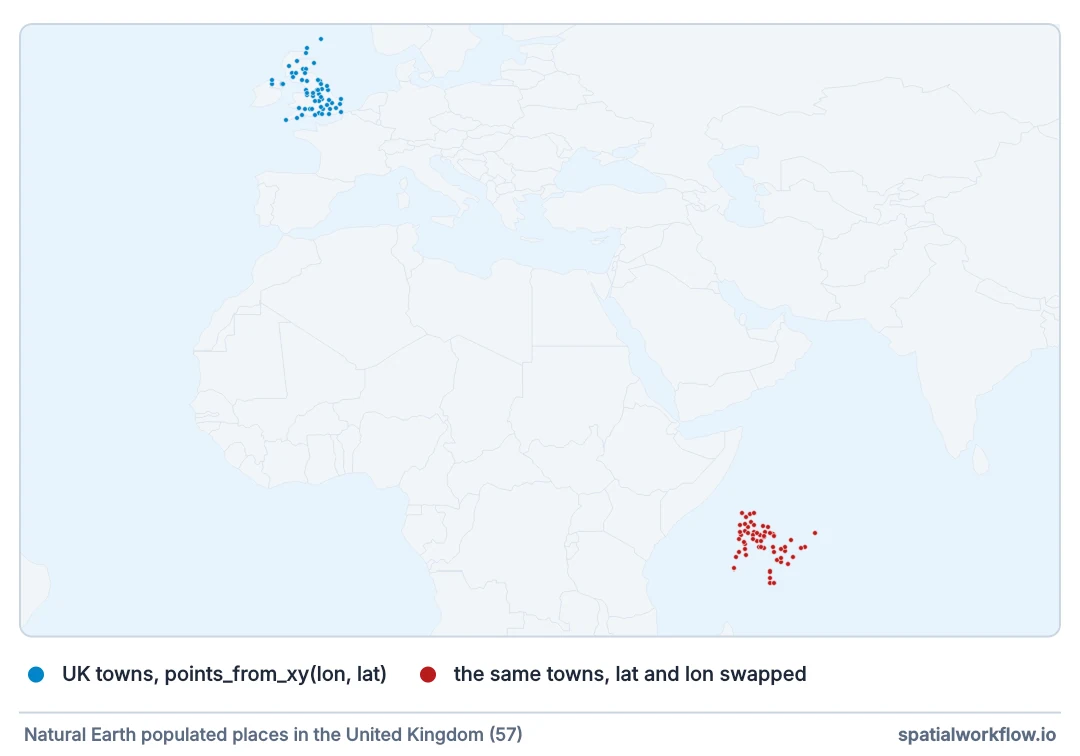
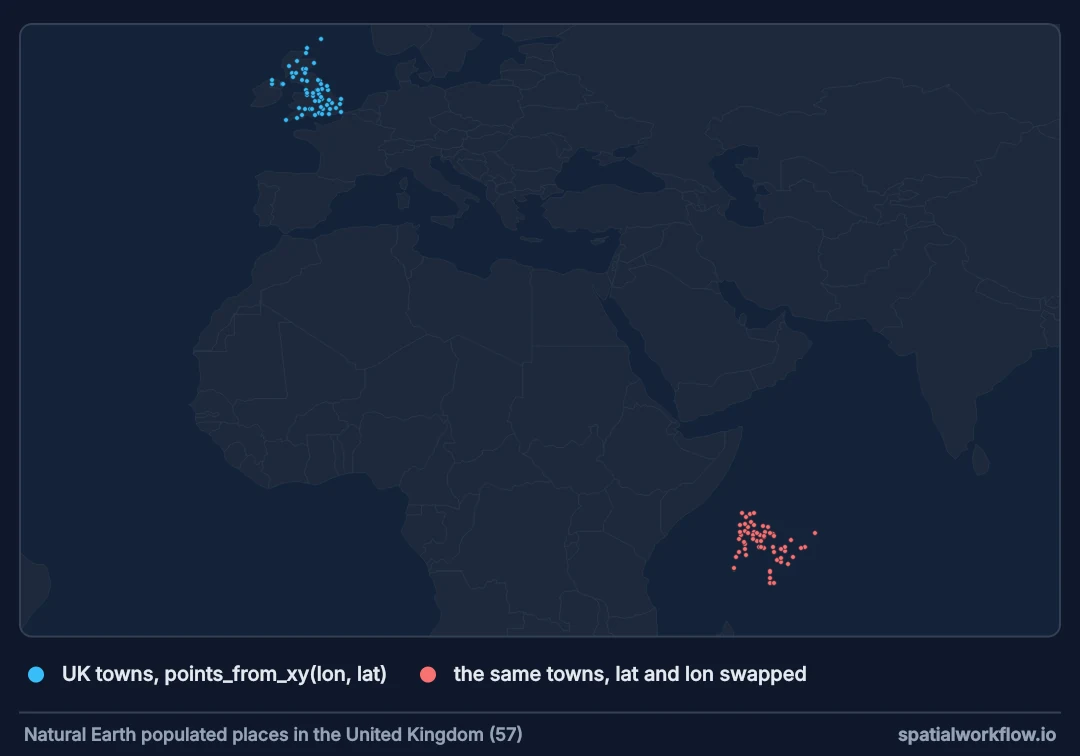
points_from_xy(lon, lat) and again with the arguments swapped. Swapped, every value is still a valid coordinate, and the points land in the western Indian Ocean between longitude 50.1 and 60.2 and latitude −7.3 and 1.3. Only one of the 57 lands on land, on an island.A swap test that needs no reference box: check whether swapping improves containment in the data's own country polygon.
import geopandas as gpd

world = gpd.read_file("data/ref/countries.gpkg")
target = world[world["ISO_A3"] == "GBR"].geometry.union_all()

as_is    = gpd.points_from_xy(df["lon"], df["lat"])
swapped  = gpd.points_from_xy(df["lat"], df["lon"])

hits_as_is   = gpd.GeoSeries(as_is,   crs=4326).within(target).sum()
hits_swapped = gpd.GeoSeries(swapped, crs=4326).within(target).sum()
print(f"as-is: {hits_as_is}, swapped: {hits_swapped}")
as-is: 8403, swapped: 60
Per row, the same comparison finds the swapped ones: a row that lands in Great Britain only when swapped was swapped.
Deal with Null Island
Coordinates of exactly (0, 0) are almost always missing values that were filled with zero somewhere upstream. The point is real — it is in the Gulf of Guinea — so nothing errors.
df = raw.copy()
null_island = (df["lon"] == 0) & (df["lat"] == 0)
print(f"{null_island.sum()} rows at (0, 0) — dropping")
df = df.loc[~null_island].copy()

# also catch the near-zero variants from truncated values
suspicious = (df["lon"].abs() < 0.0001) & (df["lat"].abs() < 0.0001)
25 rows at (0, 0) — dropping
Drop them, or keep them flagged in a separate column — but never let them into a map, where they pull the extent across the entire Atlantic and make every other point invisible.
Fix decimal separators and DMS strings
A European CSV with 52,3702 in a lat column parses as a string, or as 523702 if the thousands separator was assumed.
text = pd.read_csv("data/raw/stations.csv", dtype=str)
commas = text["lat"].str.contains(",", na=False)
print(f"{commas.sum()} rows written with decimal commas, e.g. {text.loc[commas, 'lat'].iloc[0]!r}")
print("to_numeric as-is:", pd.to_numeric(text.loc[commas, "lat"], errors="coerce").notna().sum(), "parsed")
fixed = pd.to_numeric(text["lat"].str.replace(",", ".", regex=False), errors="coerce")
print("after replacing the comma:", fixed[commas].notna().sum(), "parsed")
40 rows written with decimal commas, e.g. '53,728318'
to_numeric as-is: 0 parsed
after replacing the comma: 40 parsed
Degrees-minutes-seconds text needs converting, not coercing:
import re

DMS = re.compile(r"""(?P<deg>\d+)[°\s]+(?P<min>\d+)['\s]+(?P<sec>[\d.]+)["\s]*(?P<hemi>[NSEW])""",
                 re.VERBOSE)

def dms_to_decimal(value):
    m = DMS.match(str(value).strip())
    if not m:
        return None
    dec = int(m["deg"]) + int(m["min"]) / 60 + float(m["sec"]) / 3600
    return -dec if m["hemi"] in ("S", "W") else dec

print(dms_to_decimal("51° 30' 26.0\" N"))     # 51.507222…
print(dms_to_decimal("2° 42' 0\" W"))
51.507222222222225
-2.7
Distinguish a swap from a wrong CRS
If the points are only slightly displaced — tens or hundreds of metres — nothing was swapped and the CRS is wrong.
grid = pd.read_csv("data/raw/stops_clean.csv")
gdf = gpd.GeoDataFrame(grid, geometry=gpd.points_from_xy(grid["easting"], grid["northing"]), crs="EPSG:4326")
print("declared CRS:", gdf.crs)
print("bounds      :", gdf.total_bounds.round(0))
declared CRS: EPSG:4326
bounds : [330656. 401123. 394592. 478511.]
Bounds in the hundreds of thousands with a declared CRS of EPSG:4326 mean the numbers are projected coordinates that were labelled as degrees. Fix by setting the true CRS, then reprojecting:
# the numbers are British National Grid eastings/northings
gdf = gdf.set_crs("EPSG:27700", allow_override=True)   # declare the truth
gdf = gdf.to_crs("EPSG:4326")                           # then convert
print("after set_crs + to_crs:", gdf.total_bounds.round(3))
after set_crs + to_crs: [-3.054 53.504 -2.084 54.201]
set_crs relabels without moving anything; to_crs moves the coordinates. Using the first where you needed the second is the other half of this family of bugs.
Make the checks part of the loader
import geopandas as gpd
import pandas as pd

def load_points(csv_path, lon="lon", lat="lat", crs="EPSG:4326", expected_bounds=None):
    df = pd.read_csv(csv_path)
    for col in (lon, lat):
        df[col] = pd.to_numeric(df[col].astype(str).str.replace(",", ".", regex=False),
                                errors="coerce")

    n0 = len(df)
    df = df.dropna(subset=[lon, lat])
    df = df[~((df[lon] == 0) & (df[lat] == 0))]

    if df[lat].abs().gt(90).any():
        n_bad = int(df[lat].abs().gt(90).sum())
        raise ValueError(f"{n_bad} rows have |lat| > 90 — columns look swapped")

    gdf = gpd.GeoDataFrame(df, geometry=gpd.points_from_xy(df[lon], df[lat]), crs=crs)

    if expected_bounds:
        minx, miny, maxx, maxy = gdf.total_bounds
        exp = expected_bounds
        if not (exp[0] <= minx and maxx <= exp[2] and exp[1] <= miny and maxy <= exp[3]):
            raise ValueError(f"points outside expected area: {gdf.total_bounds} vs {exp}")

    print(f"loaded {len(gdf)} of {n0} rows")
    return gdf

try:
    load_points("data/raw/stations.csv", expected_bounds=EXPECTED["uk"])
except ValueError as exc:
    print("ValueError:", exc)
messy = load_points("data/raw/stations.csv")          # without the extent check, to repair below
ValueError: points outside expected area: [-3.05371431 -3.03906092 54.17155717 54.20086452] vs (-8.7, 49.8, 1.8, 60.9)
loaded 8615 of 8640 rows
The loader repairs the decimal commas and drops the zeros, and the swapped rows get past the range test — but not the extent check: sixty stops with a "longitude" of 54 stretch the bounds far outside the UK's box, and the load stops. Which rows, the extent cannot say; the reference test in Example 1 can.
Checking Lancashire's bus stops
The data used on this page
Lancashire's 8,640 bus stops from the Department for Transport's NaPTAN register, which carries each stop's longitude and latitude and its British National Grid easting and northing — the two pairs of columns this page is about. stops_clean.csv keeps them as published. stations.csv is the same stops written the way a messy export arrives, with the damage stated rather than hidden: 60 rows with latitude and longitude swapped, 25 rows whose blank coordinates were filled with zeros, and 40 rows written with decimal commas. stations_latlon.geojson is 200 stops written latitude-first, against the GeoJSON specification. Natural Earth's 1:10m countries and land are the references.
import io
import json
import zipfile
from pathlib import Path

import geopandas as gpd
import matplotlib
import pandas as pd
import requests

matplotlib.use("Agg")
import matplotlib.pyplot as plt

Path("data/raw").mkdir(parents=True, exist_ok=True)
Path("data/ref").mkdir(parents=True, exist_ok=True)
if not Path("data/raw/stops_clean.csv").exists():
    # NaPTAN area 250 as saved on 9 October 2026 (the register changes weekly); live:
    # naptan.api.dft.gov.uk/v1/access-nodes?dataFormat=csv&atcoAreaCodes=250
    reply = requests.get("https://data.spatialworkflow.io/naptan-area-250-2026-10-09.csv", timeout=300)
    reply.raise_for_status()
    stops = pd.read_csv(io.StringIO(reply.text), low_memory=False)
    (stops.rename(columns={"ATCOCode": "atco", "CommonName": "name", "Longitude": "lon", "Latitude": "lat",
                           "Easting": "easting", "Northing": "northing"})
        [["atco", "name", "lon", "lat", "easting", "northing"]].to_csv("data/raw/stops_clean.csv", index=False))
clean = pd.read_csv("data/raw/stops_clean.csv")

messy = clean.drop(columns=["easting", "northing"]).astype({"lon": object, "lat": object})
rows = clean.sample(125, random_state=7).index
swapped, zeroed, commas = rows[:60], rows[60:85], rows[85:]
messy.loc[swapped, ["lon", "lat"]] = clean.loc[swapped, ["lat", "lon"]].to_numpy()
messy.loc[zeroed, ["lon", "lat"]] = 0
messy.loc[commas, "lon"] = clean.loc[commas, "lon"].map(lambda v: f"{v:.6f}".replace(".", ","))
messy.loc[commas, "lat"] = clean.loc[commas, "lat"].map(lambda v: f"{v:.6f}".replace(".", ","))
messy.to_csv("data/raw/stations.csv", index=False)

sample = clean.head(200)
features = [{"type": "Feature", "properties": {"atco": a},
             "geometry": {"type": "Point", "coordinates": [lat, lon]}}              # lat first: wrong
            for a, lon, lat in zip(sample["atco"], sample["lon"], sample["lat"])]
Path("data/raw/stations_latlon.geojson").write_text(json.dumps({"type": "FeatureCollection", "features": features}))

for layer in ["admin_0_countries", "land"]:
    if not Path(f"data/ref/{layer}.gpkg").exists():
        reply = requests.get(f"https://naciscdn.org/naturalearth/10m/{'cultural' if 'countries' in layer else 'physical'}/"
                             f"ne_10m_{layer}.zip", timeout=300)
        reply.raise_for_status()
        zipfile.ZipFile(io.BytesIO(reply.content)).extractall(f"ne_{layer}")
        gpd.read_file(f"ne_{layer}/ne_10m_{layer}.shp").to_file(f"data/ref/{layer}.gpkg")
Path("data/ref/countries.gpkg").write_bytes(Path("data/ref/admin_0_countries.gpkg").read_bytes())
print(f"{len(clean):,} stops; stations.csv damage: {len(swapped)} swapped, {len(zeroed)} zeroed, {len(commas)} comma rows")
8,640 stops; stations.csv damage: 60 swapped, 25 zeroed, 40 comma rows
Example 1: automatic swap detection and repair
import geopandas as gpd
import pandas as pd

def fix_swapped(df, lon="lon", lat="lat", reference=None):
    """Swap per-row where impossible, and globally where a reference says so."""
    df = df.copy()
    impossible = df[lat].abs().gt(90) & df[lon].abs().le(90)
    if impossible.any():
        df.loc[impossible, [lon, lat]] = df.loc[impossible, [lat, lon]].to_numpy()
        print(f"row-level swap applied to {impossible.sum()} rows")

    if reference is not None:
        as_is = gpd.GeoSeries(gpd.points_from_xy(df[lon], df[lat]), crs=4326)
        swapped = gpd.GeoSeries(gpd.points_from_xy(df[lat], df[lon]), crs=4326)
        if swapped.within(reference).sum() > as_is.within(reference).sum():
            df[[lon, lat]] = df[[lat, lon]].to_numpy()
            print("global swap applied — swapped coordinates fit the reference better")
    return df

def fix_swapped_rows(df, reference, lon="lon", lat="lat"):
    """Swap each row that lands in the reference only when swapped."""
    df = df.copy()
    as_is = gpd.GeoSeries(gpd.points_from_xy(df[lon], df[lat]), crs=4326).within(reference).to_numpy()
    swapped = gpd.GeoSeries(gpd.points_from_xy(df[lat], df[lon]), crs=4326).within(reference).to_numpy()
    rows = swapped & ~as_is
    df.loc[rows, [lon, lat]] = df.loc[rows, [lat, lon]].to_numpy()
    print(f"row-level reference swap applied to {rows.sum()} rows")
    return df

cleaned = fix_swapped(messy.drop(columns="geometry"), reference=target)
cleaned = fix_swapped_rows(cleaned, target)
row-level reference swap applied to 60 rows
The global check keeps the orientation that most rows agree on, which is right here — and leaves the minority of swapped rows in the sea. A row-level test against the same reference finds them.
Example 2: a quick visual check that always works
import matplotlib.pyplot as plt
import geopandas as gpd

world = gpd.read_file("data/ref/countries.gpkg")
gdf = gpd.GeoDataFrame(cleaned, geometry=gpd.points_from_xy(cleaned["lon"], cleaned["lat"]), crs=4326)
Path("data/out").mkdir(parents=True, exist_ok=True)

fig, ax = plt.subplots(figsize=(9, 5))
world.boundary.plot(ax=ax, linewidth=0.4, color="#94a3b8")
gdf.plot(ax=ax, markersize=6, color="#0ea5e9")
ax.set_title(f"{len(gdf)} points — bounds {[round(float(v), 2) for v in gdf.total_bounds]}")
fig.savefig("data/out/qa_points.png", dpi=120, bbox_inches="tight")
plt.close(fig)
print(ax.get_title())
8615 points — bounds [-3.05, 53.5, -2.08, 54.2]
Rendering the points over a world outline takes seconds and catches every one of the four patterns at a glance. Save it as a build artefact so an unattended run leaves visual evidence.
Example 3: count points that fall on land
import geopandas as gpd

land = gpd.read_file("data/ref/land.gpkg").to_crs(4326).union_all()
for label, frame in [("cleaned", gdf), ("built lat-first", gpd.GeoDataFrame(
        cleaned, geometry=gpd.points_from_xy(cleaned["lat"], cleaned["lon"]), crs=4326))]:
    on_land = frame.within(land)
    print(f"{label:16} {on_land.sum():>5} of {len(frame)} points on land ({on_land.mean():.1%})")
    if on_land.mean() < 0.9:
        frame.loc[~on_land].to_file("data/out/points_in_water.gpkg", driver="GPKG")
        print("                 more than 10% of points in water — check coordinate order")
cleaned 8502 of 8615 points on land (98.7%)
built lat-first 0 of 8615 points on land (0.0%)
more than 10% of points in water — check coordinate order
For terrestrial datasets this is a strong, cheap automated test — and it catches subtler damage than a range check can.
Example 4: reading GeoJSON that has the order backwards
import json
from shapely.geometry import shape, mapping
import geopandas as gpd

raw = json.loads(open("data/raw/stations_latlon.geojson", encoding="utf-8").read())
print("as delivered:", gpd.GeoDataFrame.from_features(raw["features"], crs="EPSG:4326").total_bounds.round(2))

def swap_coords(obj):
    if isinstance(obj, list):
        if len(obj) == 2 and all(isinstance(v, (int, float)) for v in obj):
            return [obj[1], obj[0]]
        return [swap_coords(v) for v in obj]
    return obj

for feature in raw["features"]:
    feature["geometry"]["coordinates"] = swap_coords(feature["geometry"]["coordinates"])

gdf = gpd.GeoDataFrame.from_features(raw["features"], crs="EPSG:4326")
print("repaired:    ", gdf.total_bounds.round(2))
as delivered: [53.52 -3.02 54.18 -2.12]
repaired: [-3.02 53.52 -2.12 54.18]
The GeoJSON specification requires [longitude, latitude], but exports that violate it are common enough to be worth a one-off repair function.
Why libraries put longitude first
Latitude and longitude are the two halves of a geographic coordinate, and everything about how people talk about them puts latitude first. Every computational geometry library puts it second, because the pair is really a point in a plane: x eastwards, y northwards. points_from_xy, Shapely's Point(x, y), WKT's POINT (lon lat) and the GeoJSON specification are all consistent on this. The mismatch between spoken convention and machine convention is the entire cause of the swap.
The reason it is so often invisible is that a swap produces perfectly plausible numbers. Latitude 51.5 and longitude -0.13 becomes latitude -0.13 and longitude 51.5: still a valid coordinate, still on Earth, just in the Indian Ocean off Somalia rather than in London. Only when a latitude exceeds 90 does arithmetic alone reveal the problem, and that happens only for data outside the ±90 longitude band. Everything in Europe, Africa and the Americas' eastern edge can swap silently.
Standards that really are latitude-first
- Some standards really are lat-first: EPSG:4326's authority definition and WMS 1.3.0 use latitude first. GeoPandas, Shapely and GeoJSON do not — know which side of the boundary you are on.
- Zero is a valid coordinate: Greenwich is longitude 0 and the equator is latitude 0. Only the pair being exactly zero is suspicious.
total_boundsorder is[minx, miny, maxx, maxy]: Longitude first, matching the x/y convention rather than the spoken one.
Internal links
- How to Read a CSV with Coordinates as a GeoDataFrame
- How to Clean Messy CSV Coordinates into a Reliable GeoDataFrame
- Why Does My GeoPandas Map Look Upside Down?
- Coordinate Reference Systems (CRS) Explained for Python GIS
- How to Fix CRS Mismatch in GeoPandas
- How to Handle Missing and Null Values in Spatial Datasets in Python
FAQ
Which order does points_from_xy expect?
Longitude first, latitude second — x then y. The same applies to Point(x, y), WKT, and GeoJSON coordinates. Naming your variables lon and lat makes a wrong call read wrongly.
How do I detect a swap when both values are under 90?
Range checks cannot help, so compare the extent against where the data should be, or count how many points fall inside the expected country polygon as-is versus swapped. Whichever wins is the correct order.
What is Null Island and why do my points end up there?
It is the point at latitude 0, longitude 0 in the Gulf of Guinea. Points land there when missing coordinates were filled with zero. Drop rows where both values are exactly zero.
Why are my points close to the right place but offset?
That is a CRS problem, not a swap. The numbers belong to a different reference system than the one declared. Set the true CRS with set_crs(..., allow_override=True), then transform with to_crs().
My CSV has commas as decimal separators — what happens?
The column parses as text, or as a much larger integer if the comma was read as a thousands separator. Replace , with . before pd.to_numeric, and check the resulting ranges.
Does EPSG:4326 not officially use latitude first?
Yes — the EPSG authority defines the axis order as latitude, longitude, and services like WMS 1.3.0 honour that. The Python geospatial stack and GeoJSON use longitude first, which is the convention that matters in this code.
What is a good automated check for a scheduled job?
Assert that latitudes are within ±90 and longitudes within ±180, that no rows sit at exactly (0, 0), and that the extent lies inside an expected bounding box. Saving a small PNG of the points over a country outline gives you visual evidence too.