
Fixing Distances to Faults That Come Out in Degrees or Too Long
On this page
Problem statement
"How far is this site from the nearest active fault?" is one of the first questions in any seismic assessment, and in GeoPandas it is one line: faults.distance(site).min(). With fault data in longitude and latitude, as the USGS Quaternary fault database is, that line returns degrees, a unit in which a step east is shorter than a step north everywhere except the equator. Multiplying by 111 km does not fix it, and reprojecting to Web Mercator, the projection of every web map, gives metres that are too long by a factor that reaches two in Alaska. Worse, the nearest fault itself can change, because in degrees a fault to the east looks closer than it is.
This page measures the distance from ten western US cities to their nearest fault in the database's fastest slip-rate class, more than 5 mm a year, four ways: in degrees times 111.32, in Web Mercator, in each city's UTM zone, and as a geodesic on the ellipsoid, and shows how large the errors are and where the nearest fault changes.
Quick answer
Project to a CRS whose units are metres and that preserves distance locally, such as the UTM zone of the site, and measure there:
for name, pt in cities.items():
    utm = gpd.GeoSeries([pt], crs=4326).estimate_utm_crs()
    f = faults.cx[pt.x - 6:pt.x + 6, pt.y - 6:pt.y + 6].to_crs(utm)
    s = gpd.GeoSeries([pt], crs=4326).to_crs(utm).iloc[0]
    print(f"{name:>14}: {f.distance(s).min() / 1000:6.1f} km to {faults.at[f.distance(s).idxmin(), 'fault_name']} ({utm.name.split('/')[-1].strip()})")
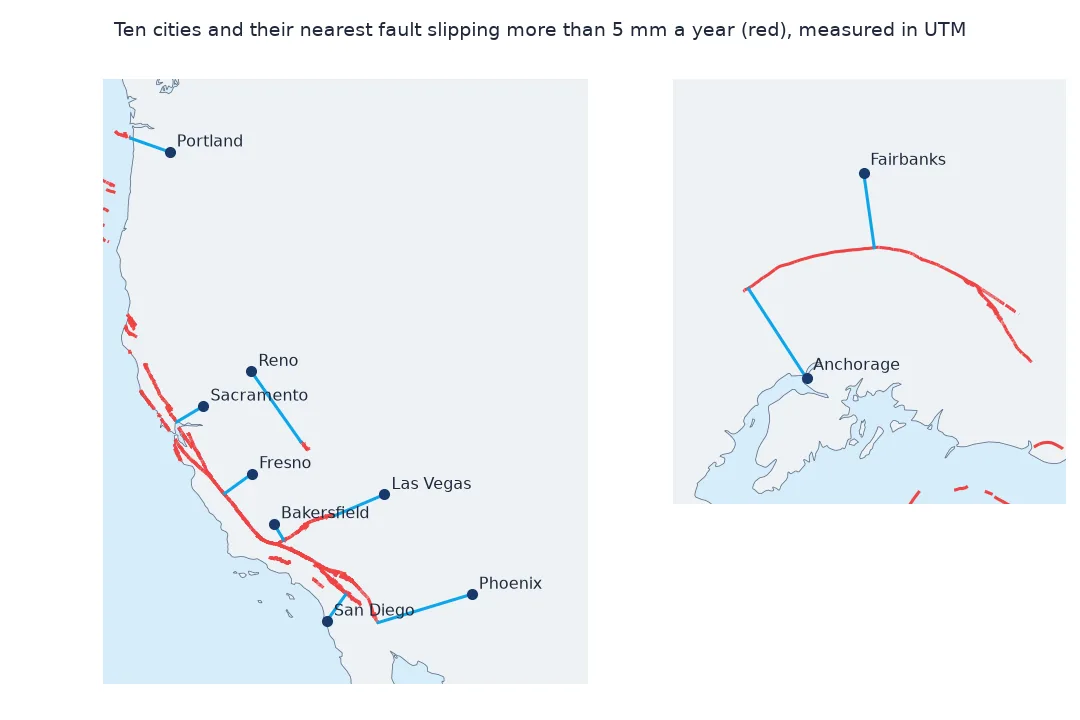
Portland: 113.2 km to Fault H (UTM zone 10N)
Reno: 261.0 km to Fish Lake Valley fault zone (UTM zone 11N)
Sacramento: 94.0 km to Rodgers Creek fault (UTM zone 10N)
Fresno: 105.4 km to San Andreas fault zone (UTM zone 11N)
Bakersfield: 57.7 km to Garlock fault zone (UTM zone 11N)
Las Vegas: 168.9 km to Garlock fault zone (UTM zone 11N)
San Diego: 101.3 km to San Jacinto fault (UTM zone 11N)
Phoenix: 318.6 km to Imperial fault (UTM zone 12N)
Anchorage: 211.4 km to Denali fault (UTM zone 6N)
Fairbanks: 147.5 km to Denali fault (UTM zone 6N)
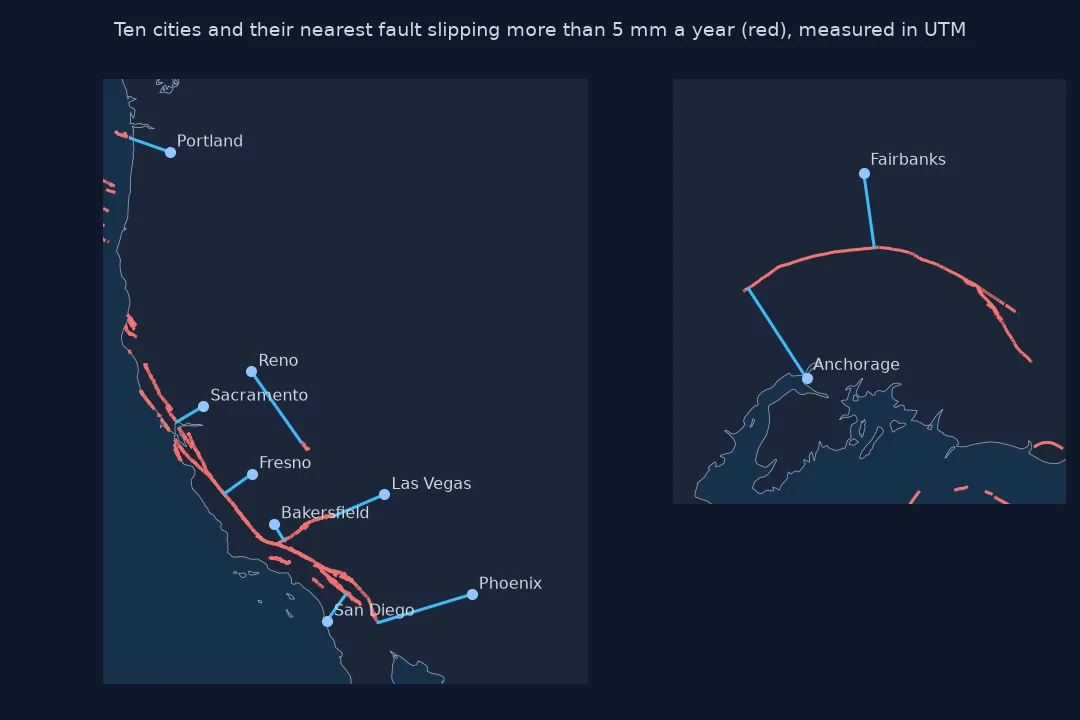
Measured in each city's UTM zone, the nearest fast-slipping fault is 57.7 km from Bakersfield (the Garlock fault zone) and 318.6 km from Phoenix (the Imperial fault). Portland's is Fault H, 113.2 km away, a normal fault on the coast and offshore near the mouth of the Columbia River. Anchorage and Fairbanks are 211.4 and 147.5 km from the Denali fault.
See the degrees, compare four methods, watch the nearest fault change
1. See the degrees
On a GeoDataFrame in EPSG:4326, .distance treats longitude and latitude as planar coordinates. GeoPandas warns, but the number comes back:
pt = cities["Anchorage"]
near = faults.cx[pt.x - 6:pt.x + 6, pt.y - 6:pt.y + 6]
d = near.distance(pt).min()
print(f"Anchorage, EPSG:4326 distance: {d:.4f} (degrees); times 111.32: {d * 111.32:.1f} km")
print(f"one degree east at Anchorage: {111.32 * np.cos(np.radians(pt.y)):.1f} km; one degree north: 111.6 km")
Anchorage, EPSG:4326 distance: 2.1022 (degrees); times 111.32: 234.0 km
one degree east at Anchorage: 53.6 km; one degree north: 111.6 km
In degrees, Anchorage is 2.1022 from the Denali fault, which times 111.32 is 234.0 km, against 211.4 km in UTM. The conversion assumes every degree is 111.32 km, but at Anchorage a degree of longitude is 53.6 km.
2. Compare the four methods
For every city compute the nearest fault in each method, then check the UTM result with an exact geodesic between the two nearest points:
print(R[["deg_km", "merc_km", "utm_km", "geod_km"]].round(1).to_string())
err = R[["deg_km", "merc_km", "utm_km"]].div(R.geod_km, axis=0) - 1
print("\nerror against the geodesic:")
print((err * 100).round(1).astype(str).add("%").to_string())
deg_km merc_km utm_km geod_km
Portland 156.3 161.9 113.2 113.2
Reno 287.8 334.3 261.0 261.0
Sacramento 101.8 119.9 94.0 94.0
Fresno 117.5 131.1 105.4 105.4
Bakersfield 58.7 70.7 57.7 57.7
Las Vegas 203.2 208.4 168.9 168.9
San Diego 102.0 121.2 101.3 101.3
Phoenix 375.6 379.7 318.6 318.4
Anchorage 234.0 449.7 211.4 211.3
Fairbanks 148.0 338.4 147.5 147.6
error against the geodesic:
deg_km merc_km utm_km
Portland 38.1% 43.0% -0.0%
Reno 10.3% 28.1% -0.0%
Sacramento 8.3% 27.5% -0.0%
Fresno 11.5% 24.4% 0.1%
Bakersfield 1.7% 22.6% -0.0%
Las Vegas 20.3% 23.4% -0.0%
San Diego 0.7% 19.6% -0.0%
Phoenix 17.9% 19.2% 0.0%
Anchorage 10.7% 112.8% 0.0%
Fairbanks 0.3% 129.3% -0.0%
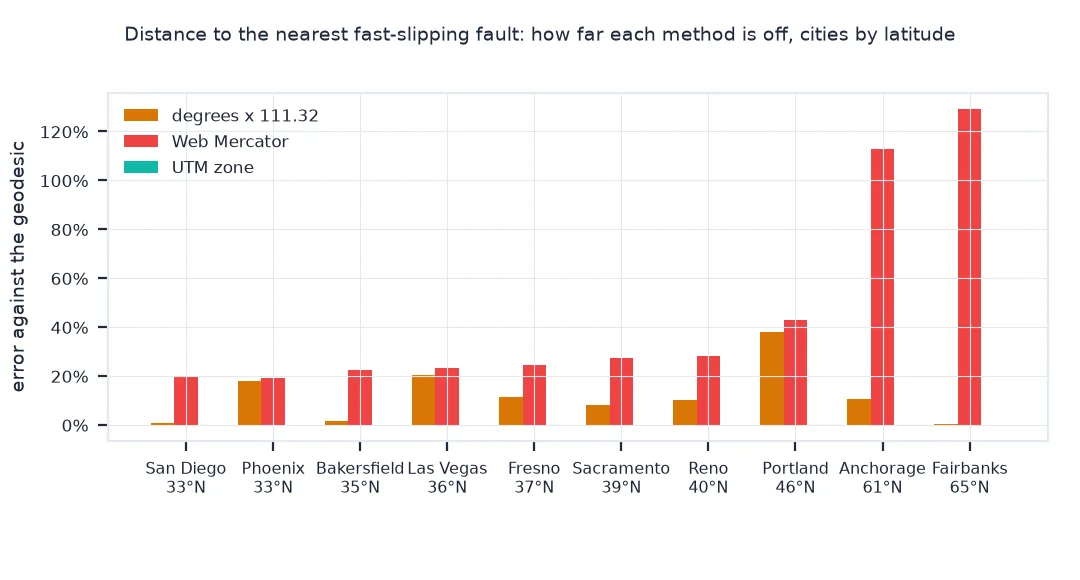
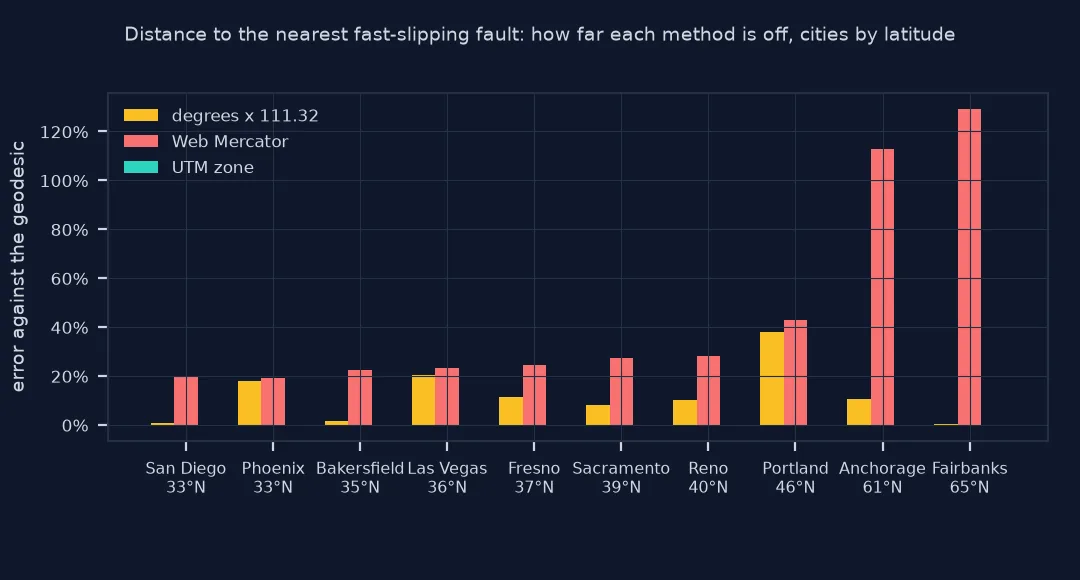
UTM agrees with the geodesic to within 0.2 km, 0.1% at most, in every city. Degrees times 111.32 are too long by 0.3% to 38%, depending on how much of the path runs east-west: 38% for Portland, whose nearest fast fault lies to the north-west, mostly west, and under 2% for Bakersfield, San Diego and Fairbanks, whose faults lie more to the north or south. Web Mercator is too long everywhere, by 19% to 23% in southern California and Arizona and by 113% and 129% in Alaska.
3. Where the nearest fault changes
In degrees, an east-west offset counts more than it should, so a fault to the north or south can be passed over for one to the east or west:
changed = R[R.deg_fault != R.utm_fault]
print(f"cities whose nearest fault differs in degrees: {len(changed)} of {len(R)}")
for name, row in changed.iterrows():
    print(f"  {name}: degrees pick {row.deg_fault} ({row.deg_true_km:.1f} km true distance), UTM picks {row.utm_fault} ({row.utm_km:.1f} km)")
cities whose nearest fault differs in degrees: 3 of 10
Sacramento: degrees pick Calaveras fault zone (94.4 km true distance), UTM picks Rodgers Creek fault (94.0 km)
Bakersfield: degrees pick San Andreas fault zone (58.3 km true distance), UTM picks Garlock fault zone (57.7 km)
San Diego: degrees pick Elsinore fault zone (101.4 km true distance), UTM picks San Jacinto fault (101.3 km)
In three cities, degrees pick a different fault from UTM: Sacramento, Bakersfield and San Diego. Here the alternatives happen to be at almost the same true distance, 0.1 to 0.6 km farther, so the distance changes little, but the fault named in a report, and the slip rate and magnitude that follow from it, would be wrong.
The Web Mercator error by latitude
The data used on this page
The USGS Quaternary Fault and Fold Database national shapefile, Qfaults_GIS.zip, keeping the traces in the fastest slip-rate class, more than 5 mm a year. City coordinates are approximate city centres.
import warnings
from pathlib import Path

import geopandas as gpd
import numpy as np
import pandas as pd
import requests
from pyproj import Geod
from shapely.geometry import Point
from shapely.ops import nearest_points

warnings.filterwarnings("ignore", message="Geometry is in a geographic CRS")
Path("data").mkdir(exist_ok=True)
z = Path("data/Qfaults_GIS.zip")
if not z.exists():
    r = requests.get("https://earthquake.usgs.gov/static/lfs/nshm/qfaults/Qfaults_GIS.zip", timeout=900)
    r.raise_for_status()
    z.write_bytes(r.content)
faults = gpd.read_file(f"zip://{z}!SHP/Qfaults_US_Database.shp")
faults = faults[faults.slip_rate == "Greater than 5.0 mm/yr"]
cities = {"Portland": Point(-122.6784, 45.5152), "Reno": Point(-119.8138, 39.5296), "Sacramento": Point(-121.4944, 38.5816),
          "Fresno": Point(-119.7871, 36.7378), "Bakersfield": Point(-119.0187, 35.3733), "Las Vegas": Point(-115.1398, 36.1699),
          "San Diego": Point(-117.1611, 32.7157), "Phoenix": Point(-112.0740, 33.4484), "Anchorage": Point(-149.9003, 61.2181),
          "Fairbanks": Point(-147.7164, 64.8378)}
geod = Geod(ellps="WGS84")
rows = {}
for name, pt in cities.items():
    near = faults.cx[pt.x - 6:pt.x + 6, pt.y - 6:pt.y + 6]
    dd = near.distance(pt)                                                     # degrees
    merc = near.to_crs(3857).distance(gpd.GeoSeries([pt], crs=4326).to_crs(3857).iloc[0])
    utm = gpd.GeoSeries([pt], crs=4326).estimate_utm_crs()
    nu = near.to_crs(utm); su = gpd.GeoSeries([pt], crs=4326).to_crs(utm).iloc[0]
    du = nu.distance(su)
    a, b = nearest_points(su, nu.loc[du.idxmin()].geometry)                   # nearest points in UTM, back to lon/lat
    ab = gpd.GeoSeries([a, b], crs=utm).to_crs(4326)
    g = geod.inv(ab.iloc[0].x, ab.iloc[0].y, ab.iloc[1].x, ab.iloc[1].y)[2] / 1000
    rows[name] = {"lat": pt.y, "deg_km": dd.min() * 111.32, "merc_km": merc.min() / 1000, "utm_km": du.min() / 1000, "geod_km": g,
                  "deg_fault": near.at[dd.idxmin(), "fault_name"], "utm_fault": near.at[du.idxmin(), "fault_name"],
                  "deg_true_km": du.loc[dd.idxmin()] / 1000}
R = pd.DataFrame(rows).T
for c in ("lat", "deg_km", "merc_km", "utm_km", "geod_km", "deg_true_km"):
    R[c] = R[c].astype(float)
print(f"{len(faults):,} traces slipping more than 5 mm a year; {len(cities)} cities, nearest faults searched within 6 degrees")
16,224 traces slipping more than 5 mm a year; 10 cities, nearest faults searched within 6 degrees
16,224 traces in the national file are in the fastest slip-rate class. For each of the ten cities, the setup measures the distance to the nearest of them in all four ways and keeps the fault each method picks.
Example 1: the Web Mercator error is a function of latitude
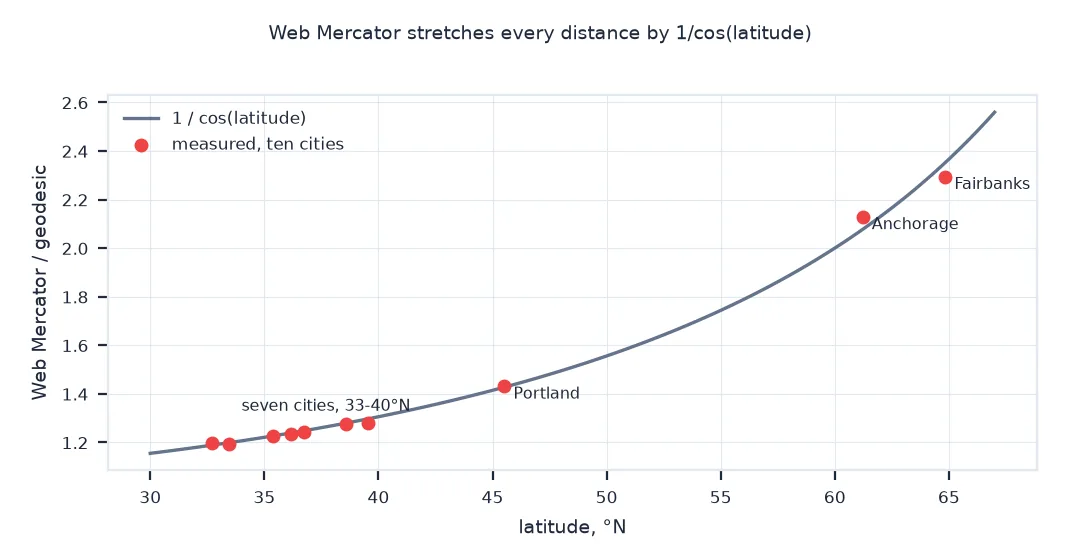
Web Mercator scales every distance by 1/cos(latitude). Compare the measured ratio with that factor:
R["merc_ratio"] = R.merc_km / R.geod_km
R["sec_lat"] = 1 / np.cos(np.radians(R.lat))
print(R[["lat", "merc_ratio", "sec_lat"]].sort_values("lat").round(3).to_string())
lat merc_ratio sec_lat
San Diego 32.716 1.196 1.189
Phoenix 33.448 1.192 1.198
Bakersfield 35.373 1.226 1.226
Las Vegas 36.170 1.234 1.239
Fresno 36.738 1.244 1.248
Sacramento 38.582 1.275 1.279
Reno 39.530 1.281 1.297
Portland 45.515 1.430 1.427
Anchorage 61.218 2.128 2.077
Fairbanks 64.838 2.293 2.352
The Web Mercator ratio follows 1/cos(latitude) closely, from 1.196 at San Diego to 2.29 at Fairbanks. The small differences arise because the line from a city to its fault spans a range of latitudes, and because in Mercator the nearest point on the fault can be a slightly different one.
A degree of longitude shrinks with latitude
A degree of latitude is about 111 km everywhere, but a degree of longitude is 111 km times the cosine of the latitude: 78 km at Portland, 54 km at Anchorage. Planar distance in degrees treats the two as equal, so it overstates any east-west component, by up to 1/cos(latitude), and understates nothing. The size of the error depends on direction, which is why it is erratic from site to site, and why it can change which fault is nearest.
Web Mercator has the opposite problem: it is conformal, so distances are correct in shape but scaled uniformly by 1/cos(latitude) in every direction. That makes its error predictable but large, 20% at Phoenix's latitude and more than 100% at Anchorage's. A UTM zone, or any conformal projection centred near the site, keeps the scale within a fraction of a percent over a few hundred kilometres. For long distances or many sites spread over a continent, compute geodesic distances on the ellipsoid, as pyproj.Geod does.
Nearest points, UTM zone edges and search windows
- Nearest point first: geodesic distance is between two points; find the nearest point on the fault in a projected CRS, then measure the geodesic between the pair.
- UTM zone edges: a site near a zone boundary is still fine, since scale error stays below about 0.1% within a few degrees of the central meridian.
- Search window:
cxlimits the search to faults within 6 degrees for speed; a site farther than that from any fault would need a wider window. - Fault traces: distance to a mapped surface trace is not distance to the rupture plane; a dipping fault can be closer at depth.
Internal links
- How to analyse the USGS Quaternary fault database in Python — the data
- How to map earthquakes against plate boundaries in Python — distances on a global scale
- How to fit ground-motion attenuation to ShakeMap stations in Python — why distance metrics matter for shaking
FAQ
Why is my GeoPandas distance in degrees?
The layer is in a geographic CRS such as EPSG:4326, so .distance returns planar distance in its units, degrees. Reproject to a projected CRS in metres first.
Can I multiply degrees by 111 km?
Only for north-south distances. East-west distances are 111 km times the cosine of the latitude per degree, so the conversion overstates them.
Is Web Mercator good enough for distances?
No: it scales distances by 1/cos(latitude), 37% too long at 43°N and twice too long at 60°N.
What is the most accurate way to measure distance to a fault?
Find the nearest point in a local projected CRS such as UTM, then compute the geodesic distance between the site and that point with pyproj.Geod.