
Fixing Cartopy Points Plotted in the Wrong Place
On this page
Problem statement
Points plotted on a Cartopy map end up as a single dot in the middle, in the ocean off Africa, or shifted hundreds of kilometres from where they belong, while the coastlines look perfect. The coastlines are right because Cartopy knows their coordinate system; the points are wrong because it was not told theirs. Every plotting call on a GeoAxes takes a transform naming the coordinates of the data, and leaving it out, or giving the wrong one, is behind nearly every misplaced point.
This page reproduces the four common versions on real data, the 2024 earthquakes around Japan from the USGS catalogue: no transform on a projected map, projected data plotted as if it were longitude and latitude, axis limits set in degrees, and GeoPandas data on Cartopy axes. It measures how far each puts the points from where they should be.
Quick answer
Longitude and latitude data takes transform=ccrs.PlateCarree(), whatever the projection of the map:
proj = ccrs.LambertConformal(central_longitude=138, central_latitude=36)
right = proj.transform_points(ccrs.PlateCarree(), J.longitude.values, J.latitude.values)[:, :2]
wrong = np.c_[J.longitude.values, J.latitude.values]                     # what the axes get without transform
print(f"{len(J)} earthquakes; with transform they span x {right[:, 0].min() / 1000:,.0f} to {right[:, 0].max() / 1000:,.0f} km")
print(f"without transform they span x {wrong[:, 0].min():.0f} to {wrong[:, 0].max():.0f} m: all within {np.hypot(*wrong.T).max():.0f} m of the map centre")
511 earthquakes; with transform they span x -1,332 to 940 km
without transform they span x 125 to 150 m: all within 157 m of the map centre
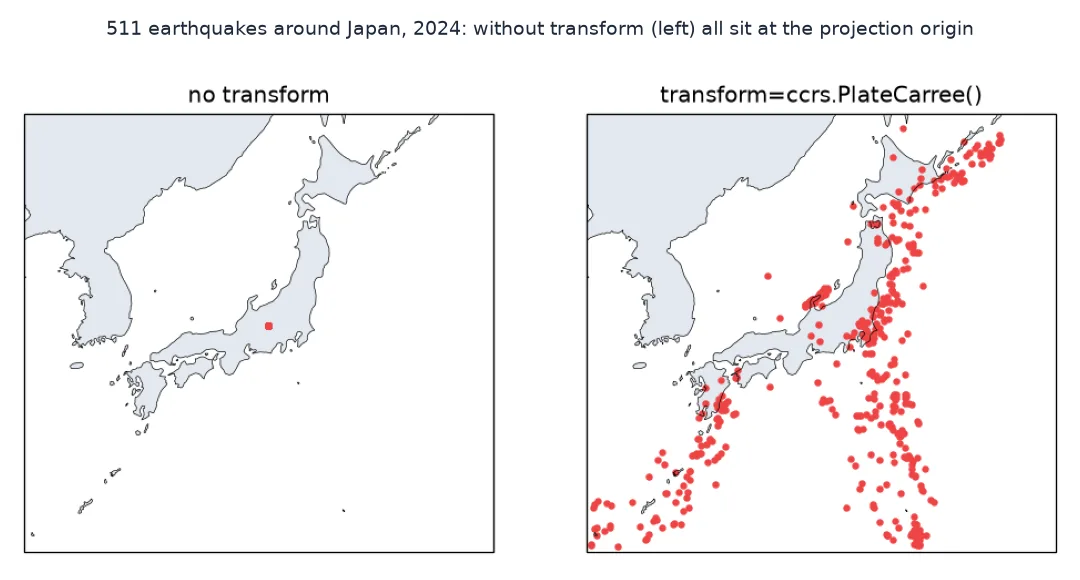
With the transform, the earthquakes spread 2,272 km from west to east across the Lambert map. Without it, their longitudes of 125 to 150 become 125 to 150 m, and all 511 sit within 157 m of the map centre: one dot.
Projected data needs its CRS, degree limits, GeoPandas axes
1. Projected data needs its own CRS
Data already in a projected CRS, such as UTM eastings and northings, needs that CRS as the transform. Convert the earthquakes to UTM zone 54N and compare the right and wrong transforms:
from pyproj import Transformer
e, n = Transformer.from_crs(4326, 32654, always_xy=True).transform(J.longitude.values, J.latitude.values)
utm = ccrs.UTM(54)
ok = proj.transform_points(utm, e, n)[:, :2]
print(f"transform=ccrs.UTM(54): largest offset from the true position {np.hypot(*(ok - right).T).max():.3f} m")
bad = proj.transform_points(ccrs.PlateCarree(), e, n)[:, :2]
print(f"transform=ccrs.PlateCarree() on eastings: finite positions {np.isfinite(bad).all(axis=1).sum()} of {len(J)}")
print(f"first easting, northing: ({e[0]:,.0f}, {n[0]:,.0f}), read as degrees far outside ±180, ±90")
transform=ccrs.UTM(54): largest offset from the true position 0.000 m
transform=ccrs.PlateCarree() on eastings: finite positions 0 of 511
first easting, northing: (1,156,083, 4,953,212), read as degrees far outside ±180, ±90
With transform=ccrs.UTM(54), the UTM points land exactly where the longitude and latitude versions do. With PlateCarree, eastings of over a million read as degrees, and none of the 511 points gets a finite position on the map: they vanish without an error.
2. Limits in degrees
ax.set_extent takes longitude and latitude (and says so explicitly with crs=ccrs.PlateCarree()), but ax.set_xlim and ax.set_ylim work in the projection's own units. Degrees passed to them make a box a few metres wide:
fig = plt.figure(); ax = plt.axes(projection=proj)
ax.set_xlim(125, 150); ax.set_ylim(24, 46)
w = ax.get_xlim()[1] - ax.get_xlim()[0]
ax.set_extent([125, 150, 24, 46], crs=ccrs.PlateCarree())
w2 = ax.get_xlim()[1] - ax.get_xlim()[0]
plt.close(fig)
print(f"set_xlim(125, 150): {w:,.0f} m wide; set_extent with crs=PlateCarree(): {w2 / 1000:,.0f} km wide")
set_xlim(125, 150): 25 m wide; set_extent with crs=PlateCarree(): 2,606 km wide
set_xlim(125, 150) makes a map 25 m wide, while set_extent with degrees gives the intended 2,606 km.
3. GeoPandas on Cartopy axes
GeoDataFrame.plot(ax=ax) draws raw coordinates too. Either pass transform= or reproject the GeoDataFrame to the axes' CRS first:
g = gpd.GeoDataFrame(J, geometry=gpd.points_from_xy(J.longitude, J.latitude), crs=4326)
g_proj = g.to_crs(proj.proj4_init)
print(f"to_crs(proj.proj4_init): largest offset from Cartopy's own transform {np.hypot(g_proj.geometry.x - right[:, 0], g_proj.geometry.y - right[:, 1]).max():.3f} m")
to_crs(proj.proj4_init): largest offset from Cartopy's own transform 0.000 m
Reprojecting the GeoDataFrame to the axes' CRS puts every point exactly where Cartopy's own transform does.
Right and wrong maps side by side
The data used on this page
The earthquakes of magnitude 4.5 or more in 2024 between 125° and 150° E and 24° and 46° N, around Japan, from the USGS FDSN event service.
from pathlib import Path

import cartopy.crs as ccrs
import cartopy.feature as cfeature
import geopandas as gpd
import matplotlib
matplotlib.use("Agg")
import matplotlib.pyplot as plt
import numpy as np
import pandas as pd
import requests

Path("data").mkdir(exist_ok=True)
p = Path("data/quakes_m45_2024.csv")
if not p.exists():
    r = requests.get("https://earthquake.usgs.gov/fdsnws/event/1/query", timeout=600,
                     params=dict(format="csv", starttime="2024-01-01", endtime="2025-01-01", minmagnitude=4.5, orderby="time-asc"))
    r.raise_for_status()
    p.write_bytes(r.content)
Q = pd.read_csv(p)
J = Q[(Q["type"] == "earthquake") & Q.longitude.between(125, 150) & Q.latitude.between(24, 46)].reset_index(drop=True)
print(f"{len(J)} earthquakes around Japan in 2024")
511 earthquakes around Japan in 2024
511 earthquakes of magnitude 4.5 or more fell in the box around Japan in 2024.
Example 1: the right and wrong maps side by side
Draw the same points with and without transform and save both:
fig, axes = plt.subplots(1, 2, figsize=(10, 5), subplot_kw={"projection": proj})
for ax, kw, title in ((axes[0], {}, "no transform"), (axes[1], {"transform": ccrs.PlateCarree()}, "transform=ccrs.PlateCarree()")):
    ax.set_extent([125, 150, 24, 46], crs=ccrs.PlateCarree())
    ax.add_feature(cfeature.LAND.with_scale("50m"), facecolor="#e2e8f0"); ax.coastlines("50m", linewidth=0.4)
    ax.scatter(J.longitude, J.latitude, s=8, color="#ef4444", **kw)
    ax.set_title(title)
fig.savefig("data/transform_compare.png", dpi=120, bbox_inches="tight"); plt.close(fig)
centre = proj.transform_point(0, 0, proj)
lon0, lat0 = ccrs.PlateCarree().transform_point(*centre, proj)
print(f"without transform the points sit at the projection origin, {lon0:.1f}°E, {lat0:.1f}°N")
without transform the points sit at the projection origin, 138.0°E, 36.0°N
Without a transform, the points sit at the projection's origin, 138.0° E, 36.0° N, the centre of the Lambert projection in central Honshu: on this map they look like a single earthquake inland.
Axes projection against data transform
Cartopy keeps two coordinate systems apart. The axes have a projection, set once, which fixes how the map is drawn and what units its x and y have: metres for almost every projection. Each artist, whether points, lines, polygons or images, has a transform naming the coordinate system of its own data. Cartopy reprojects from the second to the first. When the transform is missing, matplotlib's default applies, and the data is assumed to be in the axes' units already, so longitudes and latitudes of a few hundred become metres from the projection's origin, which on most maps is its centre. On a PlateCarree map the two happen to coincide, which is why code that worked on a simple map breaks as soon as the projection changes.
The same logic covers every variant. Projected data needs its projected CRS as the transform, limits in degrees go through set_extent rather than set_xlim, and GeoPandas, which knows nothing about Cartopy axes, needs either a transform or a GeoDataFrame reprojected to the axes' CRS. When points are in the wrong place, the first question is always: what coordinates is this data in, and did the plotting call say so?
Lines, rasters and 0-360 longitudes
- Lines:
transform=ccrs.Geodetic()draws great circles between points,PlateCarree()straight lines in longitude and latitude. - Images and rasters:
imshowneeds bothtransform=andextent=in that transform's coordinates. - Longitudes from 0 to 360:
PlateCarreeaccepts them; no conversion is needed. - Text and annotations:
ax.text(lon, lat, "label", transform=ccrs.PlateCarree())too.
Internal links
- How to make a map with Cartopy in Python — the full guide
- How to Convert Latitude and Longitude to UTM in Python
- Latitude and longitude explained — what the numbers mean
FAQ
Why are my points in the wrong place on a Cartopy map?
The plotting call has no transform, or the wrong one. Longitude and latitude data needs transform=ccrs.PlateCarree().
Why are all my Cartopy points in one spot in the middle?
Without transform, longitude and latitude are read as metres in the map projection, so every point lands within a few hundred metres of the centre.
What transform do I use for UTM data in Cartopy?
ccrs.UTM(zone), with southern_hemisphere=True for the southern zones.
How do I plot a GeoDataFrame on a Cartopy map?
Pass transform=ccrs.PlateCarree() for EPSG:4326 data, or reproject with gdf.to_crs(ax.projection.proj4_init).