
EIA-923 Monthly Values Are Dots: Reading Missing Months Correctly
On this page
Problem statement
Read EIA-923's generation file with pandas and the monthly columns come in as object, not numbers; sum raises TypeError, and pd.to_numeric on the wrong column quietly turns things into NaN. The cause is a single character: EIA writes "." in a cell when there is no value for that month. In the 2025 final file that is 4,991 cells across 784 rows. Replacing them with 0 makes the arithmetic run and the answers wrong. This page shows where the dots are, what they stand for, and the conversion that keeps their meaning.
Quick answer
Replace "." with NaN before converting — g[months].replace(".", np.nan).astype(float) — and let sums skip the NaNs. Do not use fillna(0): a dot means no value, not zero generation.
g = read_923()
months = [c for c in g.columns if c.startswith("Netgen ")]
print("column types:", g[months].dtypes.value_counts().to_dict())
try:
    g[months].sum(axis=1)
    print("row sums: ran")
except TypeError as e:
    print("row sums:", type(e).__name__)
dots = (g[months] == ".").sum()
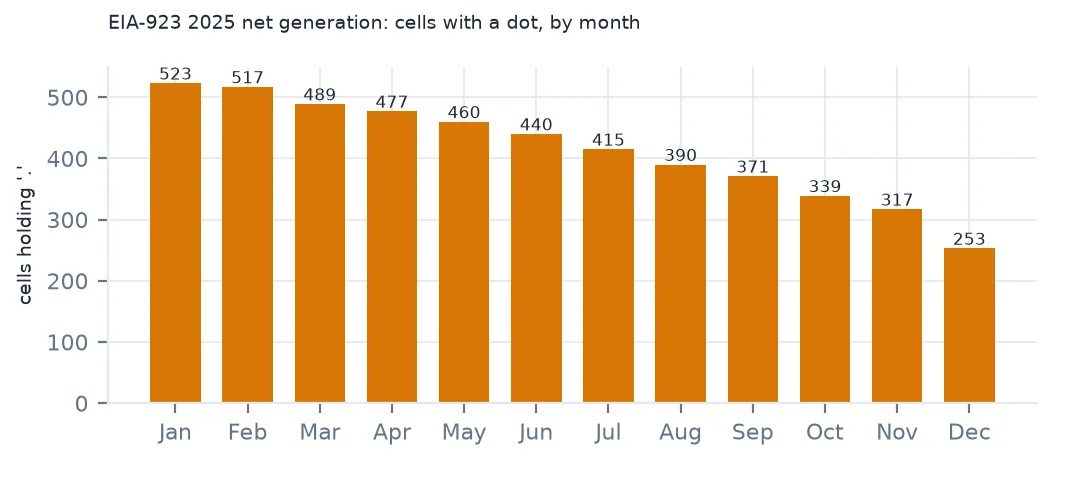
print("cells holding '.':", dots.sum(), "| by month:", dots.rename(lambda c: c.split()[1][:3]).to_dict())
column types: {dtype('O'): 12}
row sums: TypeError
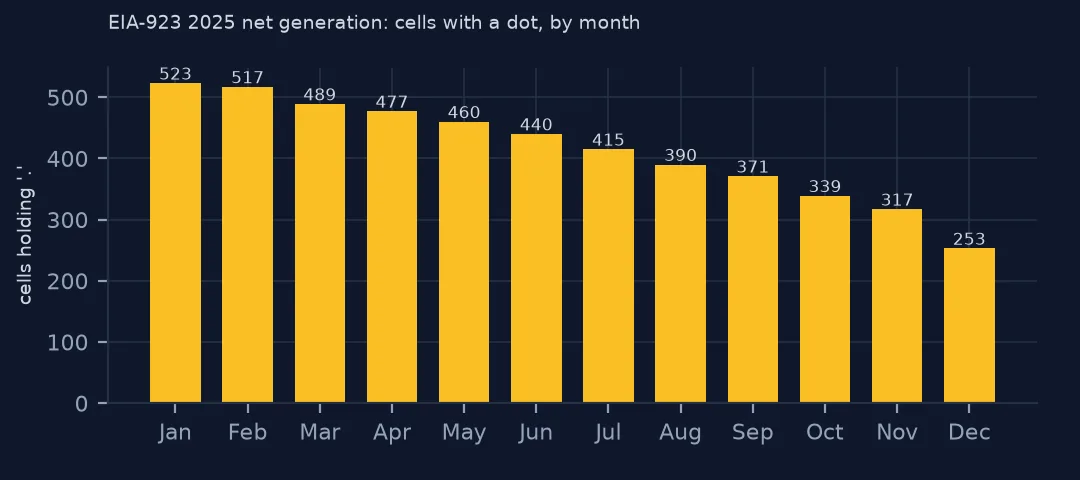
cells holding '.': 4991 | by month: {'Jan': 523, 'Feb': 517, 'Mar': 489, 'Apr': 477, 'May': 460, 'Jun': 440, 'Jul': 415, 'Aug': 390, 'Sep': 371, 'Oct': 339, 'Nov': 317, 'Dec': 253}
All twelve monthly net-generation columns are of type object, and summing them raises TypeError. The dots are most common early in the year — 523 in January, 253 in December — which hints at what many of them are.
What the dots mean
1. Which rows have dots
has = (g[months] == ".").any(axis=1)
print(f"rows with at least one dot: {has.sum():,} of {len(g):,}")
print("share with dots by respondent frequency:", has.groupby(g["Respondent Frequency"]).mean().round(3).to_dict())
rows with at least one dot: 784 of 18,889
share with dots by respondent frequency: {'A': 0.019, 'AM': 0.0, 'M': 0.092}
784 of 18,889 rows have at least one dot. They are concentrated among monthly reporters (9.2% of their rows) and rare among annual reporters (1.9%), whose months EIA fills in itself.
2. Dots come before the first month
d = g.loc[has, months] == "."
first_val = (~d).idxmax(axis=1)
leading = d.cumprod(axis=1).sum(axis=1)                 # dots before the first value
trailing = d.iloc[:, ::-1].cumprod(axis=1).sum(axis=1)   # dots after the last value
n = d.sum(axis=1)
print(f"rows whose dots all come at the start of the year: {(leading == n).mean():.1%}; all at the end: {((trailing == n) & (leading < n)).mean():.1%}; "
      f"all twelve months: {(n == 12).mean():.1%}; elsewhere: {((leading < n) & (trailing < n)).mean():.1%}")
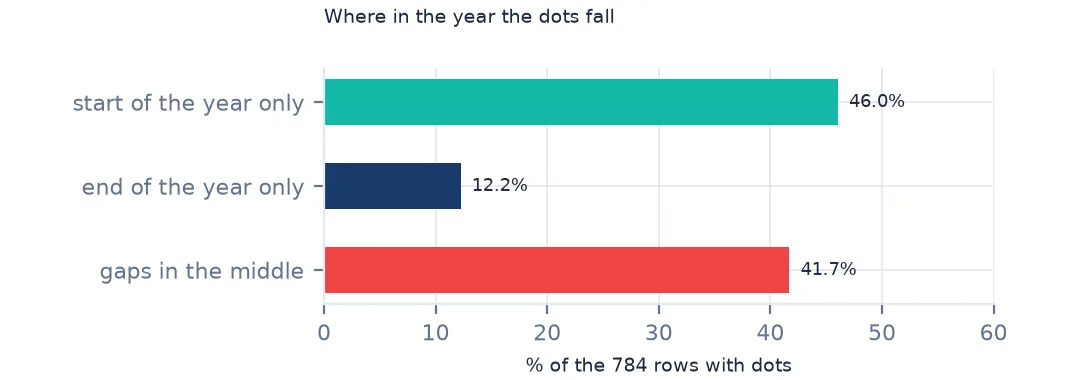
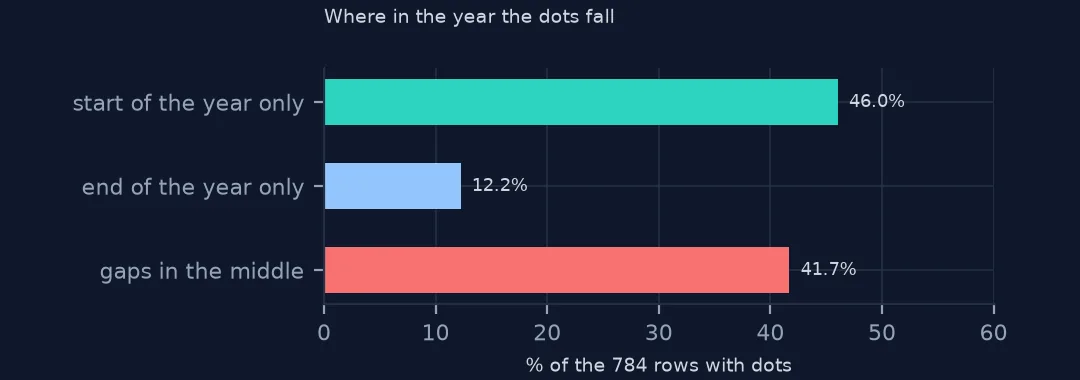
rows whose dots all come at the start of the year: 46.0%; all at the end: 12.2%; all twelve months: 0.0%; elsewhere: 41.7%
46.0% of rows with dots have them only at the start of the year — the months before the unit existed — and 12.2% only at the end, after it stopped. No row is dots for all twelve months. The other 41.7% have gaps in the middle of the year: months that were not reported, which are unknown rather than zero.
3. Match them to plants that started in 2025
gen["start"] = pd.to_numeric(gen["Operating Year"], errors="coerce")
new_plants = set(gen.groupby("Plant Code").start.min().pipe(lambda s: s[s >= 2025].index))
print(f"rows with dots at plants whose first generator started in 2025: {g.loc[has, 'Plant Id'].isin(new_plants).mean():.1%}")
rows with dots at plants whose first generator started in 2025: 34.3%
34.3% of the rows with dots belong to plants whose first generator started in 2025. The rest are existing plants with a new unit, a retired unit, or a missing report — the dot does not say which.
4. Convert, and keep the meaning
num = g[months].replace(".", np.nan).astype(float)
print(f"sum of the twelve months: {num.sum().sum() / 1e6:,.3f} TWh; annual column: {g['Net Generation (Megawatthours)'].sum() / 1e6:,.3f} TWh")
print(f"cells that are 0 (reported zero, not missing): {(num == 0).sum().sum():,}")
sum of the twelve months: 4,425.029 TWh; annual column: 4,425.029 TWh
cells that are 0 (reported zero, not missing): 39,342
With the dots as NaN the twelve months add up to the annual column exactly (4,425.029 TWh): EIA's annual figure also leaves those months out. Real zeros are common — 39,342 cells are reported as 0 MWh, from plants that did not run — and they stay distinct from the dots.
Averages, and the other columns
The data used on this page
The US Energy Information Administration's EIA-923 2025 final generation and fuel file and the EIA-860 2025 generator inventory (saved copies).
import io
import zipfile
from pathlib import Path

import geopandas as gpd
import numpy as np
import pandas as pd
import requests

Path("data").mkdir(exist_ok=True)
# EIA-860 (2025, released September 2026), EIA-923 (2025 final) and EIA-860M (August 2026), saved on 15 October 2026.
# Live: https://www.eia.gov/electricity/data/eia860/xls/eia8602025.zip, .../eia923/xls/f923_2025.zip and
# .../eia860m/xls/august_generator2026.xlsx; the annual files move to archive/xls/ when the next year's data appear.
FILES = {"eia860": "eia-860-2025-2026-10-15.zip", "eia923": "eia-923-2025-final-2026-10-15.zip",
         "eia860m": "eia-860m-august-2026-2026-10-15.xlsx"}
for name in FILES.values():
    if not Path(f"data/{name}").exists():
        Path(f"data/{name}").write_bytes(requests.get(f"https://data.spatialworkflow.io/{name}", timeout=600).content)


def read_860(member, sheet=0):
    """One sheet of an EIA-860 workbook; the first row is a title, the last row of some sheets a note."""
    with zipfile.ZipFile(f"data/{FILES['eia860']}") as z:
        d = pd.read_excel(io.BytesIO(z.read(member)), sheet_name=sheet, skiprows=1)
    return d[pd.to_numeric(d["Plant Code"], errors="coerce").notna()]


def read_923(sheet="Page 1 Generation and Fuel Data"):
    with zipfile.ZipFile(f"data/{FILES['eia923']}") as z:
        d = pd.read_excel(io.BytesIO(z.read("EIA923_Schedules_2_3_4_5_M_12_2025_Final.xlsx")), sheet_name=sheet, skiprows=5)
    d.columns = [c.replace("\n", " ") for c in d.columns]
    return d


GROUP = {"Conventional Steam Coal": "coal", "Coal Integrated Gasification Combined Cycle": "coal",
         "Natural Gas Fired Combined Cycle": "gas", "Natural Gas Fired Combustion Turbine": "gas",
         "Natural Gas Steam Turbine": "gas", "Natural Gas Internal Combustion Engine": "gas",
         "Natural Gas with Compressed Air Storage": "gas", "Other Natural Gas": "gas", "Nuclear": "nuclear",
         "Onshore Wind Turbine": "wind", "Offshore Wind Turbine": "wind", "Solar Photovoltaic": "solar",
         "Solar Thermal with or without Energy Storage": "solar", "Conventional Hydroelectric": "hydro",
         "Batteries": "storage", "Hydroelectric Pumped Storage": "storage", "Flywheels": "storage",
         "Petroleum Liquids": "oil", "Petroleum Coke": "oil", "Wood/Wood Waste Biomass": "biomass",
         "Landfill Gas": "biomass", "Municipal Solid Waste": "biomass", "Other Waste Biomass": "biomass",
         "Geothermal": "geothermal"}
gen = read_860("3_1_Generator_Y2025.xlsx", "Operable")
gen["MW"] = pd.to_numeric(gen["Nameplate Capacity (MW)"], errors="coerce")
gen["group"] = gen.Technology.map(GROUP).fillna("other")
plants = read_860("2___Plant_Y2025.xlsx")
print(f"{len(plants):,} plants, {len(gen):,} operable generators, {gen.MW.sum() / 1000:,.1f} GW nameplate")
17,349 plants, 27,918 operable generators, 1,376.7 GW nameplate
Example 1: what fillna(0) does to averages
row_mean_nan = num[has].mean(axis=1)
row_mean_zero = num[has].fillna(0).mean(axis=1)
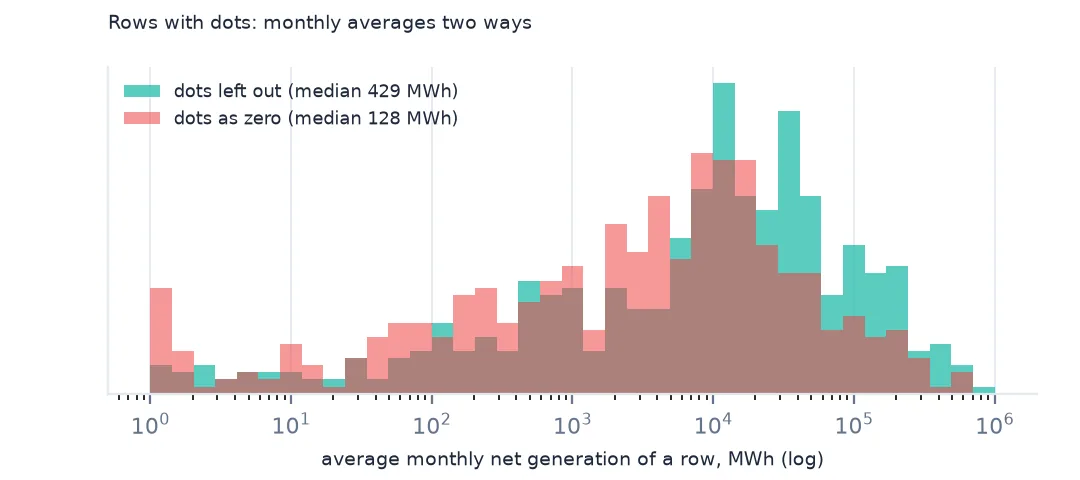
print(f"rows with dots, median monthly average: {row_mean_nan.median():,.0f} MWh ignoring dots, {row_mean_zero.median():,.0f} MWh with dots as 0")
rows with dots, median monthly average: 429 MWh ignoring dots, 128 MWh with dots as 0
For rows with dots, the median monthly average is 429 MWh when dots are left out and 128 MWh when they are counted as zero — less than a third. Any per-month average, capacity factor or seasonal profile for new plants is distorted the same way by fillna(0).
Example 2: other columns with dots
other = [c for c in g.columns if g[c].astype(str).eq(".").any()]
print(f"{len(other)} columns contain '.'; e.g. {other[:4]}")
74 columns contain '.'; e.g. ['Nuclear Unit Id', 'Operator Id', 'Quantity January', 'Quantity February']
The dot is not limited to generation: 74 columns contain it, including fuel quantities and even Nuclear Unit Id and Operator Id. Read the workbook with na_values=["."] and every column converts cleanly.
Why a dot
EIA's spreadsheets come from a reporting system where a cell with no data for the period is printed as ".", a convention older than pandas and common in government statistics. In EIA-923 it marks a month with no value for that plant, fuel and prime mover: before a unit began operating, after it retired, or a month that was simply not reported. It is the opposite of a zero, which is a plant that reported and generated nothing.
Because the annual column already excludes those months, totals agree whichever way the dots are converted. The difference appears in anything per month — averages, shares by month, seasonal shapes, capacity factors for part-year plants — which is where fillna(0) silently goes wrong.
Related traps
errors="coerce"everywhere also hides genuinely bad values; preferna_values=["."]when reading, then check what is still non-numeric.- Other EIA files (EIA-860's blank strings, the fuel receipts sheet) use spaces or "." in the same way.
- Annual reporters have no dots but estimated months; treat their monthly shape with care.
- State-level adjustment rows can make a monthly total look odd; see generation that belongs to no plant.
Internal links
- How to analyse monthly electricity generation by fuel — the monthly columns in use
- EIA-860 and EIA-923 explained — monthly and annual respondents
- EIA-923 plant 99999 — the other EIA-923 trap
FAQ
What does "." mean in EIA-923 data?
No value for that month: the unit was not yet operating, had retired, or did not report. Read it as missing, not zero.
How do I read EIA-923 monthly columns as numbers?
Pass na_values=["."] to pd.read_excel, or replace "." with NaN and convert with astype(float).