
How to Track New Generating Capacity: Planned Solar, Batteries and Gas
On this page
Problem statement
Which power plants are coming, and how many of them will actually be built? EIA's monthly generator inventory, EIA-860M, lists every planned generator that has been reported to it, with its technology, capacity, planned operating date and a status code that says how far along it is — from "planned, no approvals" to "construction complete". This guide reads the August 2026 inventory, breaks the 288.5 GW pipeline down by technology, status, year and state, compares it with what was actually built in 2025, and measures how much of the capacity due in 2026 had started operating by August.
Quick answer
Read the "Planned" sheet of the EIA-860M workbook (skiprows=2), drop the footer, convert Nameplate Capacity (MW) and Planned Operation Year to numbers, and group. Weight the result by status: a project under construction is far more likely to arrive than one without approvals.
pl = pd.read_excel(f"data/{FILES['eia860m']}", sheet_name="Planned", skiprows=2)
pl = pl[pd.to_numeric(pl["Plant ID"], errors="coerce").notna()].copy()
pl["MW"] = pd.to_numeric(pl["Nameplate Capacity (MW)"], errors="coerce")
pl["group"] = pl.Technology.map(GROUP).fillna("other")
pl["year"] = pd.to_numeric(pl["Planned Operation Year"], errors="coerce")
print(f"planned generators, August 2026: {len(pl):,}, {pl.MW.sum() / 1000:,.1f} GW")
print("by group, GW:", (pl.groupby("group").MW.sum() / 1000).sort_values(ascending=False).round(1).to_dict())
planned generators, August 2026: 2,311, 288.5 GW
by group, GW: {'solar': 122.1, 'gas': 69.4, 'storage': 67.0, 'wind': 23.8, 'nuclear': 5.0, 'hydro': 0.4, 'other': 0.3, 'biomass': 0.2, 'oil': 0.2, 'geothermal': 0.2}
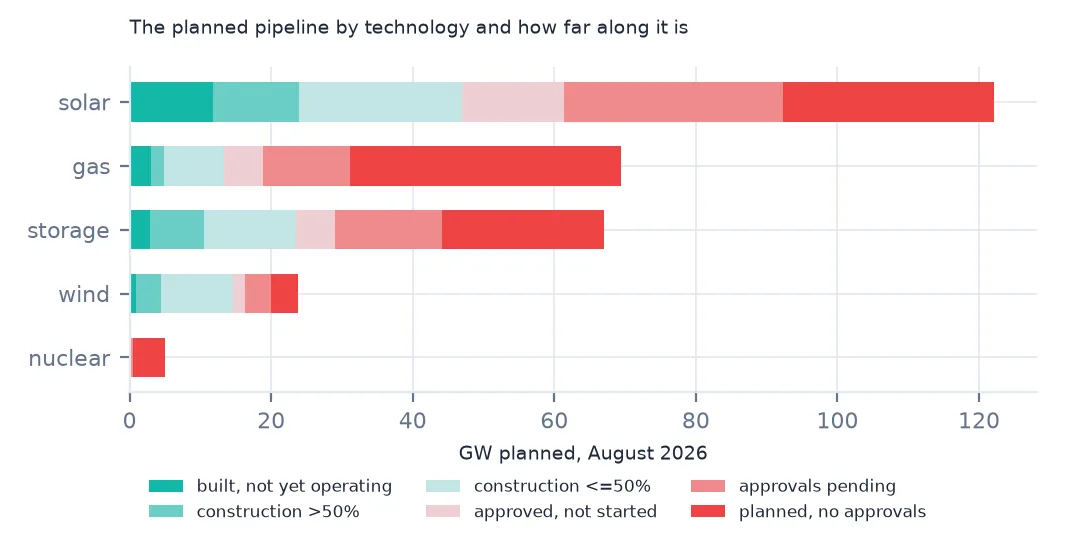
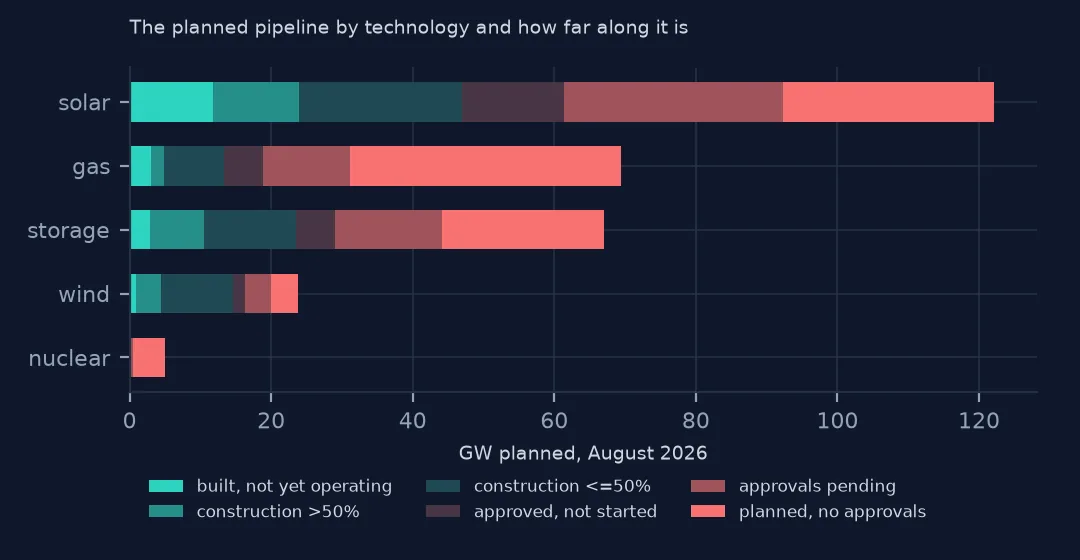
In August 2026, 2,311 planned generators added up to 288.5 GW. Solar is the largest part (122.1 GW), then gas (69.4 GW) and battery storage (67.0 GW); wind is 23.8 GW and nuclear 5.0 GW.
The pipeline by status and year
1. Status: how far along
st = pl.groupby("Status").MW.sum().sort_values(ascending=False) / 1000
print("planned GW by status:", st.round(1).to_dict())
planned GW by status: {'(P) Planned for installation, but regulatory approvals not initiated': 99.9, '(L) Regulatory approvals pending. Not under construction': 62.8, '(U) Under construction, less than or equal to 50 percent complete': 54.7, '(T) Regulatory approvals received. Not under construction': 27.2, '(V) Under construction, more than 50 percent complete': 25.2, '(TS) Construction complete, but not yet in commercial operation': 18.8}
The largest status group is the least certain: 99.9 GW is planned with no regulatory approvals started, and 62.8 GW is waiting for approvals. 54.7 GW is under construction and less than half done, 25.2 GW more than half, and 18.8 GW is built but not yet in commercial operation. Roughly a third of the pipeline is physically being built.
2. Planned year
yr = pl.pivot_table(index="year", columns="group", values="MW", aggfunc="sum", fill_value=0) / 1000
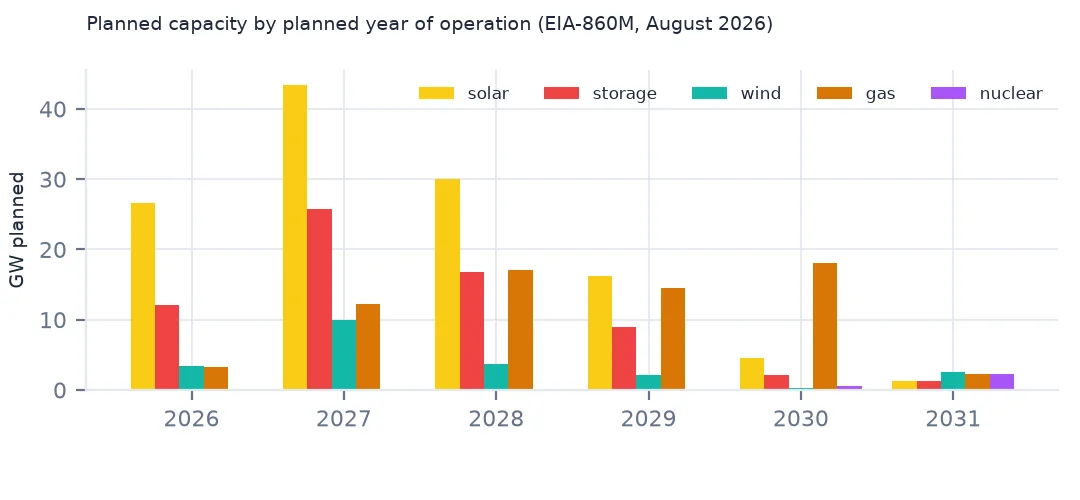
print(yr.loc[2026:2030, [c for c in ["solar", "storage", "wind", "gas"] if c in yr]].round(1).to_string())
group solar storage wind gas
year
2026.0 26.6 12.1 3.4 3.3
2027.0 43.4 25.7 10.0 12.3
2028.0 30.1 16.8 3.7 17.1
2029.0 16.2 9.0 2.1 14.5
2030.0 4.5 2.2 0.2 18.1
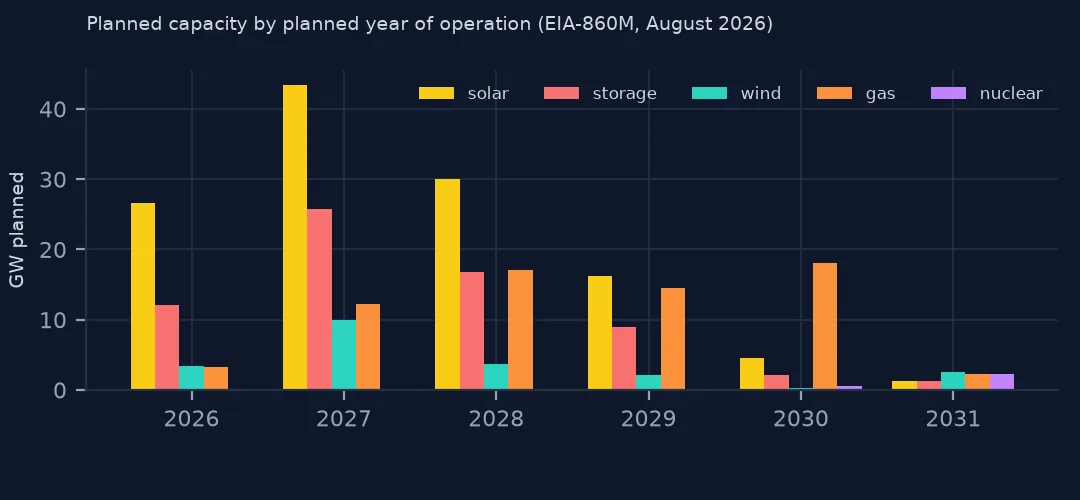
Solar peaks in 2027 (43.4 GW) and storage too (25.7 GW). Gas is the one technology whose planned additions rise into the 2030s rather than falling — 18.1 GW for 2030 against 4.5 GW of solar — because large gas plants are planned years ahead, while solar and batteries enter the inventory only a year or two before they are built.
3. What was built last year
built = gen[pd.to_numeric(gen["Operating Year"], errors="coerce") == 2025]
print(f"generators entering service in 2025 (EIA-860): {len(built):,}, {built.MW.sum() / 1000:,.1f} GW")
print("by group, GW:", (built.groupby("group").MW.sum() / 1000).sort_values(ascending=False).round(1).to_dict())
generators entering service in 2025 (EIA-860): 1,090, 57.7 GW
by group, GW: {'solar': 29.6, 'storage': 16.4, 'wind': 6.3, 'gas': 5.3, 'other': 0.1, 'oil': 0.1, 'geothermal': 0.0, 'coal': 0.0, 'biomass': 0.0, 'hydro': 0.0}
For comparison, 1,090 generators with 57.7 GW entered service in 2025: 29.6 GW of solar, 16.4 GW of storage, 6.3 GW of wind and 5.3 GW of gas. Solar and batteries were four fifths of the new capacity.
4. Plans slip
p25 = read_860("3_1_Generator_Y2025.xlsx", "Proposed")
p25["MW"] = pd.to_numeric(p25["Nameplate Capacity (MW)"], errors="coerce")
due = p25[pd.to_numeric(p25["Current Year"], errors="coerce") == 2026]
now = pd.read_excel(f"data/{FILES['eia860m']}", sheet_name="Operating", skiprows=2)
now_ids = set(zip(pd.to_numeric(now["Plant ID"], errors="coerce"), now["Generator ID"].astype(str)))
done = due[[(p, str(gid)) in now_ids for p, gid in zip(due["Plant Code"], due["Generator ID"])]]
print(f"due in 2026 according to EIA-860 2025: {due.MW.sum() / 1000:,.1f} GW; operating by August 2026: {done.MW.sum() / 1000:,.1f} GW ({done.MW.sum() / due.MW.sum():.0%})")
due in 2026 according to EIA-860 2025: 82.3 GW; operating by August 2026: 35.6 GW (43%)
The annual EIA-860 for 2025 listed 82.3 GW of generators due to start in 2026. By August 2026, 35.6 GW of them were in EIA-860M's operating inventory — 43%, with a third of the year left. Plans slip, and a planned year is an intention.
Where it is going
The data used on this page
The US Energy Information Administration's EIA-860M monthly generator inventory for August 2026 and the annual EIA-860 for 2025, saved copies; Census Bureau 2023 cartographic boundary states.
import io
import zipfile
from pathlib import Path

import geopandas as gpd
import numpy as np
import pandas as pd
import requests

Path("data").mkdir(exist_ok=True)
# EIA-860 (2025, released September 2026), EIA-923 (2025 final) and EIA-860M (August 2026), saved on 15 October 2026.
# Live: https://www.eia.gov/electricity/data/eia860/xls/eia8602025.zip, .../eia923/xls/f923_2025.zip and
# .../eia860m/xls/august_generator2026.xlsx; the annual files move to archive/xls/ when the next year's data appear.
FILES = {"eia860": "eia-860-2025-2026-10-15.zip", "eia923": "eia-923-2025-final-2026-10-15.zip",
         "eia860m": "eia-860m-august-2026-2026-10-15.xlsx"}
for name in FILES.values():
    if not Path(f"data/{name}").exists():
        Path(f"data/{name}").write_bytes(requests.get(f"https://data.spatialworkflow.io/{name}", timeout=600).content)


def read_860(member, sheet=0):
    """One sheet of an EIA-860 workbook; the first row is a title, the last row of some sheets a note."""
    with zipfile.ZipFile(f"data/{FILES['eia860']}") as z:
        d = pd.read_excel(io.BytesIO(z.read(member)), sheet_name=sheet, skiprows=1)
    return d[pd.to_numeric(d["Plant Code"], errors="coerce").notna()]


def read_923(sheet="Page 1 Generation and Fuel Data"):
    with zipfile.ZipFile(f"data/{FILES['eia923']}") as z:
        d = pd.read_excel(io.BytesIO(z.read("EIA923_Schedules_2_3_4_5_M_12_2025_Final.xlsx")), sheet_name=sheet, skiprows=5)
    d.columns = [c.replace("\n", " ") for c in d.columns]
    return d


GROUP = {"Conventional Steam Coal": "coal", "Coal Integrated Gasification Combined Cycle": "coal",
         "Natural Gas Fired Combined Cycle": "gas", "Natural Gas Fired Combustion Turbine": "gas",
         "Natural Gas Steam Turbine": "gas", "Natural Gas Internal Combustion Engine": "gas",
         "Natural Gas with Compressed Air Storage": "gas", "Other Natural Gas": "gas", "Nuclear": "nuclear",
         "Onshore Wind Turbine": "wind", "Offshore Wind Turbine": "wind", "Solar Photovoltaic": "solar",
         "Solar Thermal with or without Energy Storage": "solar", "Conventional Hydroelectric": "hydro",
         "Batteries": "storage", "Hydroelectric Pumped Storage": "storage", "Flywheels": "storage",
         "Petroleum Liquids": "oil", "Petroleum Coke": "oil", "Wood/Wood Waste Biomass": "biomass",
         "Landfill Gas": "biomass", "Municipal Solid Waste": "biomass", "Other Waste Biomass": "biomass",
         "Geothermal": "geothermal"}
gen = read_860("3_1_Generator_Y2025.xlsx", "Operable")
gen["MW"] = pd.to_numeric(gen["Nameplate Capacity (MW)"], errors="coerce")
gen["group"] = gen.Technology.map(GROUP).fillna("other")
plants = read_860("2___Plant_Y2025.xlsx")
print(f"{len(plants):,} plants, {len(gen):,} operable generators, {gen.MW.sum() / 1000:,.1f} GW nameplate")
17,349 plants, 27,918 operable generators, 1,376.7 GW nameplate
Example 1: where the batteries are going
bs = pl[pl.group == "storage"].groupby("Plant State").MW.sum().sort_values(ascending=False) / 1000
print("planned battery and storage GW by state:", bs.head(6).round(1).to_dict())
ss = pl[pl.group == "solar"].groupby("Plant State").MW.sum().sort_values(ascending=False) / 1000
print("planned solar GW by state:", ss.head(6).round(1).to_dict())
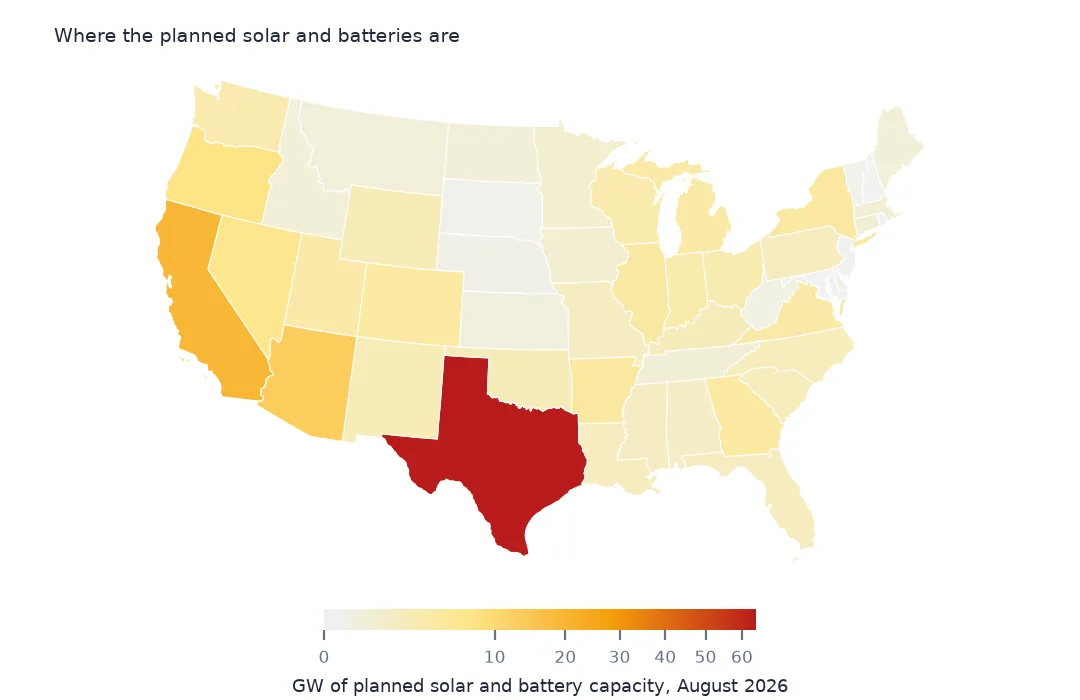
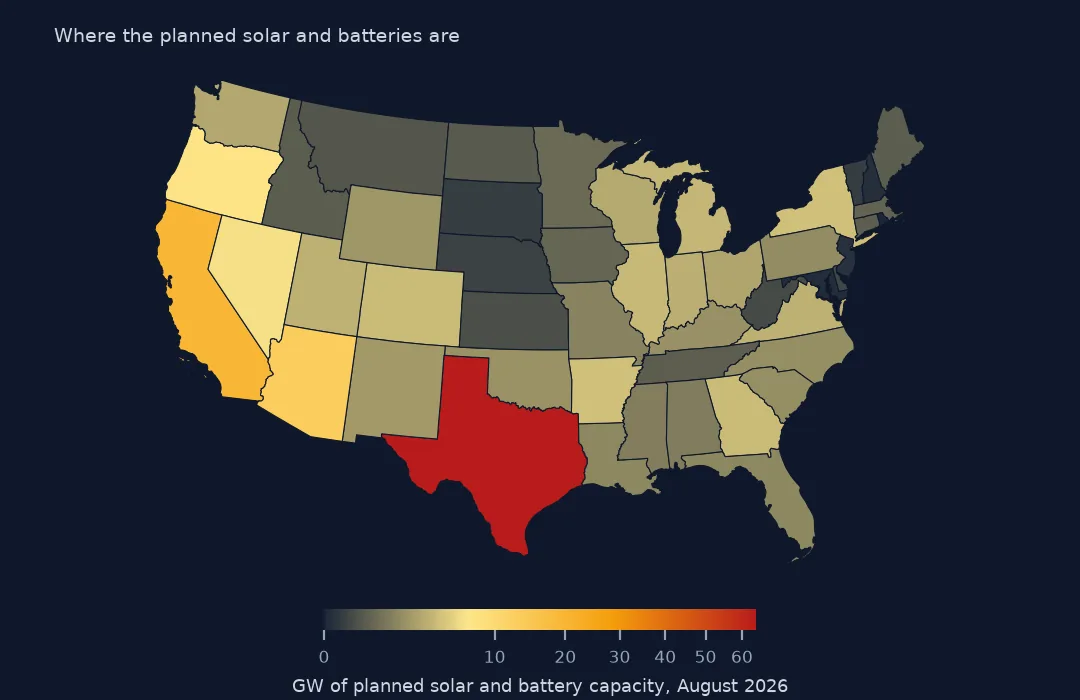
planned battery and storage GW by state: {'TX': 25.7, 'CA': 11.6, 'AZ': 6.8, 'OR': 2.9, 'NV': 2.9, 'UT': 1.9}
planned solar GW by state: {'TX': 38.4, 'CA': 7.9, 'AZ': 6.2, 'OR': 4.5, 'IL': 4.0, 'GA': 3.8}
Texas dominates both: 25.7 GW of planned storage and 38.4 GW of planned solar, more than any three other states combined in either. California (11.6 GW of storage) and Arizona (6.8) follow, and Oregon and Nevada have more planned storage than most larger states.
Example 2: project size
print("median planned generator, MW:", pl.groupby("group").MW.median().sort_values(ascending=False).round(1).to_dict())median planned generator, MW: {'nuclear': 1117.0, 'wind': 200.0, 'storage': 100.0, 'solar': 74.5, 'gas': 57.0, 'other': 32.2, 'biomass': 9.0, 'geothermal': 6.2, 'oil': 2.5, 'hydro': 2.5}
A median planned wind generator is 200 MW — EIA-860 often reports a whole wind farm as one generator — against 74.5 MW for solar and 100 MW for storage; the median planned nuclear generator is 1,117 MW.
How to read a pipeline
The planned inventory is what developers and utilities have reported to EIA, not a forecast. A generator enters it when its owner reports plans, and leaves it when it starts operating or is canceled; some projects sit there for years. The status code is the single most useful field: projects under construction or complete (U, V, TS) usually arrive within a year or two, while those without approvals (P) frequently do not arrive at all.
The interconnection queues of the grid operators hold far more capacity than EIA-860M — many times the pipeline here — because they include speculative requests years before a project is real. EIA's inventory sits between those queues and the operating fleet: firmer than a queue, less certain than steel in the ground.
Reading the monthly workbook
- Different column names. EIA-860M uses
Plant IDandPlant State; the annual file usesPlant CodeandState. - Three header rows.
skiprows=2, then drop the footer notes by keeping numeric plant IDs. - Generator IDs are text. Compare them as strings, or
1and"1"will not match when you link plans to the operating sheet. - Revisions. Each month's file replaces the last; save the one you used, as this page does.
Internal links
- How to analyse power plant retirements — what is leaving the fleet
- How to build a solar suitability map — where new solar could go
- EIA-860 and EIA-923 explained — annual and monthly inventories
FAQ
How much new generating capacity is planned in the US?
288.5 GW in EIA-860M for August 2026, led by solar (122.1 GW), gas (69.4 GW) and batteries (67.0 GW).
How much planned capacity actually gets built on time?
Of the 82.3 GW due in 2026 according to the 2025 annual inventory, 43% was operating by August 2026.