
How to Calculate Each State's Electricity Generation Mix in Python
On this page
Problem statement
"How does each state make its electricity?" is a question with a precise answer in EIA-923, which reports the net generation of every plant by fuel. Getting it means grouping two dozen fuel codes into a handful of sources, deciding what to do with generation that is negative, and normalising each state's total — and then the answers are striking: Iowa makes most of its electricity from wind, West Virginia from coal, South Carolina from nuclear. This guide computes the 2025 mix for every state and DC and maps the leading source.
Quick answer
Map MER Fuel Type Code to a few sources, sum Net Generation (Megawatthours) by Plant State and source, and divide each state's row by its total.
g = read_923()
g["source"] = g["MER Fuel Type Code"].map(MER).fillna("other")
mix = g.groupby(["Plant State", "source"])["Net Generation (Megawatthours)"].sum().unstack(fill_value=0)
mix = mix.div(mix.sum(axis=1), axis=0)
us = g.groupby("source")["Net Generation (Megawatthours)"].sum()
print("US 2025 net generation shares:", (us / us.sum()).sort_values(ascending=False).round(3).to_dict())
print("largest source by state, count:", mix.idxmax(axis=1).value_counts().to_dict())
US 2025 net generation shares: {'gas': 0.409, 'nuclear': 0.177, 'coal': 0.164, 'wind': 0.104, 'solar': 0.068, 'hydro': 0.055, 'biomass': 0.01, 'oil': 0.006, 'geothermal': 0.004, 'other': 0.002}
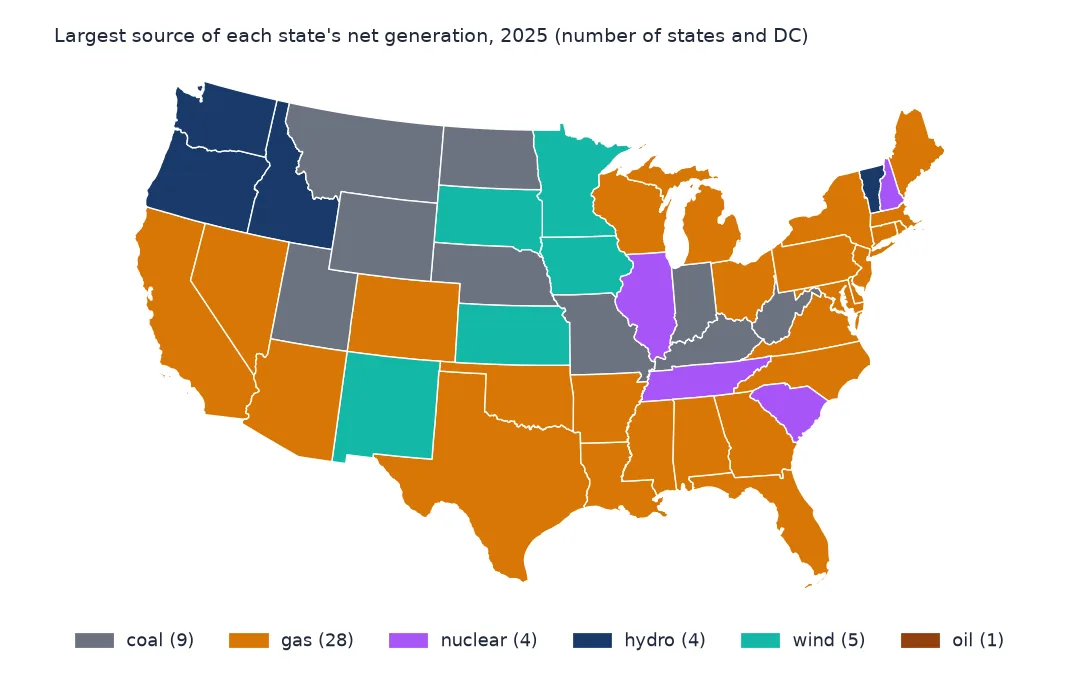
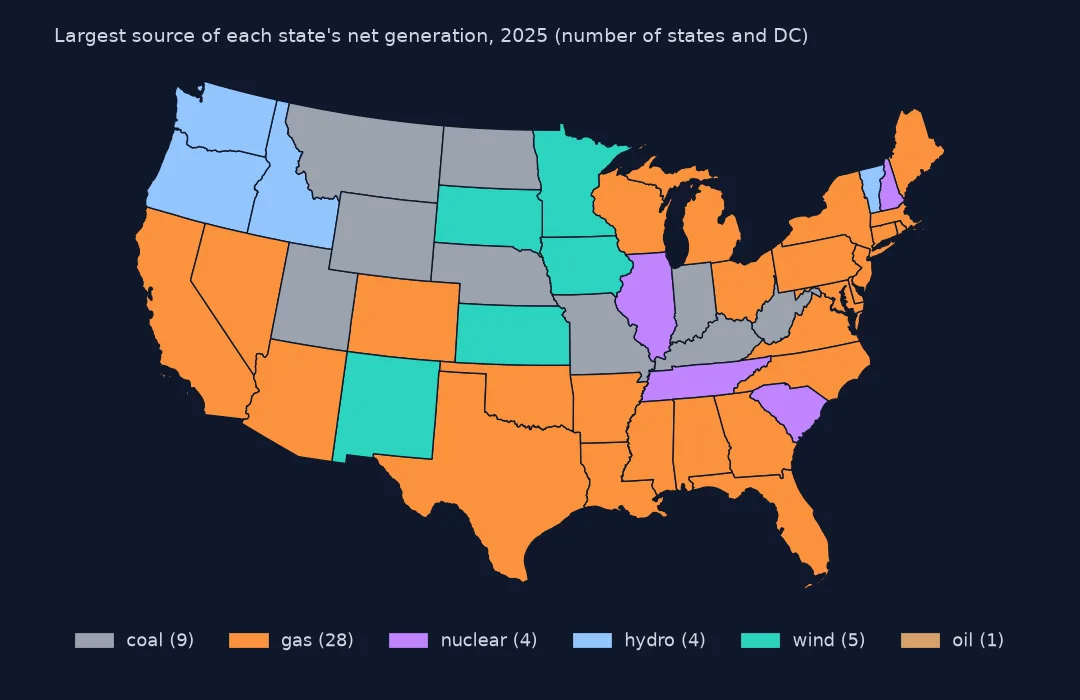
largest source by state, count: {'gas': 28, 'coal': 9, 'wind': 5, 'hydro': 4, 'nuclear': 4, 'oil': 1}
In 2025 natural gas produced 40.9% of US net generation, nuclear 17.7%, coal 16.4%, wind 10.4%, solar 6.8% and hydro 5.5%. Of the 50 states and DC, gas is the largest source in 28, coal in 9, wind in 5, and hydro and nuclear in 4 each; oil leads only in Hawaii.
From fuel codes to a state mix
1. Group fuel codes into sources
print(g.groupby(["MER Fuel Type Code", "source"])["Net Generation (Megawatthours)"].sum().div(1e6).round(1).sort_values(ascending=False).head(10).to_string())MER Fuel Type Code source
NG gas 1811.0
NUC nuclear 785.3
COL coal 727.2
WND wind 461.6
SUN solar 300.3
HYC hydro 241.3
WWW biomass 31.2
GEO geothermal 15.6
MLG biomass 12.1
OOG other 9.5
The MER codes are the fuel categories of EIA's Monthly Energy Review: NG natural gas, NUC nuclear, COL coal, WND wind, SUN solar, HYC conventional hydro. The long tail — wood (WWW), landfill gas (MLG), other gases (OOG), oils — is small nationally but decides the mix in some small states, so group it rather than drop it.
2. Net generation can be negative
neg = g[g["Net Generation (Megawatthours)"] < 0]
print(f"rows with negative net generation: {len(neg):,}; total {neg['Net Generation (Megawatthours)'].sum() / 1e6:.2f} TWh")
print("pumped storage net generation, TWh:", round(g.loc[g["MER Fuel Type Code"] == "HPS", "Net Generation (Megawatthours)"].sum() / 1e6, 2))
rows with negative net generation: 1,008; total -12.08 TWh
pumped storage net generation, TWh: -5.36
1,008 rows have negative net generation, totalling −12.08 TWh. A plant's net generation is what it sends to the grid minus what it draws; plants that sit idle draw power for their own equipment, and pumped-storage hydro (−5.36 TWh) consumes more pumping water uphill than it returns. Keep the negatives — they are real — but do not plot them as a source.
3. Shares by state
for s in ["IA", "WV", "VT", "CA", "TX", "SC"]:
    r = mix.loc[s]
    print(s, r[r > 0.05].sort_values(ascending=False).round(2).to_dict())
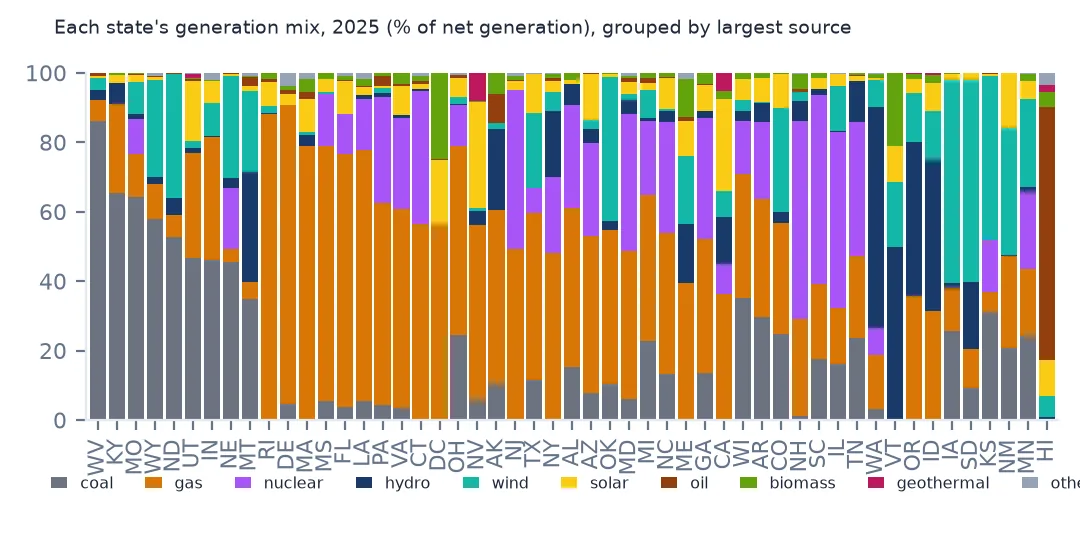
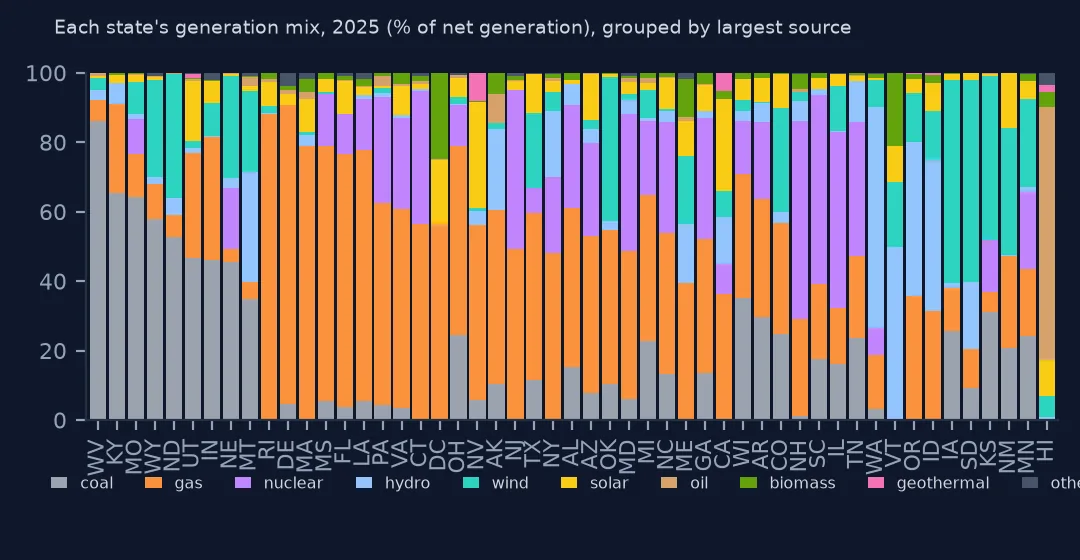
IA {'wind': 0.58, 'coal': 0.26, 'gas': 0.12}
WV {'coal': 0.86, 'gas': 0.06}
VT {'hydro': 0.5, 'biomass': 0.21, 'wind': 0.19, 'solar': 0.1}
CA {'gas': 0.36, 'solar': 0.27, 'hydro': 0.14, 'nuclear': 0.09, 'wind': 0.07, 'geothermal': 0.05}
TX {'gas': 0.48, 'wind': 0.22, 'coal': 0.11, 'solar': 0.11, 'nuclear': 0.07}
SC {'nuclear': 0.55, 'gas': 0.22, 'coal': 0.17}
The mixes differ enormously. Iowa: 58% wind. West Virginia: 86% coal. Vermont: half hydro, then biomass and wind. California: gas 36%, solar 27%, hydro 14%, with nuclear and geothermal. Texas: gas 48%, wind 22%, and coal and solar 11% each. South Carolina: 55% nuclear.
4. Map the leading source
lead = mix.idxmax(axis=1).rename("lead")
m = states.merge(lead, left_on="STUSPS", right_index=True, how="left")
print(m.lead.value_counts(dropna=False).to_dict())
print(f"states where wind and solar together exceed half: {((mix.get('wind', 0) + mix.get('solar', 0)) > 0.5).sum()}")
{'gas': 28, 'coal': 9, 'wind': 5, 'hydro': 4, 'nuclear': 4, 'oil': 1}
states where wind and solar together exceed half: 3
On the map, gas leads along the coasts, across the South and in Pennsylvania and Ohio; coal leads in the interior from Utah and Montana to Indiana, Kentucky and West Virginia; wind leads in Iowa, Kansas, Minnesota, New Mexico and South Dakota; hydro in the Northwest and Vermont. In 3 states wind and solar together make more than half of all generation.
Size and low-carbon share
The data used on this page
The US Energy Information Administration's EIA-923 2025 final generation data (saved copy), grouped by MER Fuel Type Code, and Census Bureau 2023 cartographic boundary states.
import io
import zipfile
from pathlib import Path

import geopandas as gpd
import numpy as np
import pandas as pd
import requests

Path("data").mkdir(exist_ok=True)
# EIA-860 (2025, released September 2026), EIA-923 (2025 final) and EIA-860M (August 2026), saved on 15 October 2026.
# Live: https://www.eia.gov/electricity/data/eia860/xls/eia8602025.zip, .../eia923/xls/f923_2025.zip and
# .../eia860m/xls/august_generator2026.xlsx; the annual files move to archive/xls/ when the next year's data appear.
FILES = {"eia860": "eia-860-2025-2026-10-15.zip", "eia923": "eia-923-2025-final-2026-10-15.zip",
         "eia860m": "eia-860m-august-2026-2026-10-15.xlsx"}
for name in FILES.values():
    if not Path(f"data/{name}").exists():
        Path(f"data/{name}").write_bytes(requests.get(f"https://data.spatialworkflow.io/{name}", timeout=600).content)


def read_860(member, sheet=0):
    """One sheet of an EIA-860 workbook; the first row is a title, the last row of some sheets a note."""
    with zipfile.ZipFile(f"data/{FILES['eia860']}") as z:
        d = pd.read_excel(io.BytesIO(z.read(member)), sheet_name=sheet, skiprows=1)
    return d[pd.to_numeric(d["Plant Code"], errors="coerce").notna()]


def read_923(sheet="Page 1 Generation and Fuel Data"):
    with zipfile.ZipFile(f"data/{FILES['eia923']}") as z:
        d = pd.read_excel(io.BytesIO(z.read("EIA923_Schedules_2_3_4_5_M_12_2025_Final.xlsx")), sheet_name=sheet, skiprows=5)
    d.columns = [c.replace("\n", " ") for c in d.columns]
    return d


MER = {"NG": "gas", "COL": "coal", "NUC": "nuclear", "WND": "wind", "SUN": "solar", "HYC": "hydro",
       "DFO": "oil", "RFO": "oil", "PC": "oil", "WOC": "oil", "WWW": "biomass", "MLG": "biomass", "ORW": "biomass",
       "WOO": "biomass", "GEO": "geothermal"}                       # everything else, pumped storage included: "other"
f = Path("data/cb_2023_us_state_20m.zip")
if not f.exists():
    f.write_bytes(requests.get("https://www2.census.gov/geo/tiger/GENZ2023/shp/cb_2023_us_state_20m.zip", timeout=300).content)
states = gpd.read_file(f)
states = states[~states.STUSPS.isin(["PR"])]
print(f"{len(states)} state outlines")
51 state outlines
Example 1: generation, not just shares
tot = g.groupby("Plant State")["Net Generation (Megawatthours)"].sum().sort_values(ascending=False) / 1e6
print("largest generators, TWh:", tot.head(5).round(1).to_dict())
print("smallest:", tot.tail(3).round(2).to_dict())
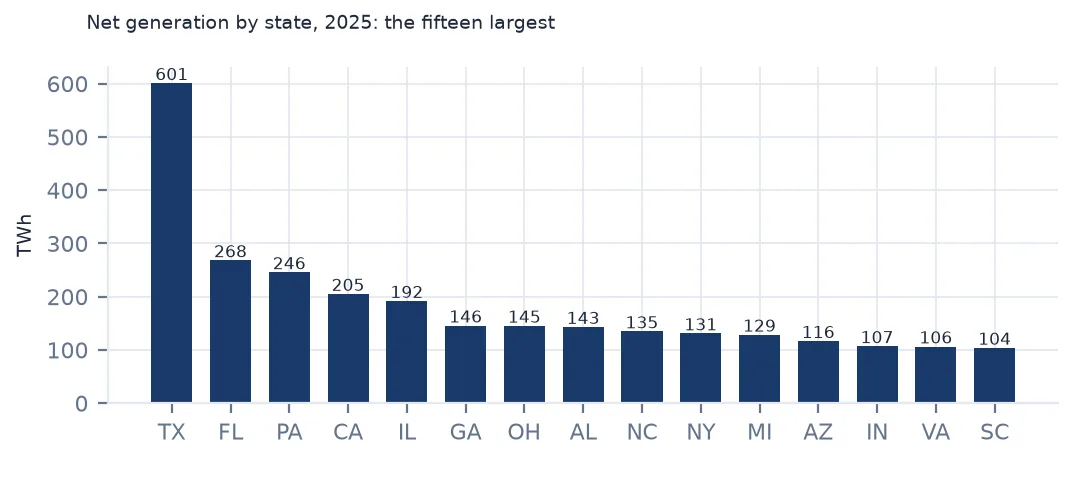
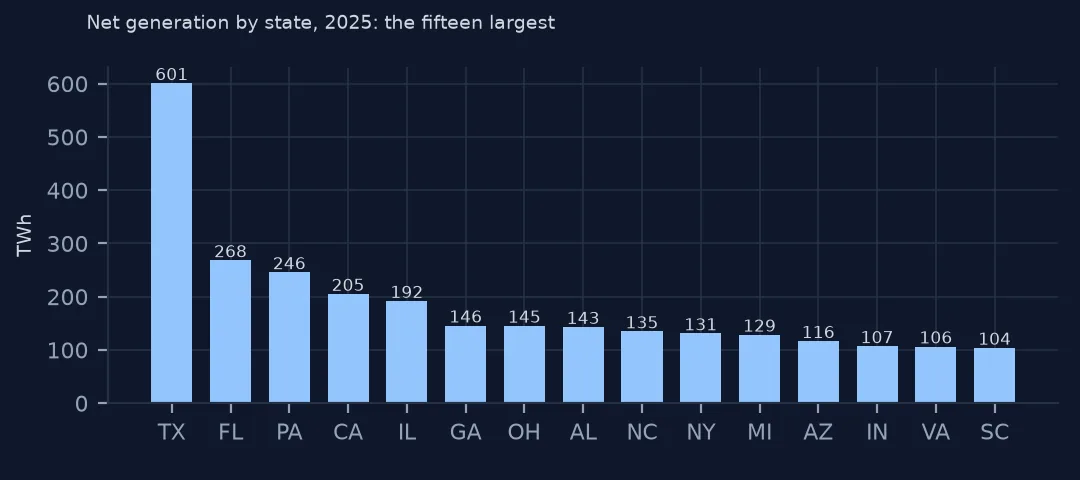
largest generators, TWh: {'TX': 601.0, 'FL': 268.3, 'PA': 245.7, 'CA': 205.1, 'IL': 191.8}
smallest: {'DE': 5.46, 'VT': 2.03, 'DC': 0.2}
Shares hide size. Texas generated 601.0 TWh in 2025, more than twice Florida (268.3); Vermont generated 2.03 TWh and DC 0.2. A state's mix says what it generates, not what it consumes: Vermont imports most of its electricity.
Example 2: zero-carbon share
zc = mix[[c for c in ["nuclear", "wind", "solar", "hydro"] if c in mix]].sum(axis=1).sort_values(ascending=False)
print("nuclear + wind + solar + hydro, highest:", zc.head(5).round(2).to_dict())
print("lowest:", zc.tail(5).round(2).to_dict())
nuclear + wind + solar + hydro, highest: {'WA': 0.8, 'SD': 0.79, 'VT': 0.79, 'IL': 0.68, 'ID': 0.66}
lowest: {'MA': 0.14, 'RI': 0.09, 'KY': 0.08, 'WV': 0.07, 'DE': 0.03}
Counting nuclear, wind, solar and hydro as zero-carbon, Washington (0.8), South Dakota and Vermont (0.79) lead; West Virginia (0.07) and Delaware (0.03) come last.
Generation, not consumption
EIA-923 counts electricity where it is generated. States trade power across the grid — Pennsylvania and Illinois export, California and the New England states import — so a state's generation mix is not the mix of the electricity its residents use. For a consumption mix you need the balancing-authority interchange data or EIA's state electricity profiles, which estimate trade.
Net generation is also not gross: it excludes what plants use themselves, which is why it can go negative. For the shares on this page that is the right measure, since it is what reached the grid. The Plant ID 99999 rows, state-level adjustments that cover small plants EIA estimates, are included here, as they belong in state totals.
Grouping choices
- Biomass and waste. Wood, landfill gas and municipal solid waste are grouped as biomass here; some reports call municipal waste non-renewable.
- Pumped storage is a net consumer and belongs with storage, not hydro.
- Hydro varies with rain. A state's hydro share in 2025 can differ by many points from another year's.
- Puerto Rico is on a separate sheet and not in the state map.
Internal links
- How to analyse monthly electricity generation by fuel — the same data month by month
- EIA-923 plant 99999 — rows that are in the totals but not on a map
- Capacity factor explained — generation against capacity
FAQ
What share of US electricity came from natural gas in 2025?
40.9% of net generation, from EIA-923's 2025 final data; nuclear was 17.7% and coal 16.4%.
Which state gets the most electricity from wind?
Iowa, at 58% of its 2025 generation.