
Fireball Energy Explained: From Radiated Joules to Kilotons of Impact Energy
On this page
Problem statement
Each fireball in NASA/JPL's fireball reports has two energies. energy is what the satellites measured: the light the fireball radiated, in units of 10¹⁰ joules. impact-e is in kilotons of TNT, the figure news reports quote, and it is several times larger, because most of an incoming rock's energy goes into heat, sound and the shock wave rather than light. The second number isn't measured at all; it is calculated from the first. This page reproduces that calculation, shows how much of the energy is light, and uses the table to count how often fireballs of each size arrive.
Quick answer
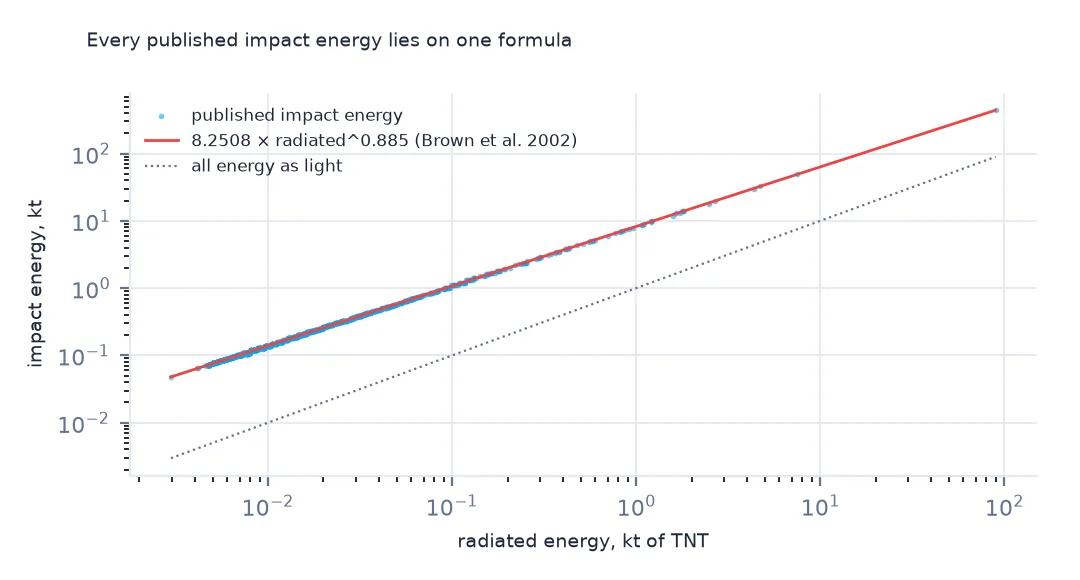
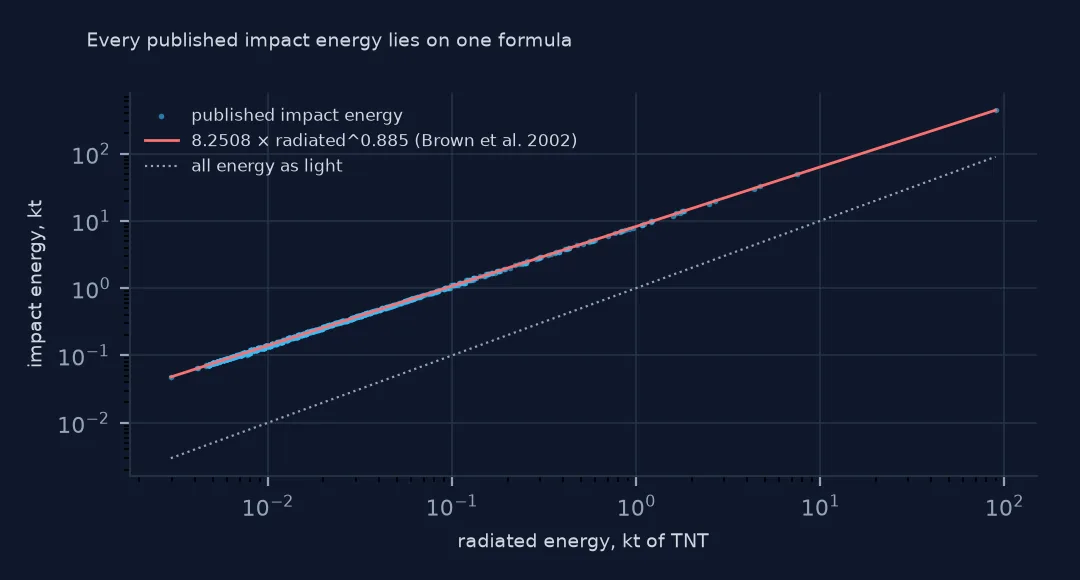
Convert the radiated energy to kilotons and apply the empirical relation of Brown and colleagues (2002), which the table's impact energies follow:
fb[["energy", "impact-e"]] = fb[["energy", "impact-e"]].apply(pd.to_numeric)
radiated_kt = fb.energy * 1e10 / 4.184e12            # 1 kt of TNT = 4.184e12 J
fb["model_kt"] = 8.2508 * radiated_kt ** 0.885         # Brown et al. (2002), Nature 420, 294
print((fb["impact-e"] / fb.model_kt).describe().round(3).loc[["count", "min", "50%", "max"]].to_string())
count 1074.000
min 0.905
50% 0.999
max 1.045
For all 1,074 fireballs the published impact energy equals the formula's result: the median ratio is 0.999, and the extremes, 0.905 and 1.045, come from rounding. So impact-e adds no measurement to energy; it is a model of it. If the relation between light and total energy is wrong for a given rock, both the kilotons and every statistic built on them are wrong in the same way.
Light, total energy and the formula between them
1. The radiated energy
print((fb.energy * 1e10).describe().loc[["min", "50%", "max"]].map(lambda v: f"{v:.2e} J").to_string())
print(f"as a share of the impact energy: median {(radiated_kt / fb['impact-e']).median():.1%}, range {(radiated_kt / fb['impact-e']).min():.1%} to {(radiated_kt / fb['impact-e']).max():.1%}")
min 1.24e+10 J
50% 6.14e+10 J
max 3.75e+14 J
as a share of the impact energy: median 7.5%, range 6.2% to 20.3%
The radiated energies run from 1.24 × 10¹⁰ J to 3.75 × 10¹⁴ J, and the median fireball radiated 6.14 × 10¹⁰ J in light alone. Light is a small part of the whole: a median of 7.5% of the impact energy, rising to 20.3% for the largest event. The formula's exponent below 1 makes the larger fireballs convert a larger share of their energy into light.
2. Where the rounding comes from
r = fb["impact-e"] / fb.model_kt
off = fb.assign(ratio=r)[(r < 0.95) | (r > 1.04)]
print(off[["date", "energy", "impact-e", "model_kt", "ratio"]].round(3).to_string(index=False))
date energy impact-e model_kt ratio
2015-04-10 01:14:27 3.03 0.11 0.105 1.045
2013-02-20 13:13:07 3.20 0.10 0.111 0.905
2009-04-20 04:01:39 3.35 0.12 0.115 1.043
Only three events are more than 4% from the formula, and all three are small, with impact energies of 0.10 to 0.12 kt published to two significant figures. A model value of 0.111 kt printed as 0.10 is 10% off. Recompute the impact energy from energy when you need more digits than the table gives.
3. How often each size arrives
fb["date"] = pd.to_datetime(fb.date)
recent = fb[fb.date.between("2005-01-01", "2024-12-31")]
years = 20
for kt in [0.1, 0.3, 1, 3, 10]:
    n = (recent["impact-e"] >= kt).sum()
    print(f">= {kt:>4} kt: {n:>4} in {years} years, {n / years:5.1f} a year")
>= 0.1 kt: 583 in 20 years, 29.1 a year
>= 0.3 kt: 247 in 20 years, 12.3 a year
>= 1 kt: 76 in 20 years, 3.8 a year
>= 3 kt: 28 in 20 years, 1.4 a year
>= 10 kt: 8 in 20 years, 0.4 a year
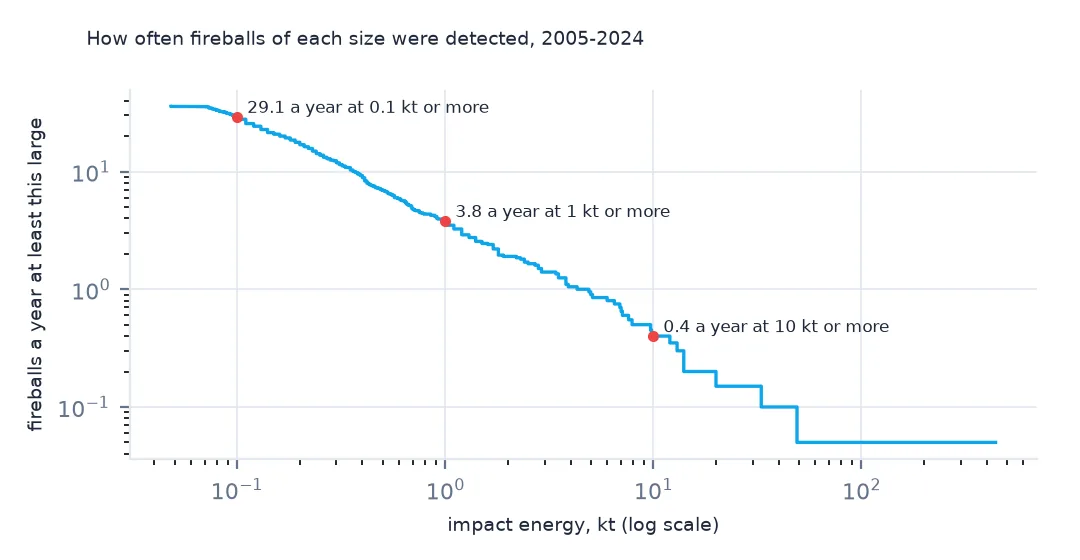
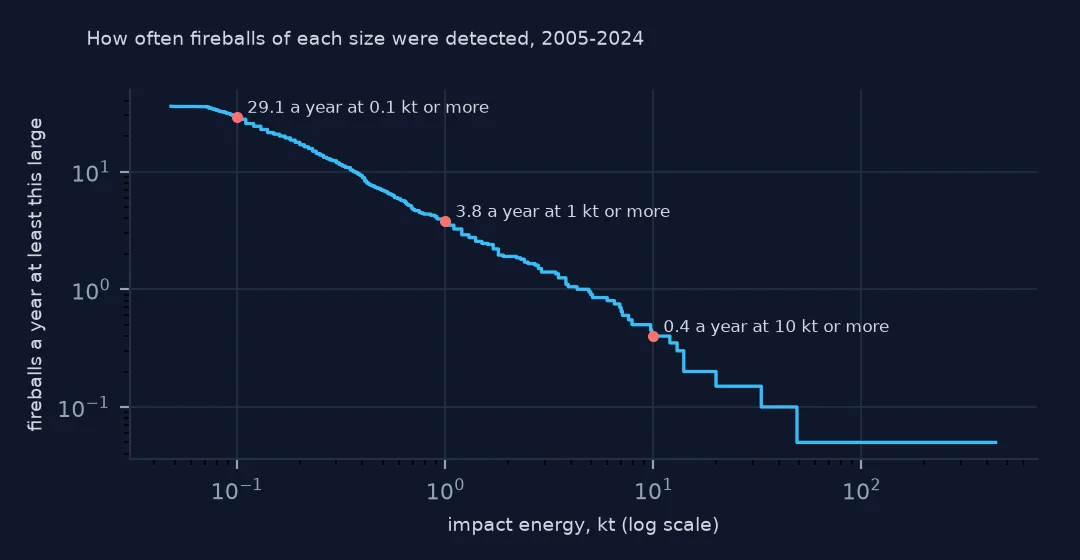
Over the 20 years 2005–2024, the table has 29.1 fireballs a year of at least 0.1 kt, 3.8 a year of at least 1 kt and 0.4 a year, eight in all, of at least 10 kt. Each tenfold step in energy makes events roughly eight to ten times rarer. These are detection rates: the smallest events are partly missed, so the true rate of 0.1 kt fireballs is higher than 29 a year, while a 10 kt event is unlikely to escape the sensors.
Chelyabinsk against the rest
The data used on this page
NASA/JPL's Fireball Data API from the Center for Near Earth Object Studies, every record, downloaded on 28 October 2026 and saved on this site. The relation is from P. Brown and colleagues, "The flux of small near-Earth objects colliding with the Earth", Nature 420, 294–296 (2002); a kiloton of TNT is defined as 4.184 × 10¹² J.
from pathlib import Path
import json
import zipfile

import geopandas as gpd
import numpy as np
import pandas as pd
import requests

Path("data").mkdir(exist_ok=True)
# Every fireball in NASA/JPL's Fireball Data API (CNEOS), with NASA's Meteorite Landings table and Natural Earth's
# countries and land. Saved 28 October 2026: new fireballs are added as they are reported.
# Live: https://ssd-api.jpl.nasa.gov/fireball.api?vel-comp=true
ARCHIVE = "nasa-meteorites-2026-10-28.zip"
if not Path(f"data/{ARCHIVE}").exists():
    Path(f"data/{ARCHIVE}").write_bytes(requests.get(f"https://data.spatialworkflow.io/{ARCHIVE}", timeout=600).content)
Z = zipfile.ZipFile(f"data/{ARCHIVE}")
raw = json.loads(Z.read("fireball.json"))
fb = pd.DataFrame(raw["data"], columns=raw["fields"])
for f in ["ne_110m_admin_0_countries.zip", "ne_50m_land.zip"]:
    Path(f"data/{f}").write_bytes(Z.read(f))
print(f"{raw['signature']['source']}: {len(fb):,} fireballs")
NASA/JPL Fireball Data API: 1,074 fireballs
Example 1: Chelyabinsk against the rest
big = fb.nlargest(3, "impact-e")
print(big[["date", "energy", "impact-e"]].to_string(index=False))
print(f"Chelyabinsk impact energy as a multiple of the median fireball: {fb['impact-e'].max() / fb['impact-e'].median():,.0f}x")
print(f"its share of all impact energy in the table: {fb['impact-e'].max() / fb['impact-e'].sum():.1%}")
date energy impact-e
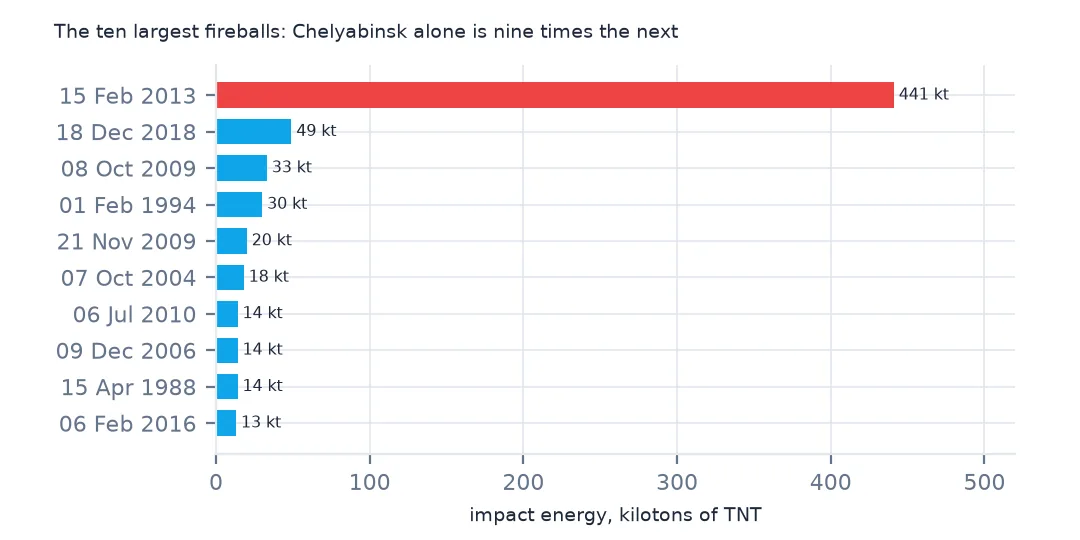
2013-02-15 03:20:26 37500.0 441.0
2018-12-18 23:48:18 3130.0 49.0
2009-10-08 02:57:14 1980.0 33.0
Chelyabinsk impact energy as a multiple of the median fireball: 2,205x
its share of all impact energy in the table: 36.5%
The Chelyabinsk fireball of 15 February 2013 radiated 3.75 × 10¹⁴ J, and its 441 kt of impact energy is 2,205 times the median fireball's. That single event holds 36.5% of all the impact energy in the table, nine times the next largest, the 49 kt Bering Sea event of 2018. Totals and averages of this column are dominated by whichever large event falls in the period; compare counts above a threshold instead.
Internal links
- Reading the fireball reports — positions, speeds and the gaps
- The largest meteorites — what reaches the ground
- Hazard and risk explained — frequency against consequence