
Meteorite Falls and Finds Explained: Why Most Meteorites Come From Antarctica
On this page
Problem statement
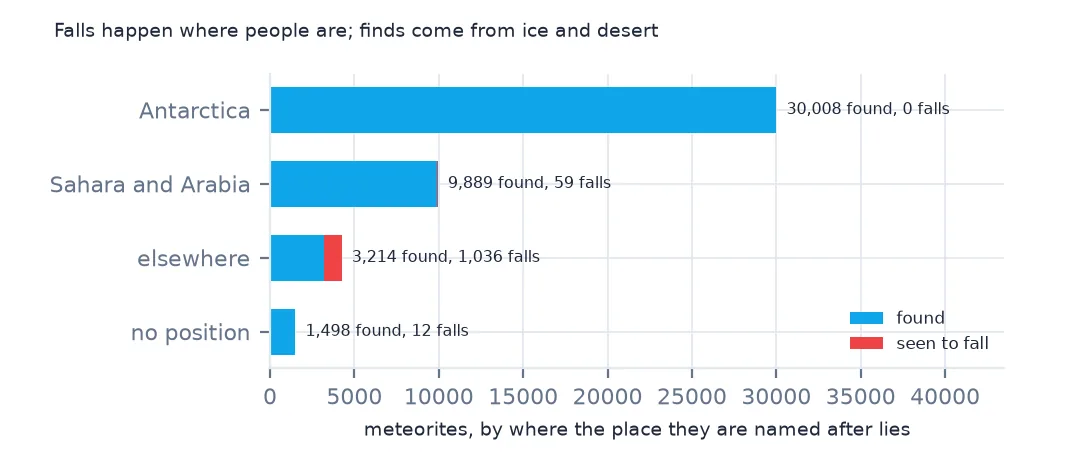
Every meteorite in the record is either a fall or a find. A fall was seen coming down and picked up soon after; a find was simply found, sometimes thousands of years after it landed. The two are collected in completely different ways, and that shapes everything a map or a count of meteorites shows. Most meteorites known today were found by expeditions on the ice of Antarctica or in the hot deserts of North Africa and Arabia, not where they fall most often, which is everywhere. This page measures where the falls and the finds in NASA's Meteorite Landings table come from, and what each kind can and can't tell you.
Quick answer
Group the meteorites by where their namesake place lies and cross that with fall:
print(met.fall.value_counts().to_string())
met["place"] = met.name.str.replace(r"\s*[A-Z]?\d+.*$", "", regex=True)       # "Yamato 791197" -> "Yamato"
ok = met.reclat.notna() & (met.reclat != 0) & (met.reclong != 0)
at = met[ok].groupby("place")[["reclat", "reclong"]].median()                # where each place's located finds are
lat, lon = met.place.map(at.reclat), met.place.map(at.reclong)
met["region"] = np.select([lat.isna(), lat < -60, lat.between(12, 35) & lon.between(-18, 60)],
                          ["no position", "Antarctica", "Sahara and Arabia"], "elsewhere")
print(pd.crosstab(met.region, met.fall, margins=True).to_string())
fall
Found 44609
Fell 1107
fall Fell Found All
region
Antarctica 0 30008 30008
Sahara and Arabia 59 9889 9948
elsewhere 1036 3214 4250
no position 12 1498 1510
All 1107 44609 45716
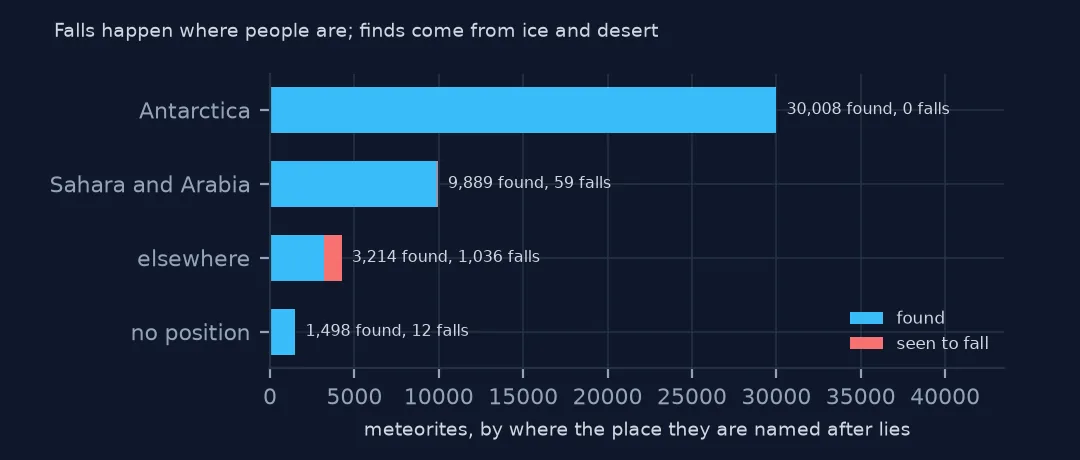
Only 1,107 of the 45,716 meteorites are falls. 30,008 finds come from places in Antarctica and 9,889 from the Sahara and Arabia, together nearly nine in ten meteorites, while the rest of the world supplies 3,214 finds and almost all the falls. Antarctica has no falls at all: nobody is there to see one. Most of the 1,510 meteorites with no position belong to Antarctic places such as Larkman Nunatak, whose finds all lack coordinates.
Two ways a meteorite enters the record
1. A fall is seen, a find is picked up
fell, found = met[met.fall == "Fell"], met[met.fall == "Found"]
print(f"median year: falls {fell.year.median():.0f}, finds {found.year.median():.0f}")
print(f"median mass: falls {fell.mass_g.median():,.0f} g, finds {found.mass_g.median():,.1f} g")
median year: falls 1924, finds 1998
median mass: falls 2,800 g, finds 30.5 g
Falls are old and big, finds recent and small. The median fall happened in 1924, while the median find dates from 1998. The median fall weighs 2,800 g against 30.5 g for a find. A fall is collected because someone saw a fireball or heard the sonic boom and went looking, so the stones that reach the record are the ones large enough to find in a field. A find on bare ice or desert gravel can be a few grams, because nothing else there is a dark stone.
2. Where finds come from, decade by decade
f = met[(met.fall == "Found") & met.year.between(1950, 2009)]
t = pd.crosstab(f.year // 10 * 10, f.region)
print(t.to_string())
region Antarctica Sahara and Arabia elsewhere no position
year
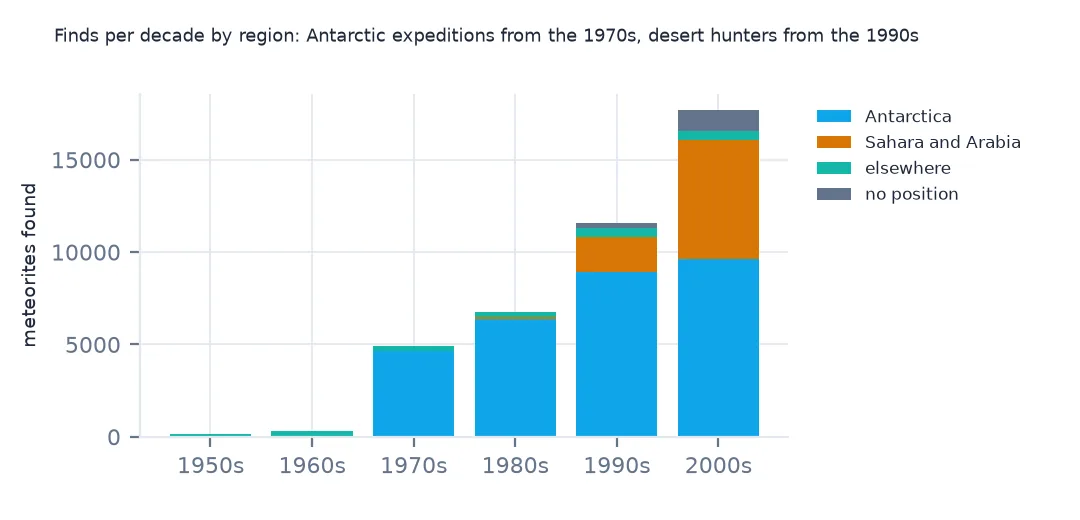
1950.0 0 19 129 4
1960.0 12 13 301 9
1970.0 4621 8 276 4
1980.0 6365 148 246 7
1990.0 8925 1887 475 276
2000.0 9614 6445 497 1142
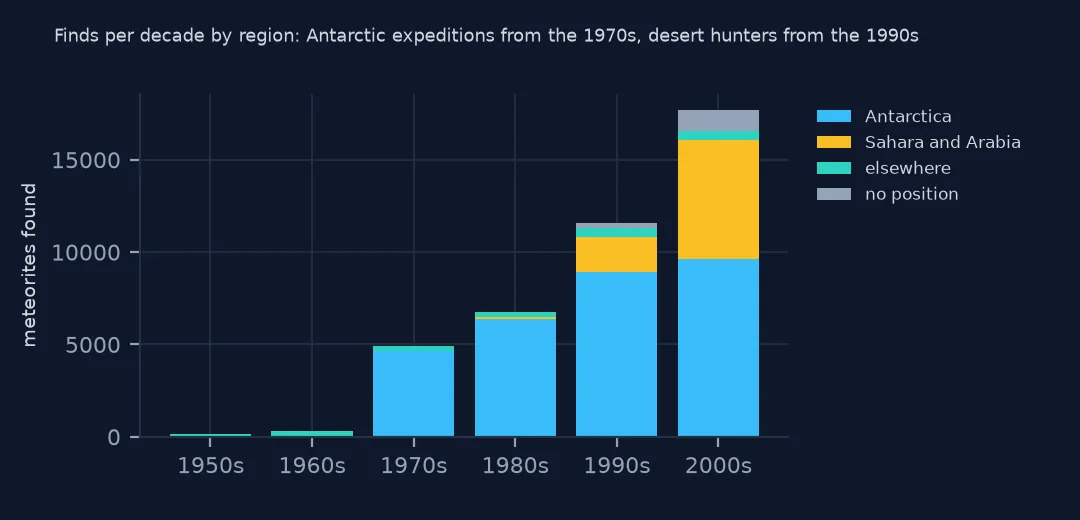
The find record is a history of expeditions. Until the 1960s finds were a few hundred a decade, found by farmers and prospectors. Antarctic collecting began in earnest in the 1970s, when Japanese and American teams found that moving ice carries meteorites to blue-ice fields below mountains and leaves them on the surface as the wind strips the ice away: 4,621 finds in the 1970s, 9,614 in the 2000s. The desert harvest started in the 1990s, when meteorite hunters began searching the Sahara and Oman, and reached 6,445 in the 2000s. Finds everywhere else stayed in the hundreds.
3. What falls show that finds hide
kind = np.where(met.recclass.str.startswith("Iron"), "iron", np.where(met.recclass.str.contains("Pallasite|Mesosiderite"), "stony-iron", "stony"))
print(pd.crosstab(np.where(met.fall == "Fell", "falls", "finds " + met.region), kind, normalize="index").round(3).to_string())
col_0 iron stony stony-iron
row_0
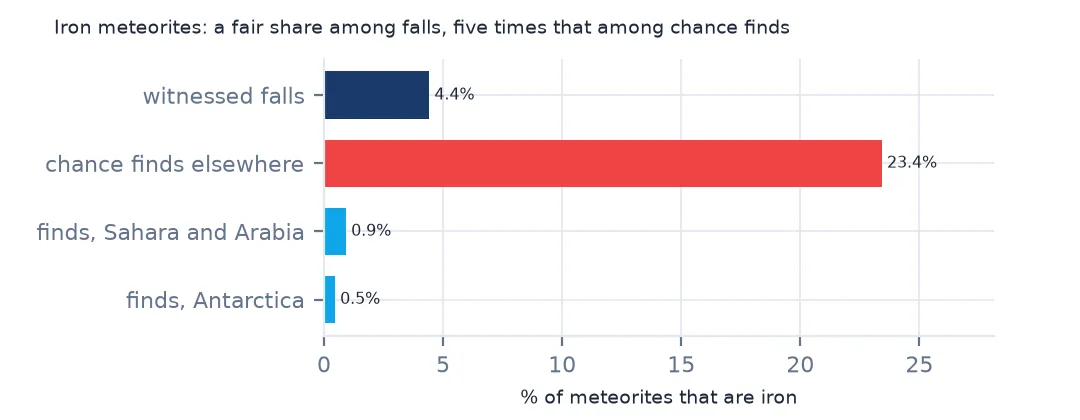
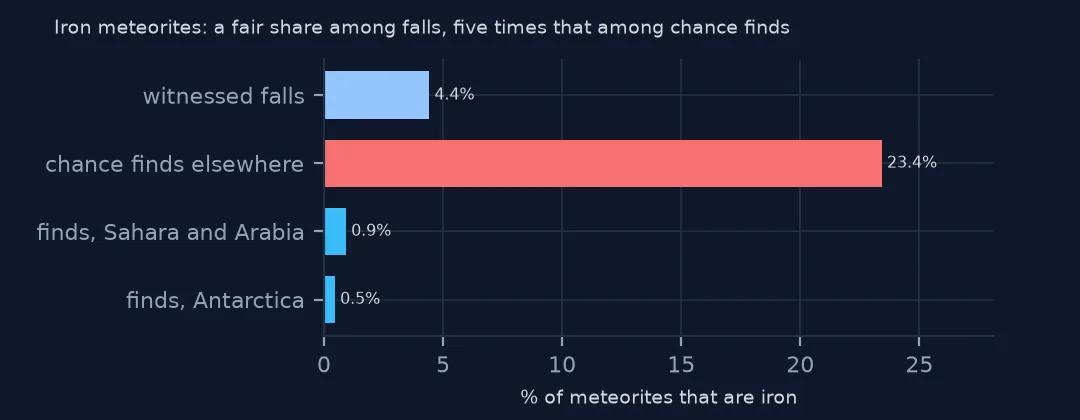
falls 0.044 0.946 0.010
finds Antarctica 0.005 0.993 0.002
finds Sahara and Arabia 0.009 0.979 0.011
finds elsewhere 0.234 0.743 0.022
finds no position 0.023 0.959 0.017
Falls are the nearest thing to a fair sample of what arrives, because a witnessed fall is collected whatever it looks like: 94.6% are stony and 4.4% iron. Finds outside the ice and the deserts are 23.4% iron. An iron meteorite is heavy, magnetic and rusts slowly, so a farmer notices it and it survives centuries in wet soil, while a stony one weathers into something that looks like any other rock. On Antarctic ice, where every dark stone is picked up, irons fall back to 0.5%.
Falls over the centuries
The data used on this page
NASA's Meteorite Landings table from The Meteoritical Society's records, last updated by NASA on 14 May 2013, saved on this site on 28 October 2026 with the fireball data. Regions are drawn from the median position of each place name's located meteorites, so a find without coordinates still counts where its namesakes are.
from pathlib import Path
import json
import zipfile

import geopandas as gpd
import numpy as np
import pandas as pd
import requests

Path("data").mkdir(exist_ok=True)
# NASA's Meteorite Landings table (The Meteoritical Society's records as NASA last updated them, May 2013), every
# fireball in NASA/JPL's Fireball Data API, and Natural Earth's countries and land. Saved 28 October 2026.
# Live: https://data.nasa.gov/docs/legacy/meteorite_landings/Meteorite_Landings.csv
#       https://ssd-api.jpl.nasa.gov/fireball.api?vel-comp=true
ARCHIVE = "nasa-meteorites-2026-10-28.zip"
if not Path(f"data/{ARCHIVE}").exists():
    Path(f"data/{ARCHIVE}").write_bytes(requests.get(f"https://data.spatialworkflow.io/{ARCHIVE}", timeout=600).content)
Z = zipfile.ZipFile(f"data/{ARCHIVE}")
met = pd.read_csv(Z.open("Meteorite_Landings.csv")).rename(columns={"mass (g)": "mass_g"})
for f in ["ne_110m_admin_0_countries.zip", "ne_50m_land.zip"]:
    Path(f"data/{f}").write_bytes(Z.read(f))
print(f"Meteorite Landings: {len(met):,} meteorites")
Meteorite Landings: 45,716 meteorites
Example 1: the falls since 1900
print(fell[fell.year >= 1900].groupby(fell.year // 25 * 25).size().rename("falls").to_string())year
1900.0 157
1925.0 184
1950.0 151
1975.0 143
2000.0 72
Witnessed falls run at 143 to 184 per quarter century from 1900 to 1999, about six or seven a year, and 72 in the 14 years from 2000 to 2013. The rate is set by people, not by the sky: far more meteorites land than are ever seen, and only a few a year are both seen and recovered. Camera networks that triangulate a fireball's path have since led to more recoveries, but this table ends before that shows.
Getting the meteorite data without code
- Look first: NASA's Meteorite Landings page describes the table and links the files. Opened in a spreadsheet, the CSV has one row per meteorite: name, id, valid or relict, class, mass in grams, fell or found, year, latitude and longitude.
- Download: the same page offers it as CSV, JSON, XML and RDF. The CSV, about 4 MB, opens in Excel or LibreOffice, and QGIS can load it as points by choosing
reclongandreclatas the X and Y fields. Filter out the rows at 0,0 first. - How current it is: NASA last updated the table on 14 May 2013, so it holds no meteorite approved since then. The Meteoritical Society's own Meteoritical Bulletin Database is the live record, searchable by name, class, country and year, and it includes every meteorite approved since NASA's copy was made.
- The copy these pages use: downloaded on 28 October 2026 and saved at data.spatialworkflow.io, together with NASA/JPL's fireball reports and Natural Earth's country outlines.
- Credit: The Meteoritical Society, via NASA's open data portal, with the date you downloaded it. NASA's page does not state a licence; credit the Society as the source.
Internal links
- Reading the table — every column and its traps
- Where meteorites were found — the map, by country and per area
- Witnessed falls by country — the falls on their own, against population
- Meteorite classes — stony, iron and stony-iron from 466 labels