
Fixing Meteorite Maps Where Thousands of Finds Share One Point
On this page
Problem statement
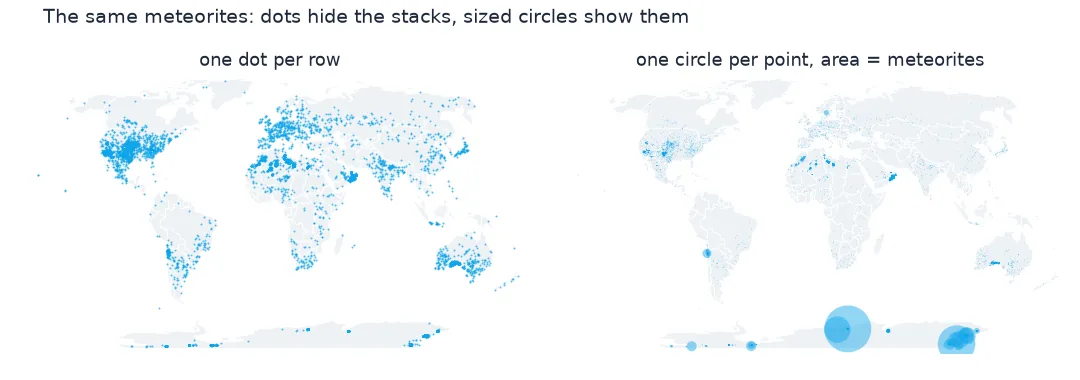
A dot map of NASA's Meteorite Landings table shows Antarctica as a scatter of a few hundred dots, when the table holds 22,099 Antarctic meteorites with positions. The dots are there, but they are on top of each other. Antarctic finds are usually recorded with the position of their collecting area, not of the stone, so 4,761 Yamato meteorites share one coordinate pair and 3,040 from Queen Alexandra Range another. Any map that draws one dot per row understates those places by a factor of thousands. This page measures the stacking, finds what each stack is, and draws counts instead of dots.
Quick answer
Count meteorites per distinct coordinate pair and draw the counts:
ok = met.reclat.notna() & ~((met.reclat == 0) | (met.reclong == 0)) & met.reclong.between(-180, 180)
pts = met[ok].groupby(["reclat", "reclong"]).size().rename("n").reset_index()
print(f"meteorites with a position: {ok.sum():,}; distinct positions: {len(pts):,}")
print(pts.nlargest(6, "n").to_string(index=False))
meteorites with a position: 31,962; distinct positions: 17,096
reclat reclong n
-71.50000 35.66667 4761
-84.00000 168.00000 3040
-72.00000 26.00000 1505
-79.68333 159.75000 657
-76.71667 159.66667 637
-76.18333 157.16667 539
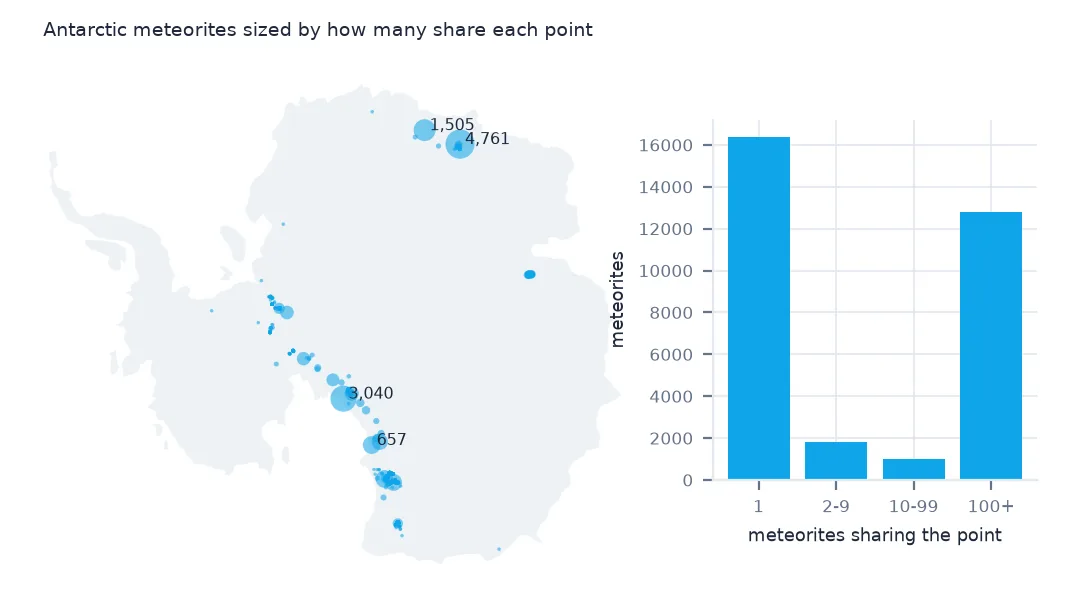
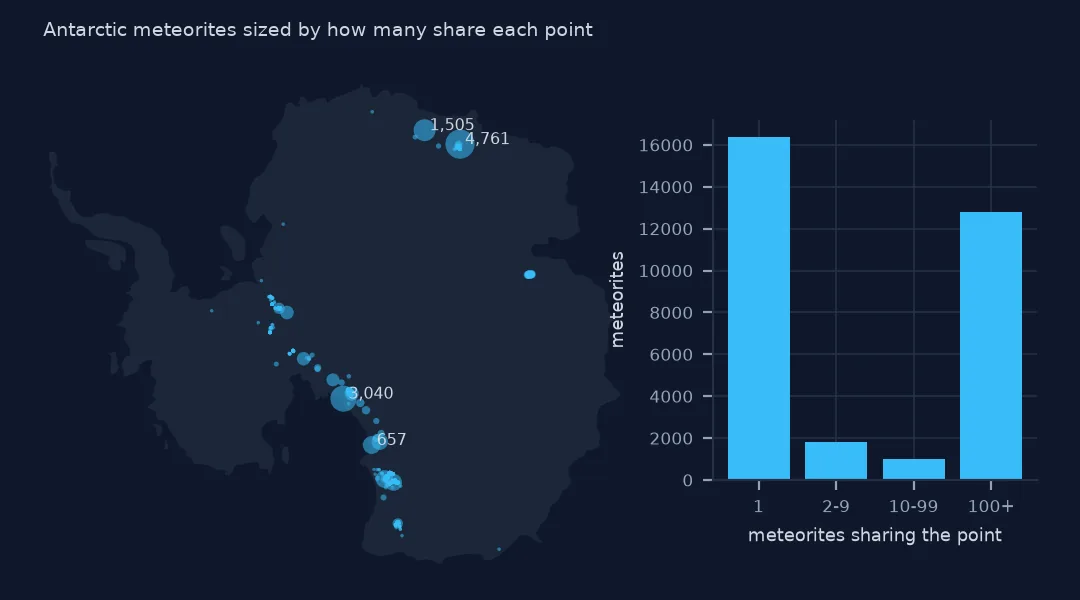
The 31,962 meteorites with a valid position sit on only 17,096 distinct points. The largest stack, at 71.5° S, 35.67° E, holds 4,761 meteorites, and the next, at 84° S, 168° E, 3,040. The six largest stacks are all in Antarctica, and together they hold over a third of all positioned meteorites.
How much stacking, and where
1. How many share
print(pd.cut(pts.n, [0, 1, 9, 99, 10_000], labels=["alone", "2-9", "10-99", "100+"]).value_counts(sort=False).to_string())
print(pts.groupby(pd.cut(pts.n, [0, 1, 9, 99, 10_000], labels=["alone", "2-9", "10-99", "100+"]), observed=True).n.sum().to_string())
n
alone 16371
2-9 668
10-99 44
100+ 13
n
alone 16371
2-9 1822
10-99 983
100+ 12786
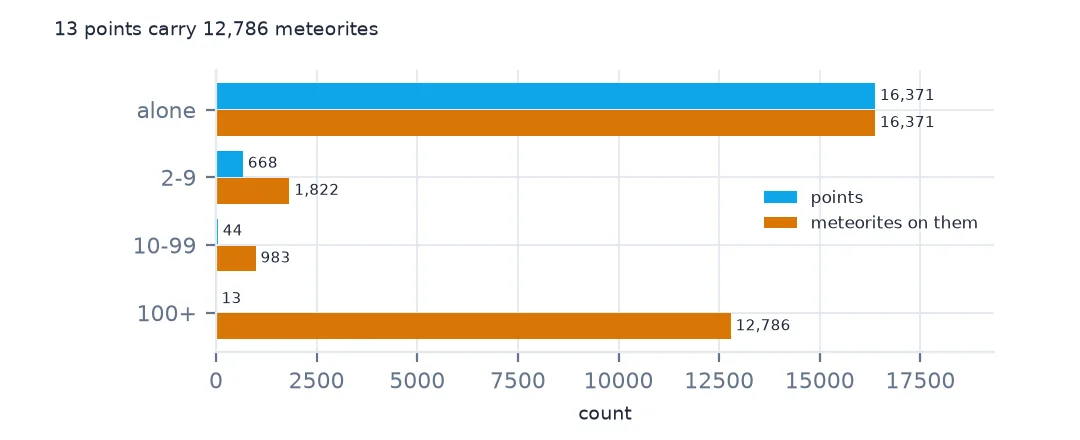
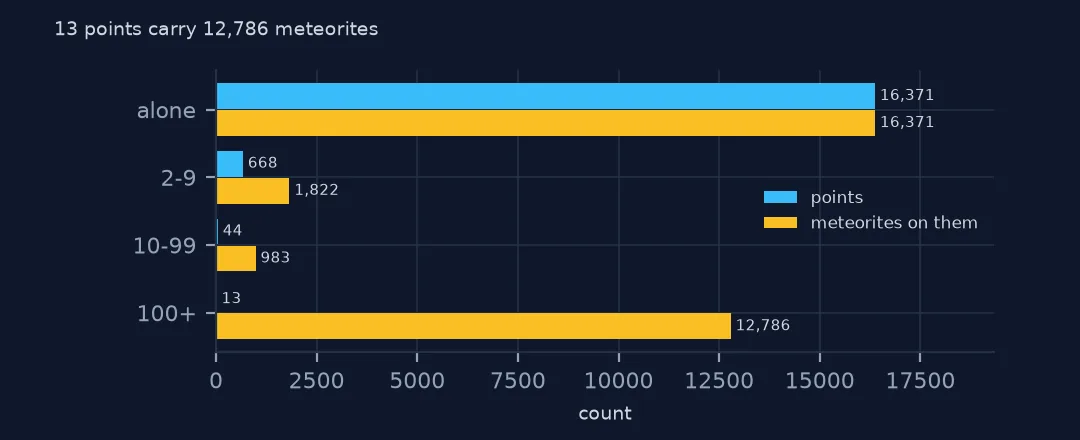
16,371 points hold a single meteorite and 668 hold two to nine. Only 13 points hold 100 or more, but those 13 carry 12,786 meteorites, two fifths of the positioned table, against 16,371 at all the single points. A dot map gives the 13 stacks as much ink as 13 single finds.
2. What the shared points are
met["place"] = met.name.str.replace(r"\s*[A-Z]?\d+.*$", "", regex=True)
big = pts[pts.n >= 100].merge(met[ok], on=["reclat", "reclong"])
print(big.groupby(["reclat", "reclong"]).agg(n=("id", "size"), places=("place", lambda s: ", ".join(s.value_counts().index[:2])), years=("year", lambda s: f"{s.min():.0f}-{s.max():.0f}")).sort_values("n", ascending=False).head(6).to_string())
n places years
reclat reclong
-71.50000 35.66667 4761 Yamato 1969-2000
-84.00000 168.00000 3040 Queen Alexandra Range 1993-2002
-72.00000 26.00000 1505 Asuka 1987-1990
-79.68333 159.75000 657 Meteorite Hills 1996-2001
-76.71667 159.66667 637 Allan Hills 1976-1999
-76.18333 157.16667 539 Elephant Moraine 1982-1999
Each large stack is one collecting area across many seasons: Yamato from 1969 to 2000, Queen Alexandra Range from 1993 to 2002, Asuka from 1987 to 1990, then Meteorite Hills, Allan Hills and Elephant Moraine, the American fields of the Transantarctic Mountains. The stones were recovered over ice fields tens of kilometres across, and field teams often record each stone's own position, but the table carries one point per area. The coordinates mean "this ice field", not "this stone".
3. How precise the coordinates are
frac = (met[ok].reclat.abs() * 60) % 1
print(f"latitudes on a whole minute of arc: {((frac < 1e-3) | (frac > 1 - 1e-3)).mean():.1%}")
print(f"latitudes on a whole degree: {(met[ok].reclat % 1 == 0).mean():.1%}")
latitudes on a whole minute of arc: 53.2%
latitudes on a whole degree: 14.7%
The precision problem is not limited to Antarctica. 53.2% of the latitudes fall on a whole minute of arc, the precision of a coordinate written as degrees and minutes, and 14.7% on a whole degree, which places a meteorite only within about 100 km. Many old falls were located from the name of the nearest village. Read the decimals as a precision label: five decimal places in this column rarely mean metres.
Drawing counts instead of dots
The data used on this page
NASA's Meteorite Landings table from The Meteoritical Society's records (last updated May 2013), saved on this site on 28 October 2026. Rows with either coordinate at 0 are dropped, as on the 0,0 page, so the Yamato rows that lost their latitude are not counted twice.
from pathlib import Path
import json
import zipfile

import geopandas as gpd
import numpy as np
import pandas as pd
import requests

Path("data").mkdir(exist_ok=True)
# NASA's Meteorite Landings table (The Meteoritical Society's records as NASA last updated them, May 2013), every
# fireball in NASA/JPL's Fireball Data API, and Natural Earth's countries and land. Saved 28 October 2026.
# Live: https://data.nasa.gov/docs/legacy/meteorite_landings/Meteorite_Landings.csv
#       https://ssd-api.jpl.nasa.gov/fireball.api?vel-comp=true
ARCHIVE = "nasa-meteorites-2026-10-28.zip"
if not Path(f"data/{ARCHIVE}").exists():
    Path(f"data/{ARCHIVE}").write_bytes(requests.get(f"https://data.spatialworkflow.io/{ARCHIVE}", timeout=600).content)
Z = zipfile.ZipFile(f"data/{ARCHIVE}")
met = pd.read_csv(Z.open("Meteorite_Landings.csv")).rename(columns={"mass (g)": "mass_g"})
for f in ["ne_110m_admin_0_countries.zip", "ne_50m_land.zip"]:
    Path(f"data/{f}").write_bytes(Z.read(f))
print(f"Meteorite Landings: {len(met):,} meteorites")
Meteorite Landings: 45,716 meteorites
Example 1: draw counts, not dots
g = gpd.GeoDataFrame(pts, geometry=gpd.points_from_xy(pts.reclong, pts.reclat), crs=4326)
g["size"] = np.sqrt(g.n) * 2
print(f"marker area ratio between the biggest stack and a single find: {g.n.max()}:1")
ant = g[g.reclat < -60]
print(f"Antarctica: {ant.n.sum():,} meteorites at {len(ant):,} points; elsewhere: {g[g.reclat >= -60].n.sum():,} at {(g.reclat >= -60).sum():,}")
marker area ratio between the biggest stack and a single find: 4761:1
Antarctica: 22,099 meteorites at 8,035 points; elsewhere: 9,863 at 9,061
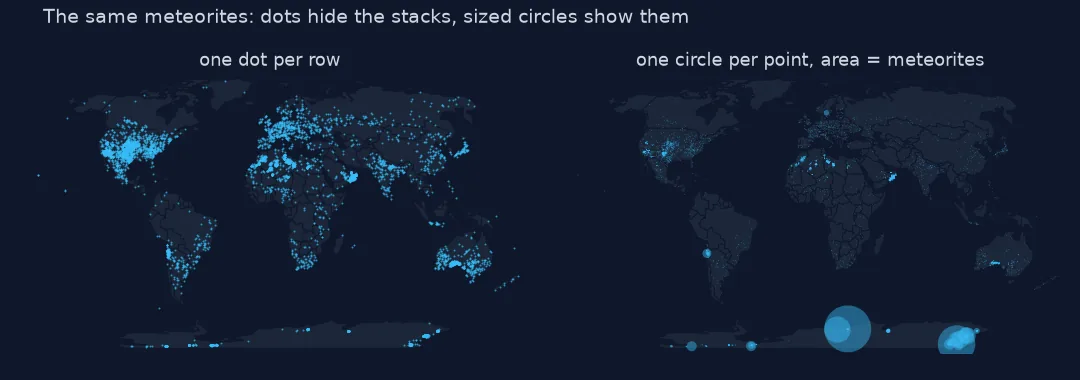
Sizing each point by its count, with the marker's area proportional to the number of meteorites (so the radius goes with the square root), gives the Yamato stack 4,761 times the area of a single find. Antarctica then shows its real weight: 22,099 meteorites at 8,035 points, against 9,863 elsewhere at 9,061 points. Jittering the stacked points would only spread a false precision across the ice; a sized marker or a count per grid cell says what is known.
Internal links
- Meteorites at 0,0 — the positions that are missing, not shared
- Where meteorites were found — the density map in equal-area cells
- Falls and finds explained — why the Antarctic fields hold so many