
How to Read NASA's Fireball and Bolide Reports in Python
On this page
Problem statement
When a small asteroid, a metre or a few metres across, hits the atmosphere and explodes as a bright fireball, US government sensors in orbit usually see it. NASA's Center for Near Earth Object Studies (CNEOS) at JPL publishes those detections through its Fireball Data API: 1,074 events from 1988 to October 2026, each with a time, the energy it radiated, an estimated impact energy, and, when known, the position, altitude and speed at peak brightness. The API returns numbers as strings, positions as unsigned values with N/S and E/W letters, and many blanks. This page turns it into a usable table and shows what it covers.
Quick answer
Convert the string columns to numbers and apply the direction letters as signs:
num = ["energy", "impact-e", "lat", "lon", "alt", "vel", "vx", "vy", "vz"]
fb[num] = fb[num].apply(pd.to_numeric)
fb["date"] = pd.to_datetime(fb.date)
fb["lat"] = fb.lat.where(fb["lat-dir"] == "N", -fb.lat)
fb["lon"] = fb.lon.where(fb["lon-dir"] == "E", -fb.lon)
print(fb[["date", "energy", "impact-e", "lat", "lon", "alt", "vel"]].head(4).to_string(index=False))
date energy impact-e lat lon alt vel
2026-10-04 03:14:45 5.4 0.180 -41.8 -173.1 26.9 13.8
2026-09-15 11:26:13 2.2 0.079 -37.6 -161.6 37.0 NaN
2026-09-11 10:18:03 6.1 0.200 -0.2 -129.6 70.0 NaN
2026-09-11 01:12:11 24.6 0.670 54.4 -100.1 38.0 20.7
The rows come newest first. The latest, on 4 October 2026, exploded at 26.9 km over the Pacific east of New Zealand at 13.8 km/s, with 0.18 kilotons of impact energy. Without the signs it would plot in the North Pacific east of Japan. energy is the light radiated, in units of 10¹⁰ joules, and impact-e the estimated total energy in kilotons of TNT.
What the columns hold
1. What each column holds
print(fb[num].notna().sum().to_string())
print(f"from {fb.date.min():%Y-%m-%d} to {fb.date.max():%Y-%m-%d}")
energy 1074
impact-e 1074
lat 888
lon 888
alt 602
vel 363
vx 363
vy 363
vz 363
from 1988-04-15 to 2026-10-04
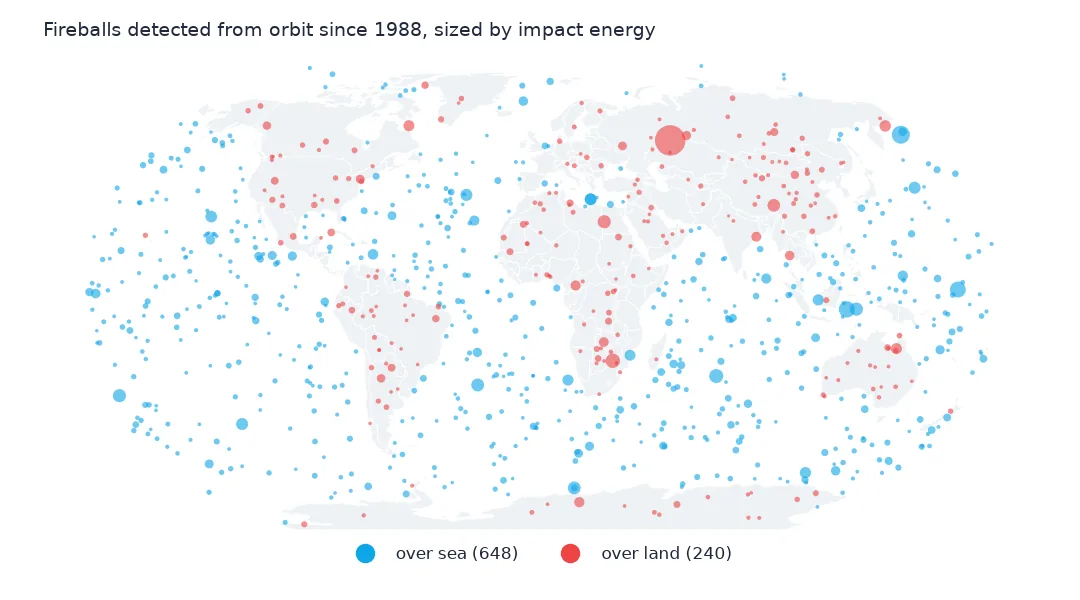
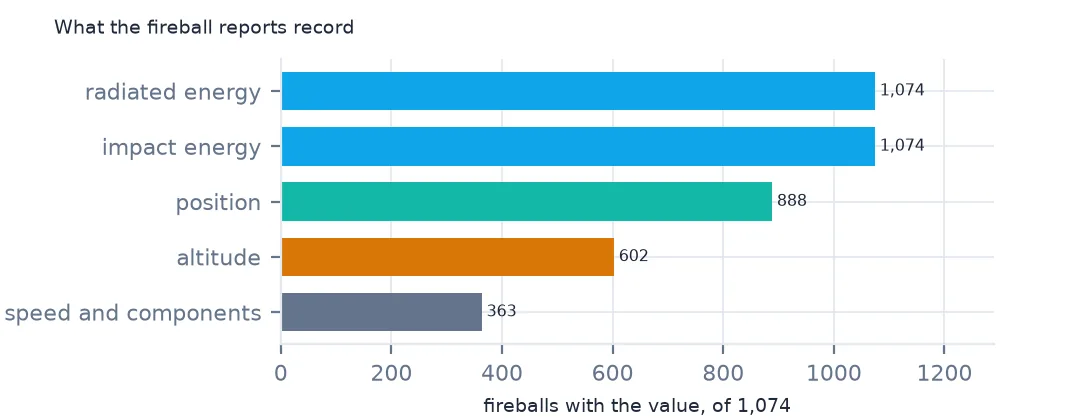
Every event has both energies, because they are what the sensors measure. The position is known for 888, the altitude of peak brightness for 602, and the speed with its three components for only 363. The table starts with a single event in April 1988 and runs to 4 October 2026. A map can use 888 events, a study of entry speeds a third of the table.
2. Over land or sea
land = gpd.read_file("data/ne_50m_land.zip")
pts = gpd.GeoDataFrame(fb.dropna(subset=["lat"]), geometry=gpd.points_from_xy(fb.dropna(subset=["lat"]).lon, fb.dropna(subset=["lat"]).lat), crs=4326)
pts["over_land"] = pts.within(land.union_all())
print(f"located: {len(pts):,}; over land: {pts.over_land.sum()} ({pts.over_land.mean():.1%})")
located: 888; over land: 240 (27.0%)
240 of the 888 located fireballs, 27.0%, exploded over land, close to the share of the Earth's surface that is land. That is what arrivals spread evenly over the globe would produce, and it is why so few of these events are witnessed or yield meteorites: most end over open ocean.
3. Velocity and its components
v = fb.dropna(subset=["vx"])
mag = np.sqrt(v.vx**2 + v.vy**2 + v.vz**2)
print(f"with components: {len(v)}; |v| - vel: median {(mag - v.vel).median():.3f} km/s, worst {(mag - v.vel).abs().max():.1f}")
print(v.assign(norm=mag.round(1)).loc[(mag - v.vel).abs() > 1, ["date", "vel", "norm", "vx", "vy", "vz"]].to_string(index=False))
with components: 363; |v| - vel: median 0.002 km/s, worst 18.4
date vel norm vx vy vz
2026-10-04 03:14:45 13.8 15.2 14.8 2.9 2.2
2026-08-14 07:48:36 12.2 22.9 5.2 22.3 0.2
2023-06-21 19:39:12 16.5 18.1 7.3 -2.0 -16.4
2018-12-18 23:48:18 13.6 32.0 6.3 -3.0 -31.2
2014-08-23 06:29:41 16.2 17.6 -2.3 5.7 16.5
2014-06-28 02:40:05 12.4 16.3 12.0 3.5 -10.5
2009-10-08 02:57:14 19.2 22.1 14.0 -16.0 -6.0
The speed vel should be the length of the vector (vx, vy, vz), given in an Earth-centred frame, and for most of the 363 events it is, to a few metres per second. Seven are not, and in all seven the components give the higher speed. The 2018 Bering Sea fireball is listed at 13.6 km/s, but its components make 32.0 km/s; the newest event's make 15.2 km/s against 13.8. The table does not say which is right, so a speed study should flag these rows rather than trust either value.
Reports over time and the largest events
The data used on this page
NASA/JPL's Fireball Data API from the Center for Near Earth Object Studies, every record with velocity components (vel-comp=true), downloaded on 28 October 2026 and saved on this site, because new events are added as they are reported. Natural Earth's 1:50m land, public domain, decides over land or sea.
from pathlib import Path
import json
import zipfile

import geopandas as gpd
import numpy as np
import pandas as pd
import requests

Path("data").mkdir(exist_ok=True)
# Every fireball in NASA/JPL's Fireball Data API (CNEOS), with NASA's Meteorite Landings table and Natural Earth's
# countries and land. Saved 28 October 2026: new fireballs are added as they are reported.
# Live: https://ssd-api.jpl.nasa.gov/fireball.api?vel-comp=true
ARCHIVE = "nasa-meteorites-2026-10-28.zip"
if not Path(f"data/{ARCHIVE}").exists():
    Path(f"data/{ARCHIVE}").write_bytes(requests.get(f"https://data.spatialworkflow.io/{ARCHIVE}", timeout=600).content)
Z = zipfile.ZipFile(f"data/{ARCHIVE}")
raw = json.loads(Z.read("fireball.json"))
fb = pd.DataFrame(raw["data"], columns=raw["fields"])
for f in ["ne_110m_admin_0_countries.zip", "ne_50m_land.zip"]:
    Path(f"data/{f}").write_bytes(Z.read(f))
print(f"{raw['signature']['source']}: {len(fb):,} fireballs")
NASA/JPL Fireball Data API: 1,074 fireballs
Example 1: reports per year
per = fb.groupby(fb.date.dt.year).size()
print(per.loc[1994:2025].describe().round(1).loc[["mean", "min", "max"]].to_string())
print(per.loc[[1994, 1995, 1996, 2005, 2015, 2019, 2022, 2025]].to_string())
mean 32.7
min 13.0
max 45.0
date
1994 13
1995 21
1996 33
2005 45
2015 45
2019 42
2022 42
2025 33
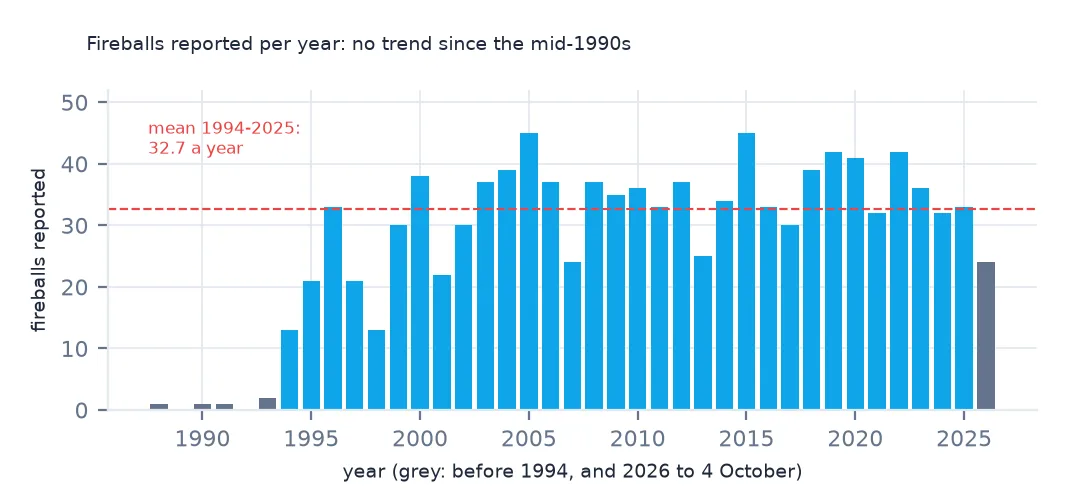
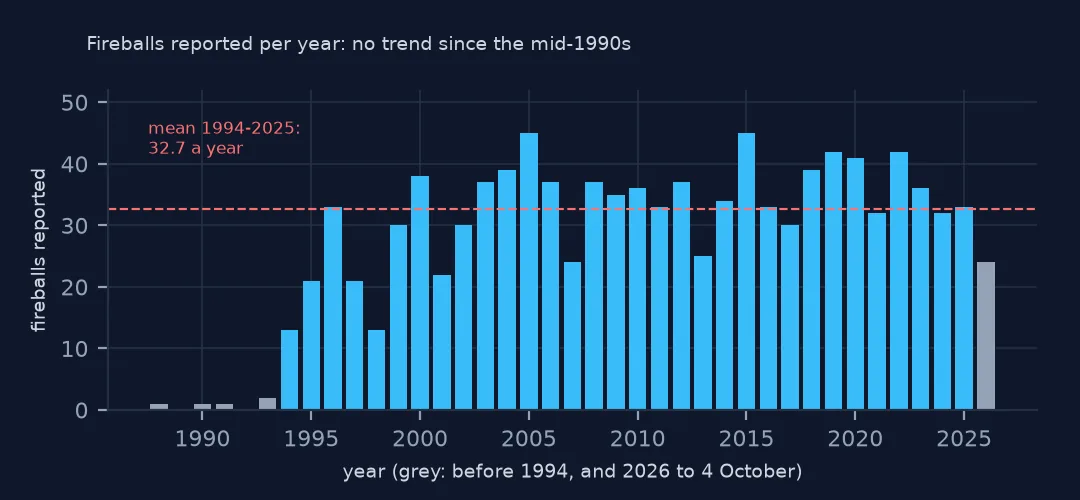
From 1994 on, reports run at a mean of 32.7 a year, from 13 in 1994 to 45 in 2005 and 2015. Before 1994 there are only five events in six years, which reflects what was released rather than what arrived. The count has no trend since the mid-1990s, which fits a steady rate of arrivals seen by sensors of roughly constant sensitivity. The series is a record of detections above a threshold, and small events are still missed.
Example 2: the largest
print(fb.nlargest(5, "impact-e")[["date", "impact-e", "lat", "lon", "alt", "vel"]].to_string(index=False)) date impact-e lat lon alt vel
2013-02-15 03:20:26 441.0 54.8 61.1 23.3 18.6
2018-12-18 23:48:18 49.0 56.9 172.4 26.0 13.6
2009-10-08 02:57:14 33.0 -4.2 120.6 19.1 19.2
1994-02-01 22:38:09 30.0 2.7 164.1 NaN NaN
2009-11-21 20:53:29 20.0 -22.0 29.2 38.0 32.1
The largest event by far is Chelyabinsk, on 15 February 2013, at 441 kilotons: it exploded 23.3 km above the Russian city at 18.6 km/s, and its shock wave injured more than a thousand people. Next come the Bering Sea fireball of December 2018 at 49 kt, over the sea off Kamchatka, and an event over Indonesia's Bone Gulf in October 2009 at 33 kt. The 1994 event over the western Pacific, at 30 kt, has no altitude or speed.
Internal links
- Fireball energy explained — radiated energy, impact energy and how often each size arrives
- Witnessed meteorite falls — the falls people saw and picked up
- Reading NASA's Meteorite Landings — the meteorites themselves