
Average Flight Delay Comes Out Negative or Tiny: Choosing the Right Delay Measure
On this page
Problem statement
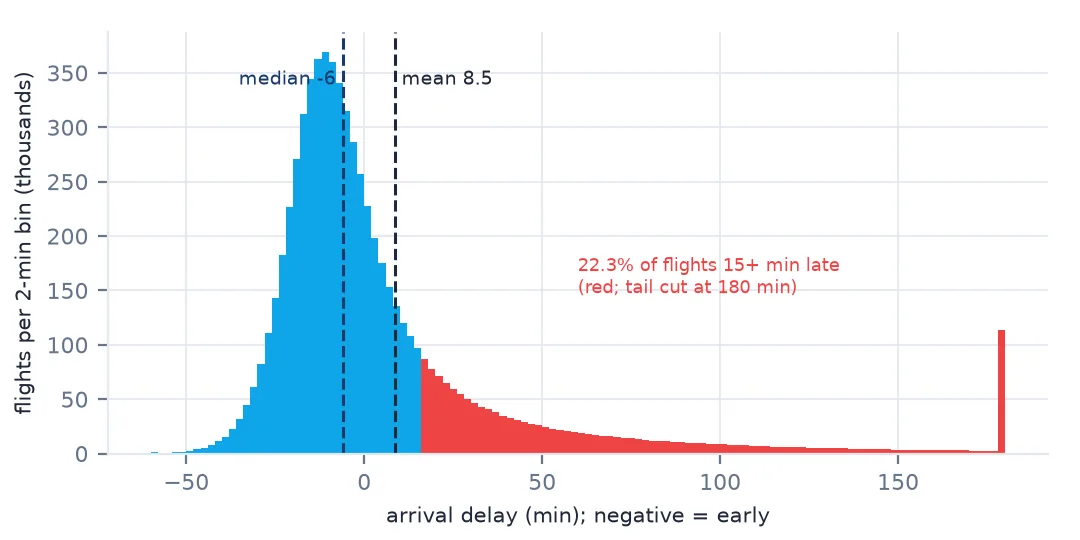
Compute the average arrival delay of US flights in 2025 and you get 8.5 minutes; take the median and you get minus six. Neither matches anyone's experience of flying, and both are correct. Arrival delay is negative for early flights, most flights are early, and a small share are very late, so the mean, the median and the on-time percentage each describe a different part of a skewed distribution — and rank airlines differently.
This page works through the measures on the 2025 BTS on-time file: why most flights arrive early, what each measure says and hides, how cancellations make bad days look good, and which numbers to report instead of one average.
Quick answer
Report the share of flights 15 or more minutes late, and, separately, how late those flights were. Compare the candidates side by side:
flown = flights[(flights.Cancelled == 0) & (flights.Diverted == 0)]
d = flown.ArrDelay
measures = {"mean ArrDelay": d.mean(), "median ArrDelay": d.median(), "mean, early counted as 0": d.clip(lower=0).mean(),
            "mean of late flights only (15+)": d[d >= 15].mean(), "share 15+ min late": (d >= 15).mean() * 100}
for k, v in measures.items():
    print(f"{k:32s} {v:6.1f}")
mean ArrDelay 8.5
median ArrDelay -6.0
mean, early counted as 0 17.3
mean of late flights only (15+) 72.9
share 15+ min late 22.3
The same 6.9 million flights give a mean delay of 8.5 minutes, a median of −6, a mean of 17.3 if early arrivals are counted as zero, and 72.9 minutes among the 22.3% of flights that arrived 15 or more minutes late. The last two numbers together describe the year: about one flight in five was late, and a late flight was typically more than an hour late.
Early flights, padding and rankings
1. Most flights arrive early
print(pd.cut(d, [-200, -30, -15, -1, 0, 14, 60, 180, 5000]).value_counts(sort=False, normalize=True).mul(100).round(1).to_string())ArrDelay
(-200, -30] 3.6
(-30, -15] 23.8
(-15, -1] 33.3
(-1, 0] 1.7
(0, 14] 15.3
(14, 60] 14.3
(60, 180] 6.4
(180, 5000] 1.6
Three flights in five arrive early; 23.8% of all flights arrive 15 to 30 minutes early. 1.6% arrive more than three hours late. A distribution like this has a mean pulled upwards by the long right tail and a median sitting among the early arrivals, so the two can even have opposite signs.
2. Early arrivals are built into the schedule
pad = flown.CRSElapsedTime - flown.ActualElapsedTime
print(f"scheduled minus actual gate-to-gate time: median {pad.median():.0f} min; flights faster than scheduled {(pad > 0).mean():.1%}")
print(f"median departure delay {flown.DepDelay.median():.0f}, median arrival delay {d.median():.0f}")
scheduled minus actual gate-to-gate time: median 7 min; flights faster than scheduled 71.4%
median departure delay -2, median arrival delay -6
Early arrival is designed in. The scheduled gate-to-gate time is longer than the actual one for 71.4% of flights, by a median of 7 minutes, and flights that leave the gate a median 2 minutes early arrive a median 6 minutes early. Whatever the reason for it, padding makes "average delay" partly a measure of scheduling.
3. Each measure answers a different question
airline = flown.groupby("Reporting_Airline").ArrDelay.agg(
    mean="mean", median="median", late_share=lambda x: (x >= 15).mean(), late_mean=lambda x: x[x >= 15].mean())
ranks = airline.rank()
print(airline.round(2).sort_values("late_share").to_string())
print("rank correlation (Spearman) between measures:")
print(ranks.corr(method="spearman").round(2).to_string())
mean median late_share late_mean
Reporting_Airline
HA 6.78 0.0 0.17 53.00
DL 5.69 -8.0 0.20 73.28
MQ 6.24 -5.0 0.21 63.29
NK 6.60 -8.0 0.21 74.37
WN 6.05 -5.0 0.21 56.98
UA 7.31 -6.0 0.21 72.54
OO 9.15 -7.0 0.21 83.81
YX 6.39 -8.0 0.22 71.86
AS 4.80 -4.0 0.23 51.37
G4 13.01 -6.0 0.25 85.39
AA 13.69 -5.0 0.26 83.30
B6 10.95 -6.0 0.26 76.14
F9 14.84 -5.0 0.28 84.41
OH 17.32 -5.0 0.28 91.06
rank correlation (Spearman) between measures:
mean median late_share late_mean
mean 1.00 0.09 0.65 0.84
median 0.09 1.00 0.14 -0.29
late_share 0.65 0.14 1.00 0.57
late_mean 0.84 -0.29 0.57 1.00
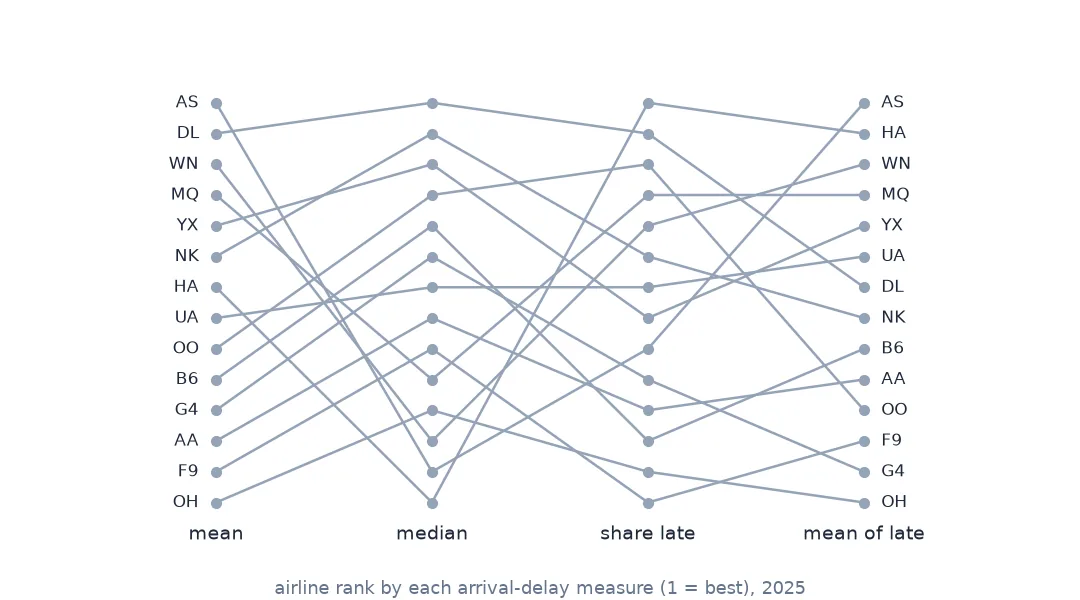
The rankings disagree. Delta has a median delay of −8 minutes and a mean of 5.69; PSA (OH) a median of −5 and a mean of 17.32. The Spearman correlation between airline rankings by mean and by median is 0.09 — essentially unrelated — and between the median and the mean delay of late flights it is negative. The share of late flights and the mean agree more (0.65), because both are driven by the tail.
4. Cancellations flatter the average
day = flights.groupby("FlightDate").agg(cancelled=("Cancelled", "mean"))
day["mean_delay"] = flown.groupby("FlightDate").ArrDelay.mean()
day["late_share"] = flown.groupby("FlightDate").ArrDelay.apply(lambda x: (x >= 15).mean())
worst = day.nlargest(5, "cancelled")
print(worst.round(3).to_string())
print(f"median day: cancelled {day.cancelled.median():.3f}, mean delay {day.mean_delay.median():.1f}")
cancelled mean_delay late_share
FlightDate
2025-01-10 0.160 22.753 0.294
2025-11-09 0.121 39.720 0.451
2025-01-09 0.107 10.153 0.241
2025-01-21 0.102 7.857 0.213
2025-01-06 0.100 29.040 0.402
median day: cancelled 0.007, mean delay 6.9
Cancelled flights have no delay, so they vanish from every delay measure. On 21 January 2025 a tenth of all flights were cancelled, yet the mean arrival delay of those that flew was 7.9 minutes, barely above a median day's 6.9. On the worst days, the delay statistics describe the flights that were lucky enough to fly.
Measures that hold up
The data used on this page
The Bureau of Transportation Statistics Reporting Carrier On-Time Performance files for 2025, and airport coordinates from OurAirports in a copy saved on 15 October 2026.
from pathlib import Path
import zipfile

import numpy as np
import pandas as pd
import requests

Path("data").mkdir(exist_ok=True)
BTS = "https://transtats.bts.gov/PREZIP/On_Time_Reporting_Carrier_On_Time_Performance_1987_present_2025_{}.zip"
COLS = ["FlightDate", "Reporting_Airline", "Tail_Number", "Flight_Number_Reporting_Airline", "Origin", "Dest",
        "CRSDepTime", "DepTime", "DepDelay", "TaxiOut", "WheelsOff", "WheelsOn", "TaxiIn", "CRSArrTime", "ArrTime",
        "ArrDelay", "Cancelled", "CancellationCode", "Diverted", "CRSElapsedTime", "ActualElapsedTime", "AirTime",
        "Distance", "CarrierDelay", "WeatherDelay", "NASDelay", "SecurityDelay", "LateAircraftDelay"]
TEXT = {c: str for c in ["CRSDepTime", "DepTime", "WheelsOff", "WheelsOn", "CRSArrTime", "ArrTime", "CancellationCode",
                         "Tail_Number"]}


def read_month(m):
    f = Path(f"data/On_Time_Reporting_Carrier_On_Time_Performance_1987_present_2025_{m}.zip")
    if not f.exists():
        f.write_bytes(requests.get(BTS.format(m), timeout=900).content)
    with zipfile.ZipFile(f) as z:
        name = next(n for n in z.namelist() if n.endswith(".csv"))
        return pd.read_csv(z.open(name), usecols=COLS, dtype=TEXT, parse_dates=["FlightDate"], low_memory=False)


flights = pd.concat([read_month(m) for m in range(1, 13)], ignore_index=True)

# OurAirports is edited daily; this is the copy of 15 October 2026
# (live: https://davidmegginson.github.io/ourairports-data/airports.csv).
AIRPORTS = "ourairports-airports-2026-10-15.csv"
if not Path(f"data/{AIRPORTS}").exists():
    Path(f"data/{AIRPORTS}").write_bytes(requests.get(f"https://data.spatialworkflow.io/{AIRPORTS}", timeout=300).content)
ap = pd.read_csv(f"data/{AIRPORTS}", usecols=["ident", "iata_code", "name", "latitude_deg", "longitude_deg"])
by_iata = ap.dropna(subset=["iata_code"]).drop_duplicates("iata_code").set_index("iata_code")
by_ident = ap.set_index("ident")
codes = pd.Index(sorted(set(flights.Origin) | set(flights.Dest)))
KEEP = ["name", "latitude_deg", "longitude_deg"]
airports = by_iata.reindex(codes)[KEEP]
gap = airports.latitude_deg.isna().values
airports.loc[gap, KEEP] = by_ident.reindex("K" + codes[gap])[KEEP].values      # fall back to the US ident, K + code
airports = airports.rename(columns={"latitude_deg": "lat", "longitude_deg": "lon"})
print(f"{len(flights):,} flights, {len(codes)} airports, {airports.lat.isna().sum()} without coordinates")
7,001,619 flights, 352 airports, 0 without coordinates
Example 1: a delay measure that counts cancellations
sched = flights.groupby("Reporting_Airline").agg(scheduled=("Cancelled", "size"), cancelled=("Cancelled", "mean"))
sched["on time of scheduled"] = flown.assign(ok=flown.ArrDelay < 15).groupby("Reporting_Airline").ok.sum() / sched.scheduled
sched["on time of flown"] = airline.late_share.rsub(1)
print(sched.sort_values("on time of scheduled").round(3).to_string())
scheduled cancelled on time of scheduled on time of flown
Reporting_Airline
OH 248735 0.046 0.690 0.725
F9 198065 0.018 0.707 0.721
B6 231413 0.017 0.723 0.738
AA 973653 0.018 0.727 0.743
G4 130899 0.005 0.745 0.750
AS 245588 0.012 0.758 0.769
YX 346036 0.033 0.758 0.785
MQ 299322 0.022 0.770 0.790
NK 194515 0.015 0.772 0.786
UA 795271 0.008 0.777 0.785
WN 1391885 0.008 0.778 0.786
OO 839821 0.014 0.779 0.793
DL 1026332 0.011 0.791 0.802
HA 80084 0.008 0.819 0.827
Counting a cancellation as not on time — the share of scheduled flights that arrived within 15 minutes — moves airlines with many cancellations down: PSA, with 4.6% of its flights cancelled, falls from 72.5% on time to 69.0%. Most airlines move by a point or less. For a passenger, this is the number that matters: the chance that a booked flight arrives on time.
Example 2: percentiles instead of one number
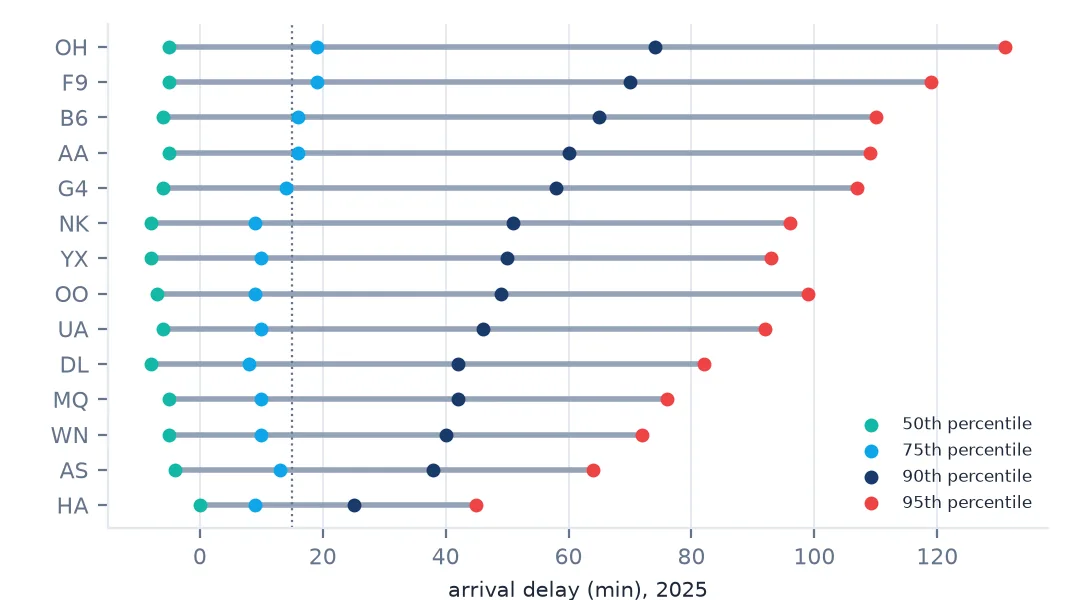
print(flown.groupby("Reporting_Airline").ArrDelay.quantile([0.5, 0.75, 0.9, 0.95]).unstack().round(0).astype(int)
      .sort_values(0.9).to_string())
0.50 0.75 0.90 0.95
Reporting_Airline
HA 0 9 25 45
AS -4 13 38 64
WN -5 10 40 72
MQ -5 10 42 76
DL -8 8 42 82
UA -6 10 46 92
OO -7 9 49 99
YX -8 10 50 93
NK -8 9 51 96
G4 -6 14 58 107
AA -5 16 60 109
B6 -6 16 65 110
F9 -5 19 70 119
OH -5 19 74 131
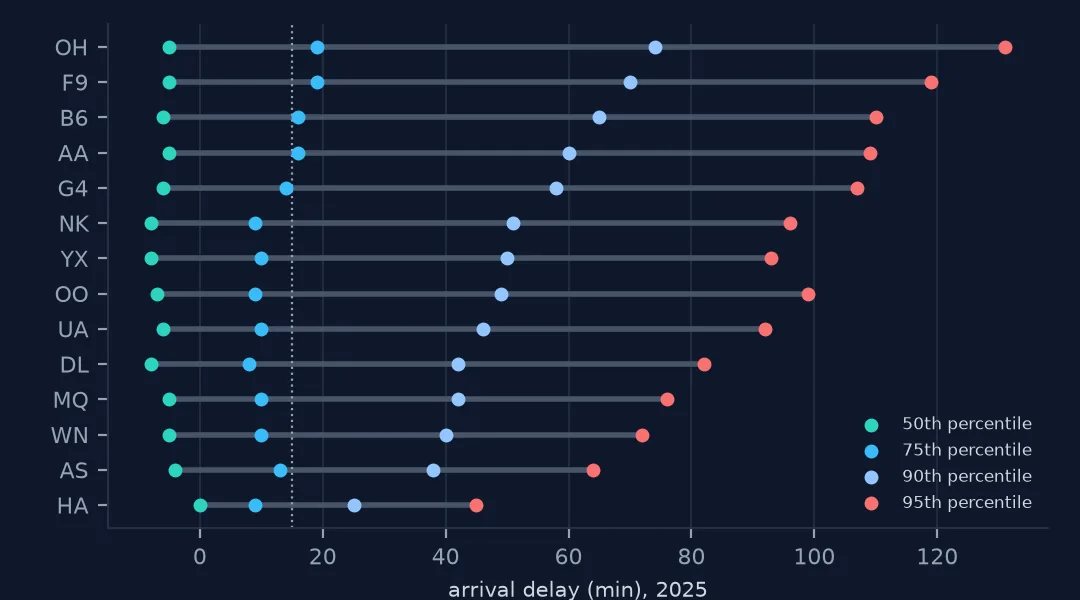
Percentiles show the whole shape at once. Every airline's median flight is early or on time; the differences are all in the tail. Hawaiian's 90th-percentile flight is 25 minutes late and its 95th 45; PSA's are 74 and 131. For planning a connection, the 90th or 95th percentile is the number to use.
One distribution, several summaries
Arrival delay is a signed quantity with a hard-to-describe shape: a hump of early arrivals, made by schedule padding, and a long tail of late ones, made by weather, congestion and propagation. A single summary can describe only one feature of that shape. The mean mixes early and late minutes, so an airline can improve it by padding schedules without becoming any more reliable. The median describes the typical flight, which is early for everyone. The on-time share describes the boundary at 15 minutes and nothing beyond it.
The answer is to report the measure that matches the question and to add the cancellations back. "How likely is my flight to be late?" — the share of scheduled flights arriving 15+ minutes late. "How bad is it when it is late?" — the mean or median delay of late flights. "How much buffer do I need?" — a high percentile. None of them is an average of all delays, which is the one number that answers no one's question.
Choosing a delay measure
- Negative delays are early flights, not errors. Do not drop them; decide whether to clip them.
- The mean and the median rank airlines differently. Their rank correlation was 0.09 in 2025.
- Cancellations disappear from delay measures. Count them against on-time performance.
- Schedule padding moves arrival delay, so departure and arrival delays differ for structural reasons.
- Report percentiles when the tail is the point.
Internal links
- How to map flight delays by airport — the measures on a map
- Flight delay causes explained — what the late flights were late for
- How to load and clean a year of US flight data — cancelled and diverted rows
FAQ
Why is the median flight delay negative?
Because most flights arrive early: airlines schedule more time than flights usually need. In 2025 the median US domestic flight arrived 6 minutes early, while the mean arrival delay was 8.5 minutes.
What is the best single measure of airline punctuality?
The share of scheduled flights (cancellations included) that arrived within 15 minutes of schedule; add how late the late flights were if one number is not enough.