
How to Load and Clean a Year of US Flight Data in Python
On this page
Problem statement
Every domestic flight flown by a large US airline is in the Bureau of Transportation Statistics' on-time file: 7,001,619 flights in 2025, with scheduled and actual times, delays and their causes, taxi times, the aircraft's tail number and whether the flight was cancelled or diverted. It is the dataset behind every airline league table and every "worst airport for delays" story, and it is free.
It also has a shape that trips people up. Each month is a 110-column CSV; times are four-character text in local time; a delayed flight's departure time can belong to the next day while its date does not change; cancelled and diverted flights have partial rows; and the delay-cause columns are empty for four flights in five. This page loads the full year, checks each of these, and builds a table with real timestamps that the rest of the cluster works from.
Quick answer
Load the twelve monthly files with only the columns you need, then count each kind of incomplete or awkward row before removing anything:
f = flights
checks = {
    "cancelled": f.Cancelled == 1,
    "diverted": f.Diverted == 1,
    "no tail number": f.Tail_Number.isna(),
    "a time written as 2400": (f.DepTime == "2400") | (f.ArrTime == "2400"),
    "delay causes filled in": f.CarrierDelay.notna(),
}
for name, mask in checks.items():
    print(f"{name:26s} {mask.sum():>10,}  {mask.mean():7.2%}")
flown = f[(f.Cancelled == 0) & (f.Diverted == 0)]
print(f"flights that took off and landed where planned: {len(flown):,}")
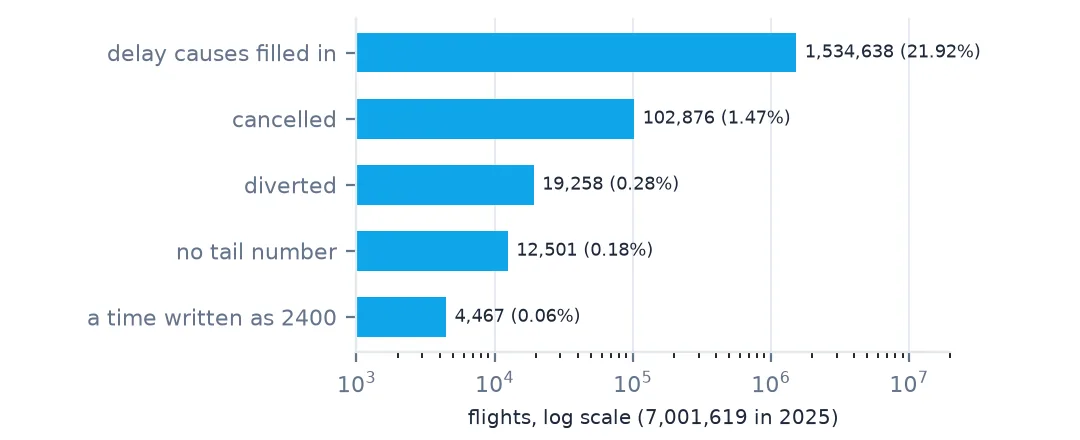
cancelled 102,876 1.47%
diverted 19,258 0.28%
no tail number 12,501 0.18%
a time written as 2400 4,467 0.06%
delay causes filled in 1,534,638 21.92%
flights that took off and landed where planned: 6,879,485
1.47% of flights were cancelled and 0.28% diverted; those rows lack the times and delays that a flown flight has, so most analyses start from the 6,879,485 that flew as planned. 4,467 times are written as 2400, which pandas will not parse as a time of day. The delay-cause columns are filled for only 21.92% of flights, by design: they are reported only when a flight arrives 15 minutes or more late.
Five things to check before analysing
1. Read only the columns you need
with zipfile.ZipFile("data/On_Time_Reporting_Carrier_On_Time_Performance_1987_present_2025_6.zip") as z:
    header = pd.read_csv(z.open(next(n for n in z.namelist() if n.endswith(".csv"))), nrows=0).columns
print(f"{len(header)} columns in the file; {len(COLS)} read; {flights.memory_usage(deep=True).sum() / 1e9:.1f} GB in memory")
print([c for c in header if c.startswith("Div")][:8], "...")
110 columns in the file; 28 read; 1.8 GB in memory
['Diverted', 'DivAirportLandings', 'DivReachedDest', 'DivActualElapsedTime', 'DivArrDelay', 'DivDistance', 'Div1Airport', 'Div1AirportID'] ...
Of the 110 columns, most describe up to five diversion airports, almost always empty. Reading 28 keeps the year to 1.8 GB in memory and the load to well under a minute.
2. Cancelled and diverted flights
codes_ = {"A": "carrier", "B": "weather", "C": "National Airspace System", "D": "security"}
print(f.loc[f.Cancelled == 1, "CancellationCode"].map(codes_).value_counts().to_string())
print("cancelled flights with a departure time:", f.loc[f.Cancelled == 1, "DepTime"].notna().sum())
print("diverted flights with an arrival delay:", f.loc[f.Diverted == 1, "ArrDelay"].notna().sum())
CancellationCode
weather 63404
carrier 21073
National Airspace System 18349
security 50
cancelled flights with a departure time: 4706
diverted flights with an arrival delay: 0
Weather causes most cancellations: 63,404 of 102,876. The file still holds a departure time for 4,706 cancelled flights — flights that left the gate before being cancelled — so filter on Cancelled, not on a missing time. Diverted flights never have an arrival delay, because they never arrived where scheduled.
3. Clock times stored as HHMM text
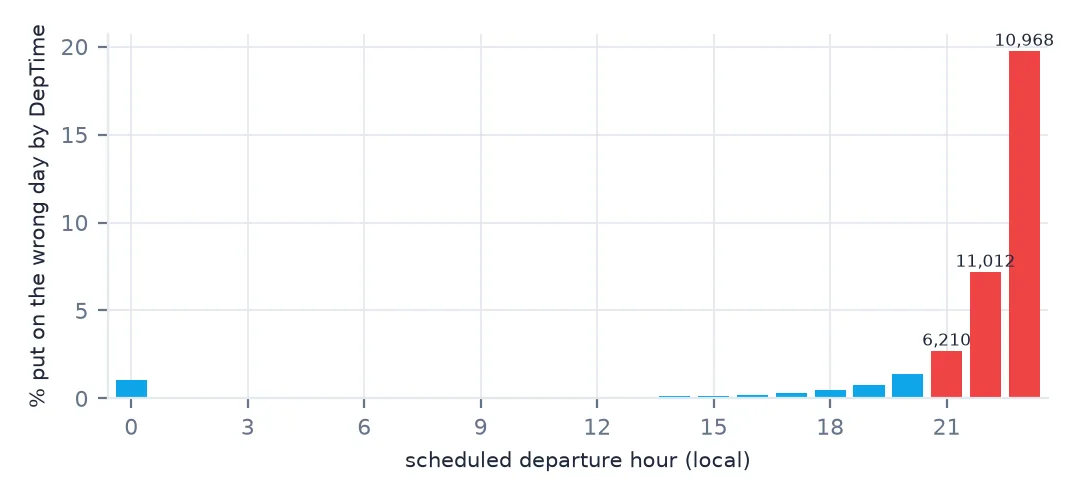
DepTime is the local clock time of departure as text, and FlightDate is the scheduled date. A flight scheduled for 23:50 that leaves at 00:06 keeps its date, so gluing the two together puts it a day early. The scheduled time plus DepDelay is always right:
def clock(date, hhmm):
    hhmm = hhmm.str.zfill(4)
    return date + pd.to_timedelta(hhmm.str[:2].astype(float) * 60 + hhmm.str[2:].astype(float), unit="min")


sched = clock(flown.FlightDate, flown.CRSDepTime)
actual = sched + pd.to_timedelta(flown.DepDelay, unit="min")
naive = clock(flown.FlightDate, flown.DepTime)
wrong = (naive - actual).abs() > pd.Timedelta("1min")
print(f"departure times read naively from DepTime that are a day off: {wrong.sum():,}")
print(flown.loc[wrong, ["FlightDate", "CRSDepTime", "DepTime", "DepDelay"]].head(3).to_string(index=False))
departure times read naively from DepTime that are a day off: 41,758
FlightDate CRSDepTime DepTime DepDelay
2025-01-17 1530 0045 555.0
2025-01-09 1150 1240 1490.0
2025-01-05 2350 0006 16.0
41,758 flights would be placed on the wrong day by the naive method — late-evening flights that left after midnight, and long delays such as a 15:30 departure that left at 00:45 the next morning, 555 minutes late. The same applies to arrivals, and across time zones it gets worse: flights that arrive before they depart covers that.
4. Attach airport coordinates
print(f"airports matched by IATA code: {(~gap).sum()}, by the K + code ident: {gap.sum()}")
print(airports.loc[gap, ["lat", "lon"]].to_string())
print(f"flights whose airports both have coordinates: {(flown.Origin.isin(airports.dropna().index) & flown.Dest.isin(airports.dropna().index)).mean():.2%}")
airports matched by IATA code: 351, by the K + code ident: 1
lat lon
PBI 26.683201 -80.095596
flights whose airports both have coordinates: 100.00%
351 of the 352 airports match on their IATA code. One, Palm Beach (PBI), has a different code in the OurAirports copy, and the US-style identifier KPBI finds it. With that fallback every flight has coordinates at both ends. OurAirports is edited by volunteers, which is why the setup reads a dated copy.
5. Look for duplicate flights
key = ["FlightDate", "Reporting_Airline", "Flight_Number_Reporting_Airline", "Origin"]
dup = f.duplicated(key, keep=False)
print(f"rows sharing date, airline, flight number and origin: {dup.sum()}")
rows sharing date, airline, flight number and origin: 0
A date, airline, flight number and origin identify a flight uniquely in this file: no duplicates. That combination, not Tail_Number, is the key for joins; 12,501 flights have no tail number at all.
A clean year, month by month
The data used on this page
The Bureau of Transportation Statistics Reporting Carrier On-Time Performance files for January to December 2025, one zip per month from the BTS PREZIP folder; they cover every domestic flight by the US carriers large enough to report. Airport coordinates come from OurAirports (public domain), in a copy saved on 15 October 2026.
from pathlib import Path
import zipfile

import numpy as np
import pandas as pd
import requests

Path("data").mkdir(exist_ok=True)
BTS = "https://transtats.bts.gov/PREZIP/On_Time_Reporting_Carrier_On_Time_Performance_1987_present_2025_{}.zip"
COLS = ["FlightDate", "Reporting_Airline", "Tail_Number", "Flight_Number_Reporting_Airline", "Origin", "Dest",
        "CRSDepTime", "DepTime", "DepDelay", "TaxiOut", "WheelsOff", "WheelsOn", "TaxiIn", "CRSArrTime", "ArrTime",
        "ArrDelay", "Cancelled", "CancellationCode", "Diverted", "CRSElapsedTime", "ActualElapsedTime", "AirTime",
        "Distance", "CarrierDelay", "WeatherDelay", "NASDelay", "SecurityDelay", "LateAircraftDelay"]
TEXT = {c: str for c in ["CRSDepTime", "DepTime", "WheelsOff", "WheelsOn", "CRSArrTime", "ArrTime", "CancellationCode",
                         "Tail_Number"]}


def read_month(m):
    f = Path(f"data/On_Time_Reporting_Carrier_On_Time_Performance_1987_present_2025_{m}.zip")
    if not f.exists():
        f.write_bytes(requests.get(BTS.format(m), timeout=900).content)
    with zipfile.ZipFile(f) as z:
        name = next(n for n in z.namelist() if n.endswith(".csv"))
        return pd.read_csv(z.open(name), usecols=COLS, dtype=TEXT, parse_dates=["FlightDate"], low_memory=False)


flights = pd.concat([read_month(m) for m in range(1, 13)], ignore_index=True)

# OurAirports is edited daily; this is the copy of 15 October 2026
# (live: https://davidmegginson.github.io/ourairports-data/airports.csv).
AIRPORTS = "ourairports-airports-2026-10-15.csv"
if not Path(f"data/{AIRPORTS}").exists():
    Path(f"data/{AIRPORTS}").write_bytes(requests.get(f"https://data.spatialworkflow.io/{AIRPORTS}", timeout=300).content)
ap = pd.read_csv(f"data/{AIRPORTS}", usecols=["ident", "iata_code", "name", "latitude_deg", "longitude_deg"])
by_iata = ap.dropna(subset=["iata_code"]).drop_duplicates("iata_code").set_index("iata_code")
by_ident = ap.set_index("ident")
codes = pd.Index(sorted(set(flights.Origin) | set(flights.Dest)))
KEEP = ["name", "latitude_deg", "longitude_deg"]
airports = by_iata.reindex(codes)[KEEP]
gap = airports.latitude_deg.isna().values
airports.loc[gap, KEEP] = by_ident.reindex("K" + codes[gap])[KEEP].values      # fall back to the US ident, K + code
airports = airports.rename(columns={"latitude_deg": "lat", "longitude_deg": "lon"})
print(f"{len(flights):,} flights, {len(codes)} airports, {airports.lat.isna().sum()} without coordinates")
7,001,619 flights, 352 airports, 0 without coordinates
Example 1: a tidy table with real timestamps
clean = flown.assign(dep_sched=sched, dep_actual=actual,
                     arr_sched=clock(flown.FlightDate, flown.CRSArrTime))
clean = clean.drop(columns=["DepTime", "ArrTime", "WheelsOff", "WheelsOn", "Cancelled", "CancellationCode", "Diverted"])
clean.to_parquet("data/flights-2025-clean.parquet", index=False)
print(f"{len(clean):,} rows, {clean.shape[1]} columns, "
      f"{Path('data/flights-2025-clean.parquet').stat().st_size / 1e6:.0f} MB on disk")
6,879,485 rows, 24 columns, 165 MB on disk
The clean table keeps 6,879,485 flown flights with scheduled and actual departure timestamps, in 165 MB of Parquet. The timestamps are still local times: right for "how late was the 8 a.m. departure", wrong for "how long was the flight" until each airport's time zone is attached.
Example 2: flights and cancellations by month
month = f.FlightDate.dt.month
summary = pd.DataFrame({"flights": f.groupby(month).size(),
                        "cancelled %": 100 * f.Cancelled.groupby(month).mean()})
for code, label in codes_.items():
    summary[label] = (f.CancellationCode == code).groupby(month).sum()
print(summary.round(2).to_string())
flights cancelled % carrier weather National Airspace System security
FlightDate
1 539747 3.02 1635 14327 342 8
2 504884 1.47 1565 5426 414 0
3 600872 1.15 1162 5102 659 0
4 583950 0.84 913 3569 432 0
5 605648 1.05 1115 4125 1102 2
6 611575 1.59 2432 5636 1668 0
7 631428 2.45 2682 9775 3016 0
8 602378 1.08 2001 3869 613 0
9 562439 0.51 1062 1114 710 0
10 605844 0.53 1167 1120 916 1
11 570550 2.49 2215 4320 7623 37
12 582304 1.55 3124 5021 854 2
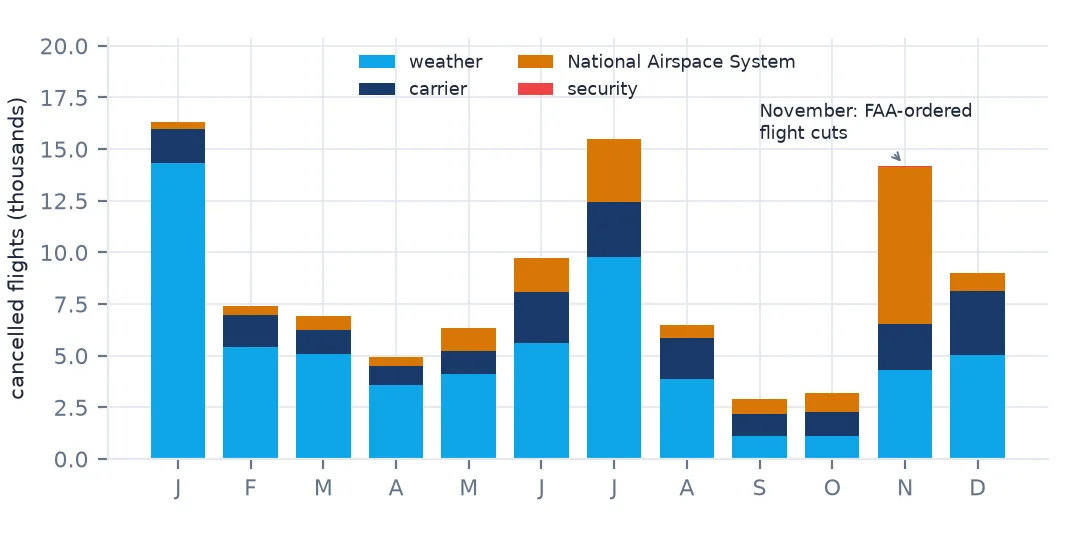
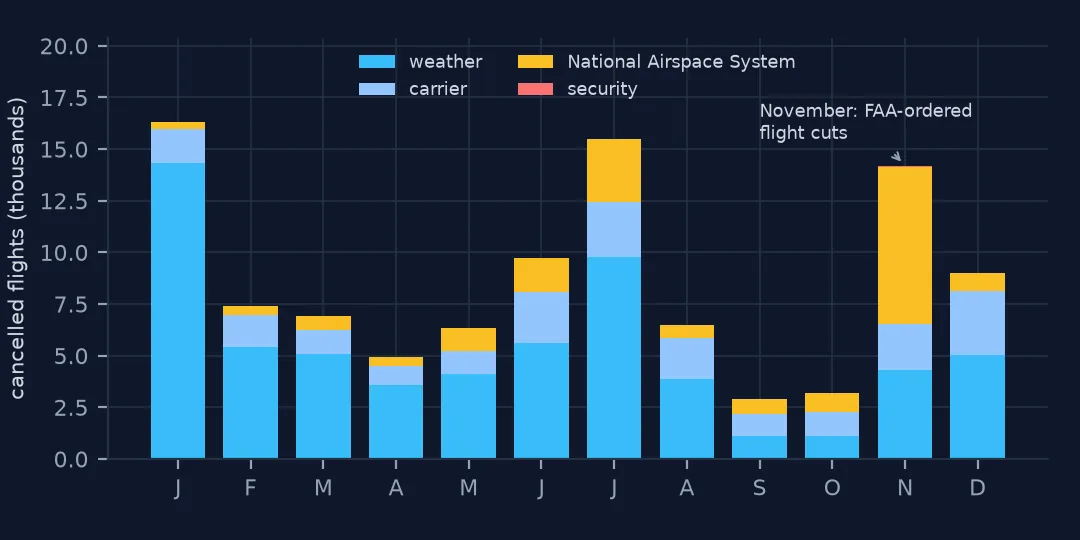
Cancellations peak in January (3.02%, mostly weather), July (2.45%, summer storms) and November (2.49%). November's are different: 7,623 were put down to the National Airspace System, more than twice any other month. Most of them fall between 7 and 16 November, when the FAA ordered airlines to cut flights at busy airports during the federal government shutdown — flight delay causes explained shows them day by day.
Why the file looks like this
The on-time file is a regulatory report, not an analytical dataset. Airlines above a size threshold file one row per scheduled flight, in the form the Department of Transportation asks for: local clock times because that is what passengers see, a delay cause only for flights that count as late, and diversion details in fixed slots because a flight can divert more than once. Every quirk above follows from that purpose.
Cleaning it is therefore mostly a matter of turning report fields into data types: text times into timestamps with the right date, local times into instants, cause columns into a breakdown of late flights only, and the cancelled and diverted rows into their own tables rather than into missing values among the flown ones. Nothing is deleted on this page; each check separates rows into the groups that different questions need.
Traps in the on-time file
2400means midnight at the end of the day. Converting through minutes after midnight handles it;pd.to_datetime(format="%H%M")does not.- The date is the scheduled date. Build actual times from the scheduled time plus the delay.
- Times are local. Durations across time zones need each airport's zone.
- Cancelled flights can have a departure time. Filter on the flag.
- Delay causes exist only for arrivals 15+ minutes late. A share of "weather minutes" is a share of late flights' minutes.
- The reporting threshold changes which airlines appear. Small carriers are not in the file at all.
Internal links
- Flights that arrive before they depart — what local clock times do across time zones
- Flight delay causes explained — the five cause columns
- How to map flight delays by airport — the first map of the clean table
- Average flight delay comes out negative — which delay measure to report
FAQ
How many US domestic flights were there in 2025?
The BTS on-time file has 7,001,619 flights for 2025 from the reporting carriers; 102,876 were cancelled and 19,258 diverted.
Why do some BTS flights have a departure time on the wrong day?
DepTime is a clock time attached to the scheduled date. A flight delayed past midnight keeps the old date; adding DepDelay to the scheduled departure gives the right timestamp. 41,758 flights in 2025 are affected.