
How to Measure Where and When Weather Delays Flights
On this page
Problem statement
Weather is the delay everyone blames and the one the data is least direct about. The BTS on-time file has a WeatherDelay column, but it holds only "extreme" weather that the airline could not plan around; the ordinary rain and low cloud that slow an airport's arrival rate are booked to the National Airspace System instead. Cancellations carry their own weather code. And weather happens on particular days at particular places, so a yearly average per airport hides almost everything interesting.
This page measures weather's footprint in the 2025 file three ways — delay minutes, cancellations and their timing — and finds where and when it bites: which airports, which months, which hours and which handful of days.
Quick answer
Per departure airport, sum the extreme-weather delay minutes over flights flown and count cancellations coded B (weather) over all scheduled flights:
f = flights
dep = f[f.Cancelled == 0]
by = pd.DataFrame({"departures": f.groupby("Origin").size(),
                   "weather min per flight": dep.groupby("Origin").WeatherDelay.sum() / dep.groupby("Origin").size(),
                   "weather cancellations per 1,000": 1000 * (f.CancellationCode == "B").groupby(f.Origin).mean()})
big = by[by.departures >= 20_000]
print(big.sort_values("weather min per flight", ascending=False).round(2).head(6).to_string())
print(f"national: {dep.WeatherDelay.sum() / len(dep):.2f} weather minutes per flight, "
      f"{1000 * (f.CancellationCode == 'B').mean():.2f} weather cancellations per 1,000 flights")
departures weather min per flight weather cancellations per 1,000
Origin
DFW 315854 1.89 22.57
ORD 327028 1.74 12.03
IAH 117259 1.55 9.78
IAD 57546 1.53 5.56
OKC 24190 1.53 10.95
MCO 160048 1.33 5.70
national: 1.03 weather minutes per flight, 9.06 weather cancellations per 1,000 flights
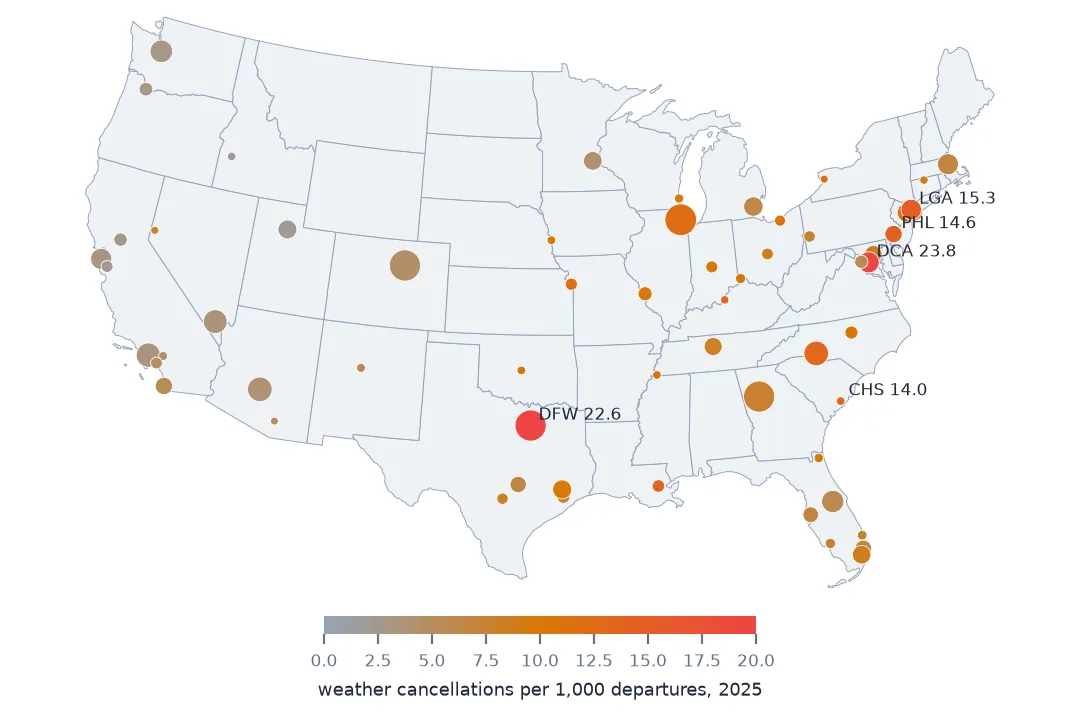
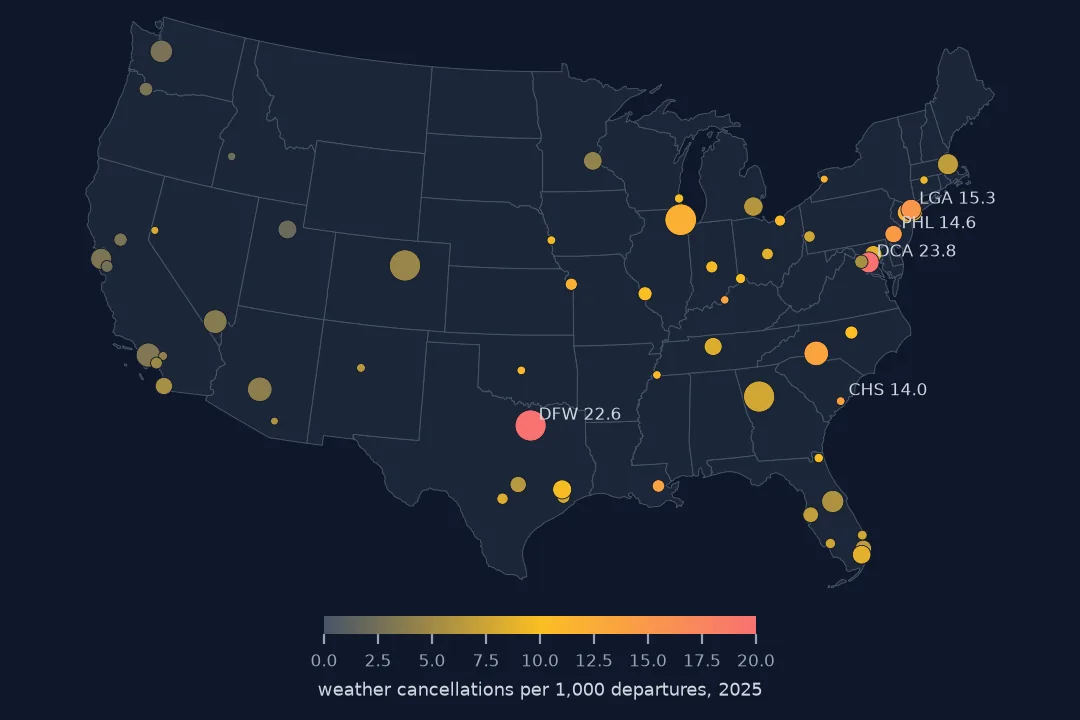
Among the large airports, Dallas–Fort Worth lost the most to weather in 2025: 1.89 minutes per flight and 22.57 weather cancellations per 1,000 departures, against national figures of 1.03 and 9.06. O'Hare, Houston Intercontinental, Washington Dulles and Oklahoma City follow. These are averages over a year that, as the steps show, are made of a few bad days.
Minutes, cancellations, months and days
1. Weather hides in two columns
cause = dep[["CarrierDelay", "WeatherDelay", "NASDelay", "SecurityDelay", "LateAircraftDelay"]].sum()
print((cause / cause.sum() * 100).round(1).to_string())
print("cancellations by cause:", f.CancellationCode.value_counts().to_dict())
CarrierDelay 32.5
WeatherDelay 6.4
NASDelay 21.9
SecurityDelay 0.1
LateAircraftDelay 39.2
cancellations by cause: {'B': 63404, 'A': 21073, 'C': 18349, 'D': 50}
Extreme weather accounts for only 6.4% of reported delay minutes, but weather is the commonest reason for cancelling: 63,404 cancellations, three times the next cause. The National Airspace System's 21.9% of minutes includes most weather that merely slows traffic — a thunderstorm that halves an airport's arrival rate is usually a NAS delay — so weather's real share of delay is somewhere between the two columns. Flight delay causes explained goes through the definitions.
2. The national weather calendar
month = f.FlightDate.dt.month
cal = pd.DataFrame({"weather min per flight": dep.WeatherDelay.groupby(dep.FlightDate.dt.month).sum() / dep.groupby(dep.FlightDate.dt.month).size(),
                    "NAS min per flight": dep.NASDelay.groupby(dep.FlightDate.dt.month).sum() / dep.groupby(dep.FlightDate.dt.month).size(),
                    "weather cancellations per 1,000": 1000 * (f.CancellationCode == "B").groupby(month).mean()})
print(cal.round(2).T.to_string())
FlightDate 1 2 3 4 5 6 7 8 9 10 11 12
weather min per flight 1.20 0.98 0.83 0.75 1.18 1.48 1.72 1.15 0.62 0.43 0.69 1.27
NAS min per flight 2.64 3.35 3.09 3.01 4.42 4.50 4.85 3.17 2.51 2.98 4.02 3.83
weather cancellations per 1,000 26.54 10.75 8.49 6.11 6.81 9.22 15.48 6.42 1.98 1.85 7.57 8.62
Two seasons stand out. January had 26.54 weather cancellations per 1,000 flights, the worst month by far; July had the most weather delay per flight (1.72 minutes) and the second-highest cancellation rate. September and October were nearly free of weather cancellations. NAS delay follows the summer peak too, rising to 4.85 minutes per flight in July: convective weather shows up in both columns.
3. Each airport's season
cell = (f.CancellationCode == "B").groupby([f.Origin, month]).mean().unstack() * 1000
peak = cell.loc[big.index].idxmax(axis=1)
print("month of most weather cancellations, large airports:", peak.value_counts().sort_index().to_dict())
for code in ["MCO", "MIA", "DFW", "DEN", "MSP", "BOS"]:
    print(f"{code}: peak month {peak[code]}, {cell.loc[code].max():.1f} per 1,000; quietest {cell.loc[code].min():.1f}")
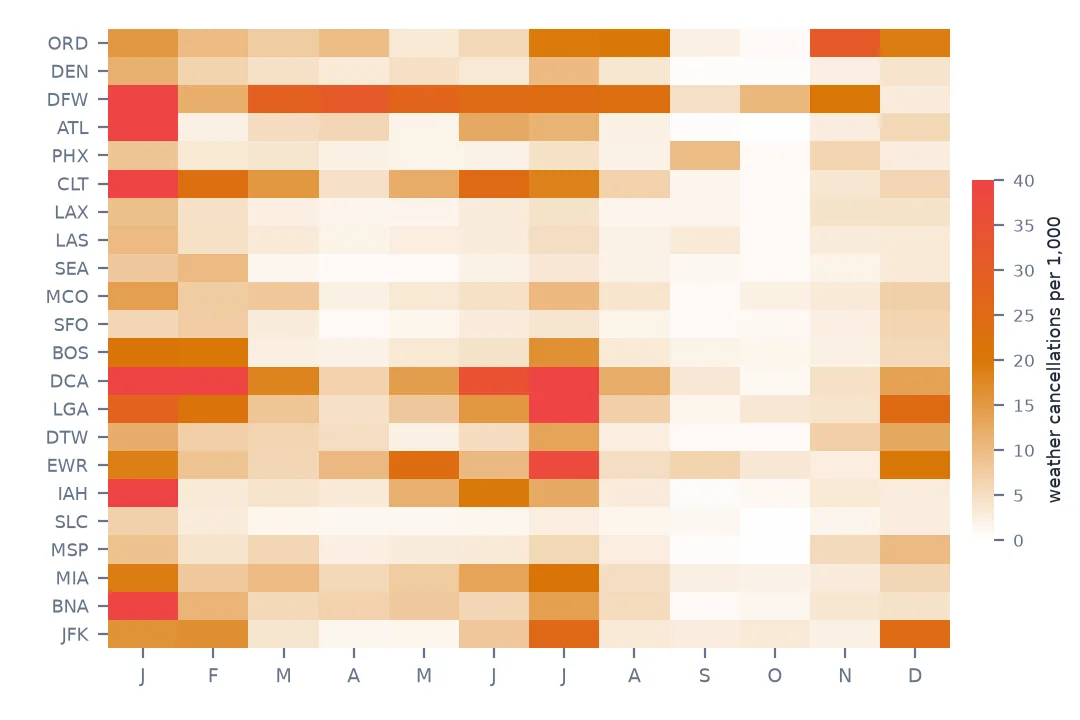
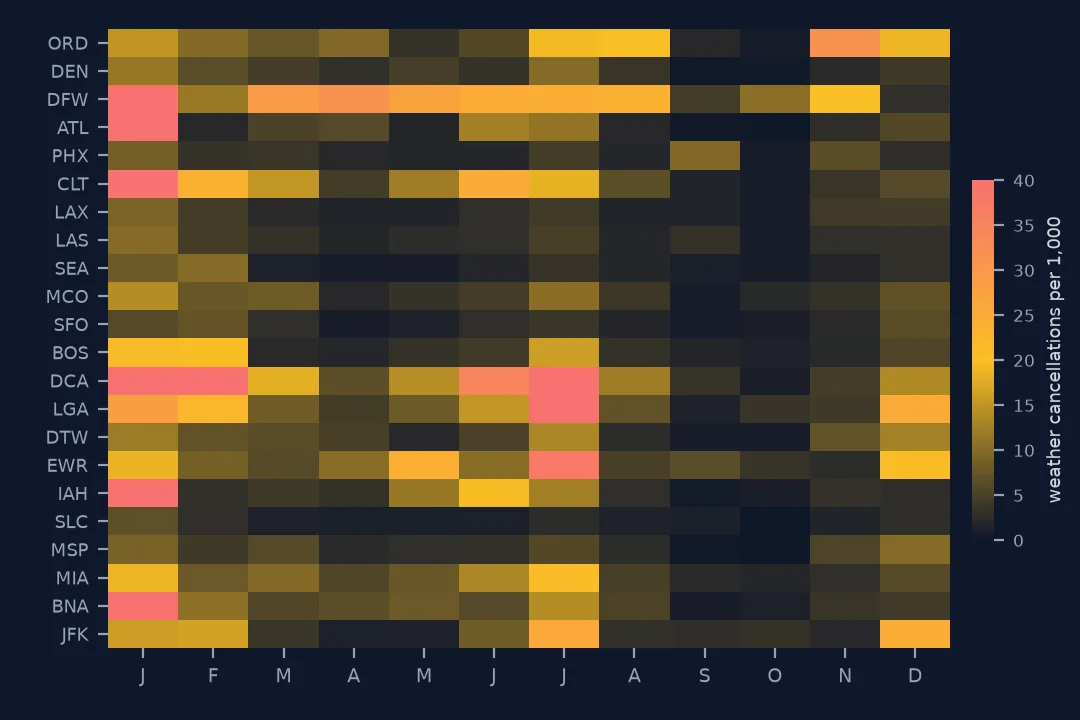
month of most weather cancellations, large airports: {1: 45, 2: 4, 3: 1, 7: 11, 9: 1, 11: 3, 12: 2}
MCO: peak month 1, 14.1 per 1,000; quietest 0.7
MIA: peak month 7, 20.6 per 1,000; quietest 1.9
DFW: peak month 1, 60.6 per 1,000; quietest 2.9
DEN: peak month 1, 11.7 per 1,000; quietest 0.4
MSP: peak month 12, 10.1 per 1,000; quietest 0.2
BOS: peak month 1, 21.0 per 1,000; quietest 1.5
For 45 of the large airports, January was the worst month for weather cancellations, and for 11 it was July. The local seasons differ sharply: Miami's peak is July (20.6 per 1,000), while Orlando's and Dallas's is January — DFW's January rate of 60.6 per 1,000 is twenty times its quietest month. Minneapolis, which handles snow routinely, peaks in December at only 10.1.
4. The days that did the damage
daily = f.assign(b=f.CancellationCode == "B").groupby("FlightDate").b.sum()
top = daily.nlargest(6)
for day, n in top.items():
    worst = f[(f.FlightDate == day) & (f.CancellationCode == "B")].Origin.value_counts().head(4)
    print(f"{day:%a %d %b}: {n:,} weather cancellations; most at {', '.join(f'{a} {c}' for a, c in worst.items())}")
print(f"those six days hold {top.sum() / daily.sum():.0%} of the year's weather cancellations")
Fri 10 Jan: 2,717 weather cancellations; most at ATL 578, CLT 289, DFW 249, BNA 144
Thu 09 Jan: 1,864 weather cancellations; most at DFW 751, DAL 124, DEN 36, LAS 28
Mon 06 Jan: 1,770 weather cancellations; most at DCA 325, BWI 144, STL 100, ORD 68
Sat 29 Nov: 1,602 weather cancellations; most at ORD 564, MDW 126, DFW 36, MSP 30
Tue 21 Jan: 1,596 weather cancellations; most at IAH 270, HOU 124, MSY 121, ATL 113
Sun 05 Jan: 1,342 weather cancellations; most at DFW 163, MCI 136, STL 128, ORD 74
those six days hold 17% of the year's weather cancellations
Five of the six worst days were in January: winter storms that reached Washington on 6 January, Dallas on 9 January, Atlanta and Charlotte on 10 January, and the Gulf Coast — Houston, New Orleans — on 21 January, airports that rarely see snow and have little equipment for it. The sixth was the Saturday after Thanksgiving, concentrated at O'Hare. Six days account for 17% of the year's weather cancellations.
Hours and the two kinds of damage
The data used on this page
The Bureau of Transportation Statistics Reporting Carrier On-Time Performance files for 2025 (delay-cause minutes and cancellation codes), and airport coordinates from OurAirports in a copy saved on 15 October 2026.
from pathlib import Path
import zipfile

import numpy as np
import pandas as pd
import requests

Path("data").mkdir(exist_ok=True)
BTS = "https://transtats.bts.gov/PREZIP/On_Time_Reporting_Carrier_On_Time_Performance_1987_present_2025_{}.zip"
COLS = ["FlightDate", "Reporting_Airline", "Tail_Number", "Flight_Number_Reporting_Airline", "Origin", "Dest",
        "CRSDepTime", "DepTime", "DepDelay", "TaxiOut", "WheelsOff", "WheelsOn", "TaxiIn", "CRSArrTime", "ArrTime",
        "ArrDelay", "Cancelled", "CancellationCode", "Diverted", "CRSElapsedTime", "ActualElapsedTime", "AirTime",
        "Distance", "CarrierDelay", "WeatherDelay", "NASDelay", "SecurityDelay", "LateAircraftDelay"]
TEXT = {c: str for c in ["CRSDepTime", "DepTime", "WheelsOff", "WheelsOn", "CRSArrTime", "ArrTime", "CancellationCode",
                         "Tail_Number"]}


def read_month(m):
    f = Path(f"data/On_Time_Reporting_Carrier_On_Time_Performance_1987_present_2025_{m}.zip")
    if not f.exists():
        f.write_bytes(requests.get(BTS.format(m), timeout=900).content)
    with zipfile.ZipFile(f) as z:
        name = next(n for n in z.namelist() if n.endswith(".csv"))
        return pd.read_csv(z.open(name), usecols=COLS, dtype=TEXT, parse_dates=["FlightDate"], low_memory=False)


flights = pd.concat([read_month(m) for m in range(1, 13)], ignore_index=True)

# OurAirports is edited daily; this is the copy of 15 October 2026
# (live: https://davidmegginson.github.io/ourairports-data/airports.csv).
AIRPORTS = "ourairports-airports-2026-10-15.csv"
if not Path(f"data/{AIRPORTS}").exists():
    Path(f"data/{AIRPORTS}").write_bytes(requests.get(f"https://data.spatialworkflow.io/{AIRPORTS}", timeout=300).content)
ap = pd.read_csv(f"data/{AIRPORTS}", usecols=["ident", "iata_code", "name", "latitude_deg", "longitude_deg"])
by_iata = ap.dropna(subset=["iata_code"]).drop_duplicates("iata_code").set_index("iata_code")
by_ident = ap.set_index("ident")
codes = pd.Index(sorted(set(flights.Origin) | set(flights.Dest)))
KEEP = ["name", "latitude_deg", "longitude_deg"]
airports = by_iata.reindex(codes)[KEEP]
gap = airports.latitude_deg.isna().values
airports.loc[gap, KEEP] = by_ident.reindex("K" + codes[gap])[KEEP].values      # fall back to the US ident, K + code
airports = airports.rename(columns={"latitude_deg": "lat", "longitude_deg": "lon"})
print(f"{len(flights):,} flights, {len(codes)} airports, {airports.lat.isna().sum()} without coordinates")
7,001,619 flights, 352 airports, 0 without coordinates
Example 1: the afternoon thunderstorm
summer = dep[dep.FlightDate.dt.month.isin([6, 7, 8])]
hour = summer.CRSDepTime.str[:2].astype(int).clip(upper=23)
south = summer.Origin.isin(["MCO", "MIA", "TPA", "FLL", "IAH", "ATL"])
prof = summer.groupby([south.map({True: "Florida, Houston, Atlanta", False: "everywhere else"}), hour]).WeatherDelay.mean().unstack(0)
print(prof.loc[[6, 9, 12, 15, 18, 21]].round(2).to_string())
Origin Florida, Houston, Atlanta everywhere else
CRSDepTime
6 1.54 5.01
9 2.63 2.68
12 8.30 4.29
15 7.59 6.77
18 9.13 6.30
21 6.25 4.24
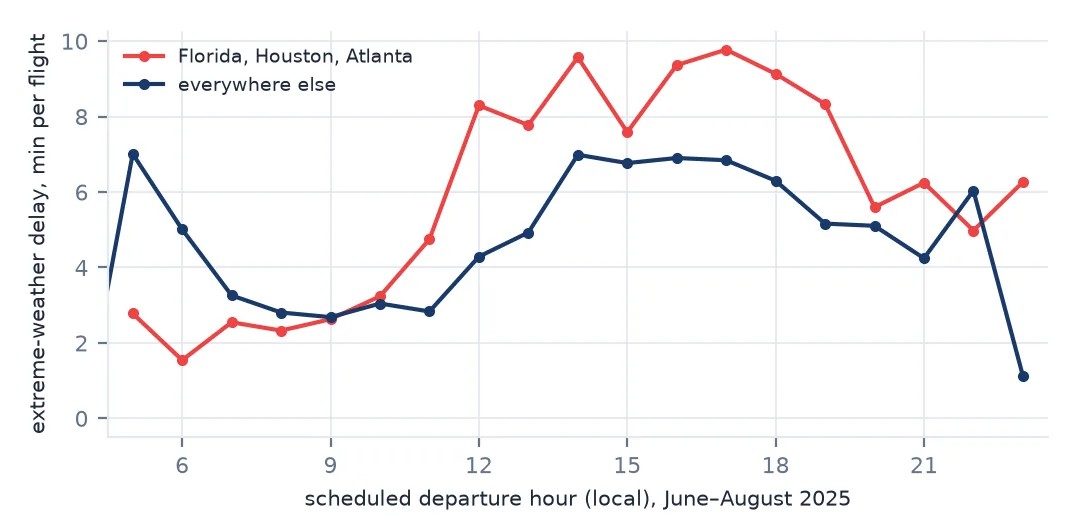
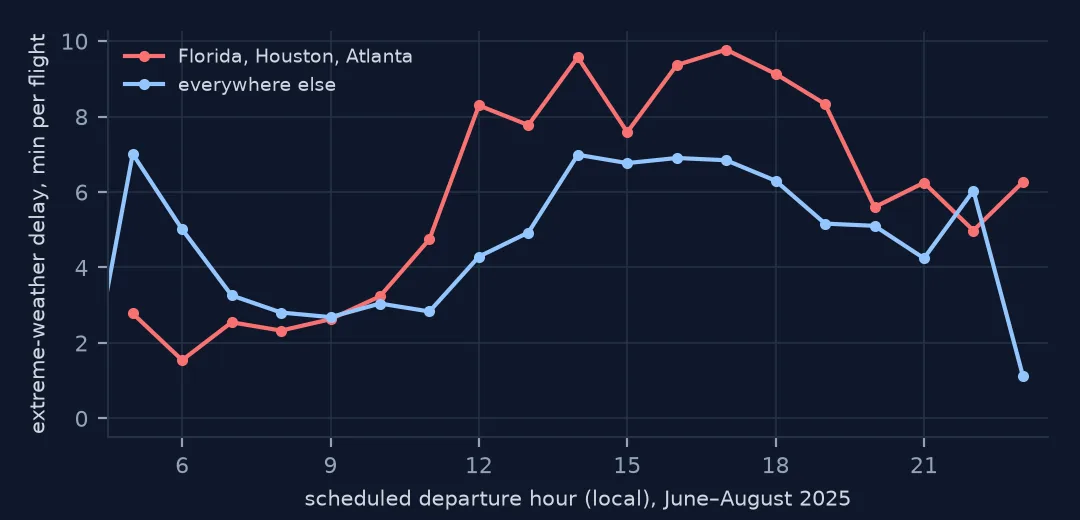
In summer, flights from Florida, Houston and Atlanta pick up almost no weather delay in the morning and up to 9.13 minutes per flight in the evening, as afternoon thunderstorms build. Elsewhere the curve is flatter; its early-morning value is high because of a small number of very long weather delays on the first departures of storm days.
Example 2: weather delay or weather cancellation
both = big.join(airports)
print(f"correlation between weather minutes per flight and weather cancellations, large airports: "
      f"{both['weather min per flight'].corr(both['weather cancellations per 1,000']):.2f}")
print(both.sort_values("weather cancellations per 1,000", ascending=False).head(4)[["weather min per flight", "weather cancellations per 1,000"]].round(2).to_string())
correlation between weather minutes per flight and weather cancellations, large airports: 0.59
weather min per flight weather cancellations per 1,000
Origin
DCA 1.16 23.84
DFW 1.89 22.57
LGA 0.82 15.27
PHL 0.97 14.59
Weather delay and weather cancellation are related (correlation 0.59 across large airports) but not the same. Washington National cancels the most for weather, 23.84 per 1,000, with only 1.16 minutes of weather delay per flight: it cancels rather than delays. LaGuardia and Philadelphia show the same pattern, which is why a weather ranking has to say which measure it uses.
Weather as recorded, not as observed
The file does not measure weather. It records an airline's judgement, at the time, of why a flight was late or cancelled, under the Department of Transportation's definitions. Extreme weather is a carrier-reported category for conditions that stop a flight outright; non-extreme weather that reduces capacity goes to NAS; and an aircraft late from a weather-hit airport becomes a late-aircraft delay downstream. Weather therefore appears in at least three columns, and the WeatherDelay column is the smallest of them.
What the file does well is time and place. The cancellation codes and minutes are tied to an airport and a day, which is enough to show that weather is not a background rate but a set of events: winter storms that close airports unused to snow, and summer thunderstorms that build every afternoon over the Southeast. Joining the file to observed weather — a station's daily record, or radar — is the next step for anyone who wants to separate how bad the weather was from how well an airport coped with it.
Reading weather from the delay file
WeatherDelayis extreme weather only. Most weather delay is booked as NAS.- Cancellations and delays tell different stories. Rank by both, or say which.
- Annual averages hide events. Six days held 17% of 2025's weather cancellations.
- A delay is booked at the flight, not the storm. A flight from Phoenix can carry Chicago's weather.
- Divide by flights scheduled for cancellations, flights flown for delay minutes.
Internal links
- Flight delay causes explained — why weather is split between two columns
- How to map flight delays by airport — all causes together
- How much rain and cold cut bike-share ridership — weather against another kind of travel
- How to load and clean a year of US flight data — the cancellation codes
FAQ
Which US airport had the most weather delays in 2025?
Dallas–Fort Worth, with 1.89 minutes of extreme-weather delay per departure and 22.57 weather cancellations per 1,000 scheduled departures, the most among large airports.
What month has the most weather-related flight cancellations?
January in 2025: 26.54 per 1,000 flights nationally, driven by winter storms across the South and Mid-Atlantic. July was second.