
Flight Delay Causes Explained: Carrier, Weather, NAS and Late Aircraft
On this page
Problem statement
Every late flight in the BTS on-time file carries five numbers that say why it was late: minutes due to the carrier, to extreme weather, to the National Airspace System, to security, and to the aircraft arriving late from its previous flight. They are the basis of every "airlines cause most delays" or "weather causes few delays" headline, and they are easy to misread. They exist only for flights at least 15 minutes late; they are assigned by the airline under the Department of Transportation's rules; and two of the five categories are largely made of the other three, displaced in time or space.
This page explains each category and measures it on the 1.5 million late flights of 2025: how the minutes split, how often a delay has more than one cause, how the mix changes through the day and between airlines, and what the cancellation codes say.
Quick answer
Take the flights that have cause minutes, sum each column, and look at both the share of minutes and the share of late flights each cause touches:
CAUSES = ["CarrierDelay", "WeatherDelay", "NASDelay", "SecurityDelay", "LateAircraftDelay"]
late = flights[flights.CarrierDelay.notna()]
minutes = late[CAUSES].sum()
print(f"{len(late):,} flights carry cause minutes ({len(late) / len(flights):.1%} of all)")
print(pd.DataFrame({"share of minutes": minutes / minutes.sum(), "flights with any": (late[CAUSES] > 0).mean()})
      .round(3).to_string())
1,534,638 flights carry cause minutes (21.9% of all)
share of minutes flights with any
CarrierDelay 0.325 0.525
WeatherDelay 0.064 0.065
NASDelay 0.219 0.517
SecurityDelay 0.001 0.003
LateAircraftDelay 0.392 0.505
Late-arriving aircraft account for 39.2% of delay minutes, the carrier's own problems for 32.5%, the airspace system for 21.9%, extreme weather for 6.4% and security for 0.1%. The minutes understate how widespread the first three are: each appears on roughly half of all late flights, because most late flights have more than one cause.
The five columns, measured
1. Only late flights have causes
print(f"minimum arrival delay among flights with causes: {late.ArrDelay.min():.0f} min")
print(f"flights 15+ min late without causes: {((flights.ArrDelay >= 15) & flights.CarrierDelay.isna()).sum()}")
total = late[CAUSES].sum(axis=1)
print(f"causes add up to the arrival delay: {(total == late.ArrDelay).mean():.1%}")
minimum arrival delay among flights with causes: 15 min
flights 15+ min late without causes: 0
causes add up to the arrival delay: 100.0%
The rule is exact: no flight with cause minutes arrived less than 15 minutes late, none that arrived 15 or more minutes late lacks them, and the five columns add up to the arrival delay for every flight. A cause breakdown is therefore always a breakdown of late flights' minutes, never of all flights.
2. Five categories, each a judgement
one = (late[CAUSES] > 0).sum(axis=1)
print("number of causes given per late flight:", one.value_counts().sort_index().to_dict())
print("single-cause flights by cause:", late[one == 1][CAUSES].gt(0).idxmax(axis=1).value_counts().to_dict())
number of causes given per late flight: {0: 14, 1: 745510, 2: 635646, 3: 152635, 4: 833}
single-cause flights by cause: {'NASDelay': 272396, 'CarrierDelay': 245892, 'LateAircraftDelay': 200750, 'WeatherDelay': 25231, 'SecurityDelay': 1241}
Slightly fewer than half of late flights have a single cause; 635,646 have two and 152,635 three. Among single-cause delays, NAS is the most common, then carrier, then late aircraft. A late aircraft is almost always combined with something else, because a late inbound flight seldom arrives exactly as much late as the outbound flight leaves.
3. Late aircraft grows through the day
hour = late.CRSDepTime.str[:2].astype(int).clip(upper=23)
share = late.groupby(hour)[CAUSES].sum()
share = share.div(share.sum(axis=1), axis=0)
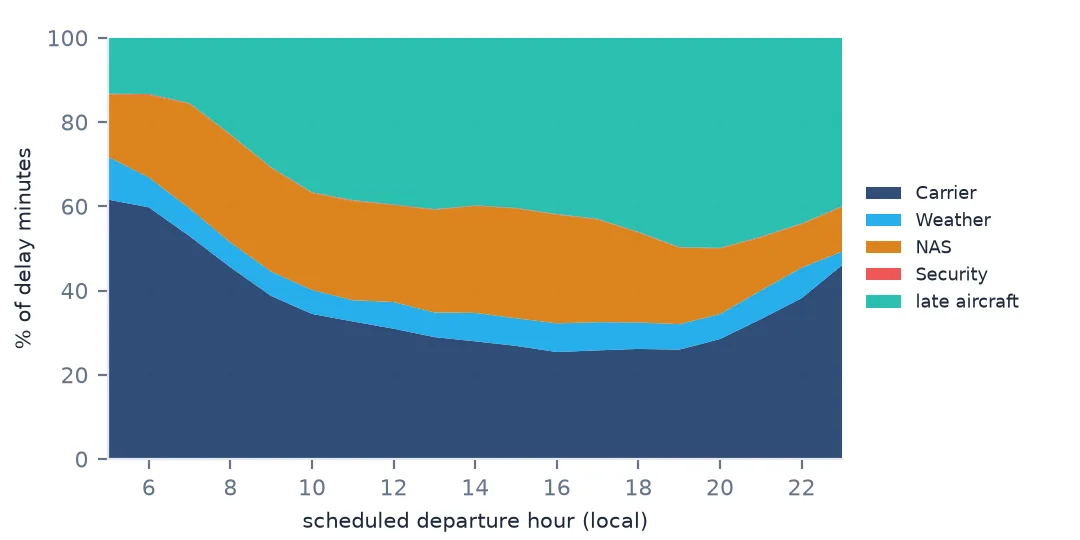
print(share.loc[[6, 9, 12, 15, 18, 21]].round(2).to_string())
CarrierDelay WeatherDelay NASDelay SecurityDelay LateAircraftDelay
CRSDepTime
6 0.60 0.07 0.20 0.0 0.13
9 0.39 0.06 0.25 0.0 0.31
12 0.31 0.06 0.23 0.0 0.40
15 0.27 0.07 0.26 0.0 0.40
18 0.26 0.06 0.21 0.0 0.46
21 0.33 0.07 0.13 0.0 0.47
At 6 a.m. the carrier causes 60% of delay minutes and late aircraft only 13%: the first flights have no inbound aircraft to wait for, so what goes wrong is crews, maintenance and boarding. By 6 p.m. late aircraft causes 46%. That shift is the propagation of morning delays through the day (following an aircraft through its day), and it means the late-aircraft share measures how much of the day's delay was inherited rather than created.
4. Cancellation codes
c = flights[flights.Cancelled == 1]
print(c.CancellationCode.map({"A": "carrier", "B": "weather", "C": "NAS", "D": "security"}).value_counts().to_string())
nov = c[(c.CancellationCode == "C") & c.FlightDate.between("2025-10-25", "2025-11-25")].groupby("FlightDate").size()
print(nov.loc["2025-11-05":"2025-11-18"].to_string())
print("most NAS cancellations 7-16 Nov:", c[(c.CancellationCode == "C") & c.FlightDate.between("2025-11-07", "2025-11-16")]
      .Origin.value_counts().head(5).to_dict())
CancellationCode
weather 63404
carrier 21073
NAS 18349
security 50
FlightDate
2025-11-05 65
2025-11-06 77
2025-11-07 645
2025-11-08 900
2025-11-09 1555
2025-11-10 1236
2025-11-11 794
2025-11-12 598
2025-11-13 667
2025-11-14 390
2025-11-15 194
2025-11-16 54
2025-11-17 28
2025-11-18 1
most NAS cancellations 7-16 Nov: {'ORD': 601, 'EWR': 330, 'LGA': 278, 'DEN': 272, 'DCA': 238}
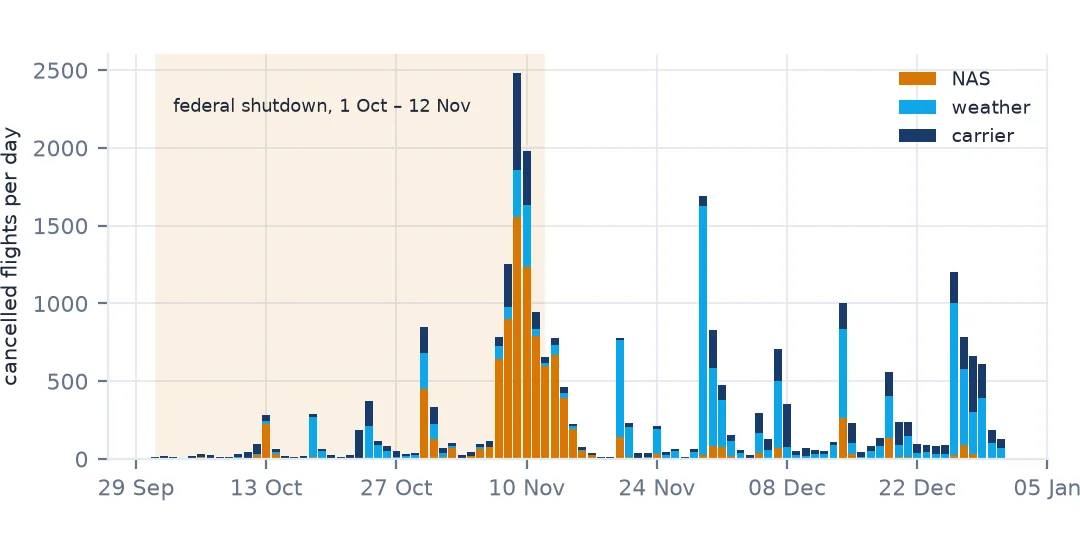
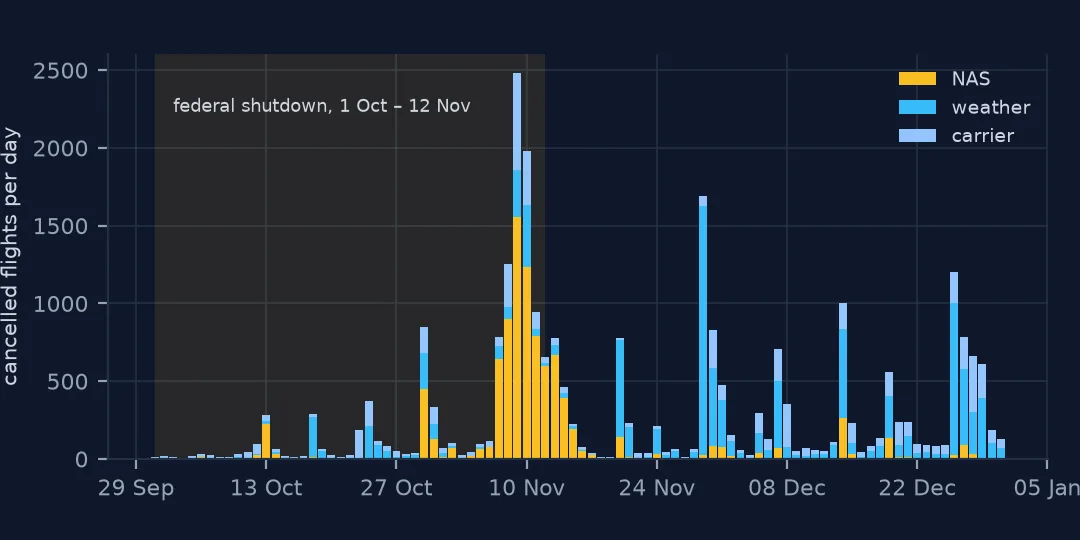
Cancellations have their own four codes and a different balance: weather causes most of them, while the carrier and the airspace system cause similar numbers. NAS cancellations jump from 77 on 6 November 2025 to 645 on 7 November and 1,555 on 9 November, then fade to almost none by 18 November. Those were the days when the FAA ordered airlines to reduce flights at busy airports during the federal government shutdown, and O'Hare, Newark, LaGuardia, Denver and Washington National carried most of the cuts. In the delay file they appear as an air-traffic-system cause, which is what they were.
Airlines and their delay mix
The data used on this page
The Bureau of Transportation Statistics Reporting Carrier On-Time Performance files for 2025, whose five cause columns and cancellation codes follow the Department of Transportation's definitions of delay causes, and airport coordinates from OurAirports in a copy saved on 15 October 2026.
from pathlib import Path
import zipfile

import numpy as np
import pandas as pd
import requests

Path("data").mkdir(exist_ok=True)
BTS = "https://transtats.bts.gov/PREZIP/On_Time_Reporting_Carrier_On_Time_Performance_1987_present_2025_{}.zip"
COLS = ["FlightDate", "Reporting_Airline", "Tail_Number", "Flight_Number_Reporting_Airline", "Origin", "Dest",
        "CRSDepTime", "DepTime", "DepDelay", "TaxiOut", "WheelsOff", "WheelsOn", "TaxiIn", "CRSArrTime", "ArrTime",
        "ArrDelay", "Cancelled", "CancellationCode", "Diverted", "CRSElapsedTime", "ActualElapsedTime", "AirTime",
        "Distance", "CarrierDelay", "WeatherDelay", "NASDelay", "SecurityDelay", "LateAircraftDelay"]
TEXT = {c: str for c in ["CRSDepTime", "DepTime", "WheelsOff", "WheelsOn", "CRSArrTime", "ArrTime", "CancellationCode",
                         "Tail_Number"]}


def read_month(m):
    f = Path(f"data/On_Time_Reporting_Carrier_On_Time_Performance_1987_present_2025_{m}.zip")
    if not f.exists():
        f.write_bytes(requests.get(BTS.format(m), timeout=900).content)
    with zipfile.ZipFile(f) as z:
        name = next(n for n in z.namelist() if n.endswith(".csv"))
        return pd.read_csv(z.open(name), usecols=COLS, dtype=TEXT, parse_dates=["FlightDate"], low_memory=False)


flights = pd.concat([read_month(m) for m in range(1, 13)], ignore_index=True)

# OurAirports is edited daily; this is the copy of 15 October 2026
# (live: https://davidmegginson.github.io/ourairports-data/airports.csv).
AIRPORTS = "ourairports-airports-2026-10-15.csv"
if not Path(f"data/{AIRPORTS}").exists():
    Path(f"data/{AIRPORTS}").write_bytes(requests.get(f"https://data.spatialworkflow.io/{AIRPORTS}", timeout=300).content)
ap = pd.read_csv(f"data/{AIRPORTS}", usecols=["ident", "iata_code", "name", "latitude_deg", "longitude_deg"])
by_iata = ap.dropna(subset=["iata_code"]).drop_duplicates("iata_code").set_index("iata_code")
by_ident = ap.set_index("ident")
codes = pd.Index(sorted(set(flights.Origin) | set(flights.Dest)))
KEEP = ["name", "latitude_deg", "longitude_deg"]
airports = by_iata.reindex(codes)[KEEP]
gap = airports.latitude_deg.isna().values
airports.loc[gap, KEEP] = by_ident.reindex("K" + codes[gap])[KEEP].values      # fall back to the US ident, K + code
airports = airports.rename(columns={"latitude_deg": "lat", "longitude_deg": "lon"})
print(f"{len(flights):,} flights, {len(codes)} airports, {airports.lat.isna().sum()} without coordinates")
7,001,619 flights, 352 airports, 0 without coordinates
Example 1: the same causes, different airlines
mix = late.groupby("Reporting_Airline")[CAUSES].sum()
mix = mix.div(mix.sum(axis=1), axis=0).rename(columns=lambda c: c.replace("Delay", ""))
mix["late flights"] = late.groupby("Reporting_Airline").size()
print(mix.sort_values("LateAircraft", ascending=False).round(2).to_string())
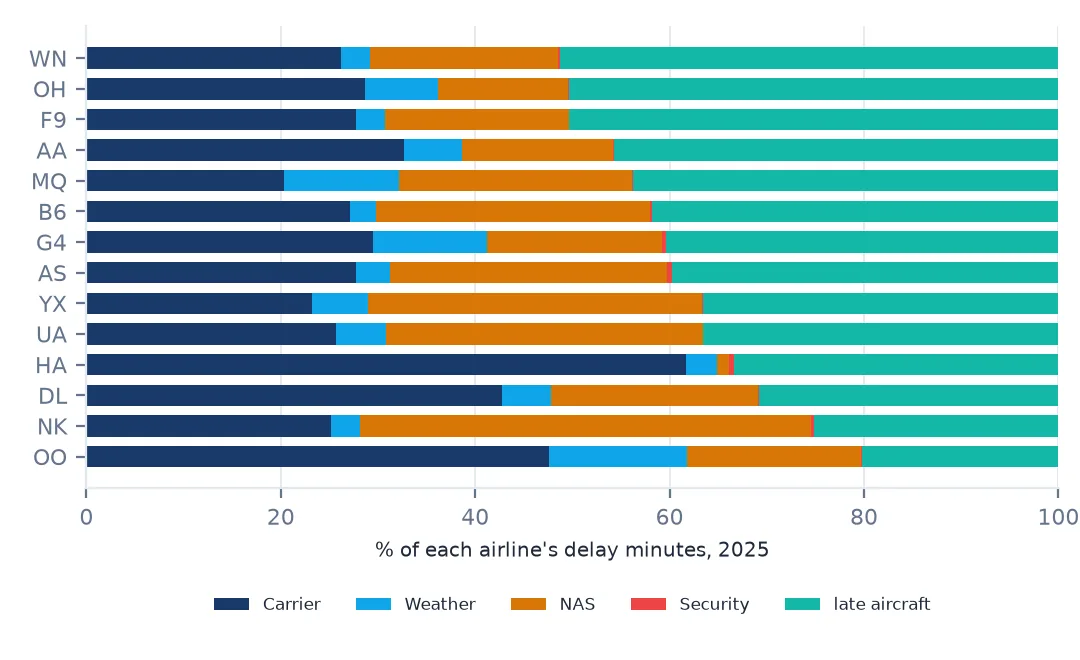
Carrier Weather NAS Security LateAircraft late flights
Reporting_Airline
WN 0.26 0.03 0.19 0.0 0.51 294575
OH 0.29 0.07 0.13 0.0 0.50 65158
F9 0.28 0.03 0.19 0.0 0.50 54202
AA 0.33 0.06 0.16 0.0 0.46 244989
MQ 0.20 0.12 0.24 0.0 0.44 61400
B6 0.27 0.03 0.28 0.0 0.42 59288
G4 0.29 0.12 0.18 0.0 0.40 32428
AS 0.28 0.03 0.29 0.0 0.40 55887
YX 0.23 0.06 0.34 0.0 0.37 71857
UA 0.26 0.05 0.33 0.0 0.37 168815
HA 0.62 0.03 0.01 0.0 0.33 13710
DL 0.43 0.05 0.21 0.0 0.31 200402
NK 0.25 0.03 0.46 0.0 0.25 40931
OO 0.48 0.14 0.18 0.0 0.20 170996
The mix says as much about an airline's network as about its punctuality. Southwest, which flies aircraft through many short legs a day, has the highest late-aircraft share at 51%. SkyWest (OO), a regional carrier, has 48% of minutes put down to itself and only 20% to late aircraft. Spirit has the highest NAS share, 46%, and Hawaiian, flying mostly between the islands, reports almost no NAS delay at all.
Example 2: carrier-caused delay per flight flown
flown = flights[flights.Cancelled == 0]
per = (flown.groupby("Reporting_Airline").CarrierDelay.sum() / flown.groupby("Reporting_Airline").size()).sort_values()
print("carrier-caused delay minutes per flight flown:", per.round(1).to_dict())
carrier-caused delay minutes per flight flown: {'MQ': 2.7, 'WN': 3.2, 'AS': 3.3, 'YX': 3.6, 'UA': 4.0, 'NK': 4.0, 'B6': 5.4, 'HA': 5.6, 'DL': 6.2, 'G4': 6.3, 'F9': 6.5, 'AA': 7.0, 'OH': 7.2, 'OO': 8.2}
Divided by every flight flown, carrier-caused delay ranges from 2.7 minutes per flight (Envoy, MQ) to 8.2 (SkyWest). This is the closest the file comes to an airline's own responsibility, and it ranks airlines differently from an on-time percentage.
What the categories mean
The Department of Transportation defines the five causes, and the airlines assign them. Air carrier delay is anything within the airline's control: maintenance, crew, cleaning, baggage, fuelling. Extreme weather is weather that, in the airline's judgement, delays or prevents the flight outright — a hurricane, a blizzard. National Airspace System delay covers conditions the airline does not control but the air-traffic system does: non-extreme weather that reduces airport capacity, heavy traffic, closed runways, air-traffic-control restrictions. Security is a terminal evacuation or a screening breakdown. Late-arriving aircraft is delay inherited from the same aircraft's previous flight.
Two consequences follow. First, weather is spread across three columns: extreme weather in its own, ordinary weather in NAS, and weather at a previous airport in late aircraft. "Weather causes only 6% of delays" is a statement about the column, not about the weather. Second, late aircraft is not an independent cause at all; it is earlier delay of the other four kinds, carried forward. Allocating it back to its origin requires following the aircraft — which the tail numbers make possible.
Using the cause columns
- Causes exist only for arrivals 15+ minutes late. Shares are shares of late minutes.
- Most late flights have more than one cause. Count flights with any minutes, not only the largest cause.
- Weather is in three columns. Do not equate
WeatherDelaywith weather. - Late aircraft is inherited delay. Its share grows through the day.
- Airlines assign the causes. Comparisons between airlines inherit their coding practice.
- Cancellation codes are a separate system with four categories.
Internal links
- How to measure where and when weather delays flights — the weather columns in detail
- How to follow an aircraft through its day — what late aircraft means in practice
- How to load and clean a year of US flight data — the file the causes come from
- Average flight delay comes out negative — measuring delay as a whole
FAQ
What is the most common cause of US flight delays?
In 2025, aircraft arriving late from a previous flight: 39.2% of delay minutes. The airline's own causes were 32.5%, the National Airspace System 21.9% and extreme weather 6.4%.
What does NAS delay mean on a flight?
National Airspace System delay: conditions the air-traffic system controls, including non-extreme weather that reduces capacity, heavy traffic and air-traffic-control restrictions. In November 2025 it also covered the flights the FAA ordered cut during the government shutdown.