
Buildings Missing from OSM
On this page
Problem statement
The building density map shows a dense city centre, a sparse ring around it, and suburbs that look almost empty. On satellite imagery the suburbs are packed with houses. OpenStreetMap building coverage is excellent in much of Europe and patchy in much of the world, and incompleteness is not random: it follows where mappers live, which imports happened, and which humanitarian mapping campaigns chose to work. A density or morphology analysis on incomplete footprints measures mapping effort.
The fix is to measure completeness against an independent source before analysing, and to switch to — or fill from — a more complete layer where OSM falls short.
Quick answer
Compare OSM with Overture's buildings, which conflate OSM with machine-learned footprints, and look at which source each Overture building came from:
import duckdb, pandas as pd, geopandas as gpd, osmnx as ox

ox.settings.http_user_agent = "spatialworkflow-examples/1.0"
con = duckdb.connect()
con.execute("INSTALL spatial; LOAD spatial; INSTALL httpfs; LOAD httpfs; SET s3_region='us-west-2';")

def overture(w, s, e, n):
    df = con.execute(f"""
        SELECT sources[1].dataset AS source, ST_AsWKB(geometry) AS wkb
        FROM read_parquet('s3://overturemaps-us-west-2/release/2026-09-23.0/theme=buildings/type=building/*',
                          hive_partitioning = 1)
        WHERE bbox.xmin > {w} AND bbox.xmax < {e} AND bbox.ymin > {s} AND bbox.ymax < {n}""").df()
    return gpd.GeoDataFrame(df.drop(columns="wkb"),
                            geometry=gpd.GeoSeries.from_wkb(df.wkb.apply(bytes)), crs=4326)

AREAS = {"Den Haag centre": (4.300, 52.072, 4.320, 52.084),
         "Nairobi, Kibera and surroundings": (36.770, -1.325, 36.800, -1.300)}
for name, (w, s, e, n) in AREAS.items():
    osm = ox.features_from_bbox((w, s, e, n), {"building": True})
    osm = osm[osm.geom_type.isin(["Polygon", "MultiPolygon"])]
    ov = overture(w, s, e, n)
    crs = ov.estimate_utm_crs()
    print(f"{name}: OSM {len(osm):,} buildings ({osm.to_crs(crs).area.sum() / 1e6:.3f} km²), "
          f"Overture {len(ov):,} ({ov.to_crs(crs).area.sum() / 1e6:.3f} km²)")
    print("   Overture by source:", ov.source.value_counts().to_dict())
Den Haag centre: OSM 4,415 buildings (0.887 km²), Overture 4,208 (0.820 km²)
Overture by source: {'OpenStreetMap': 4208}
Nairobi, Kibera and surroundings: OSM 18,903 buildings (1.862 km²), Overture 26,233 (2.315 km²)
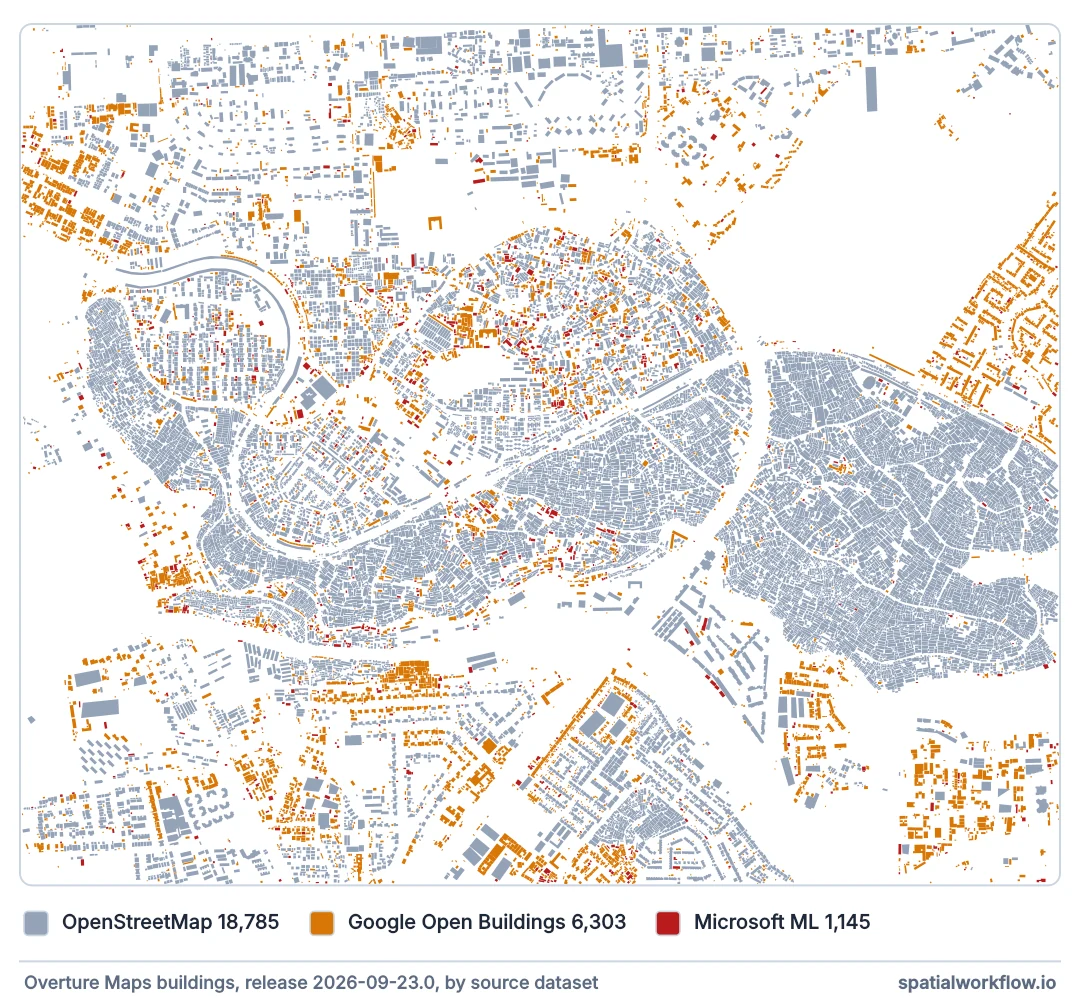
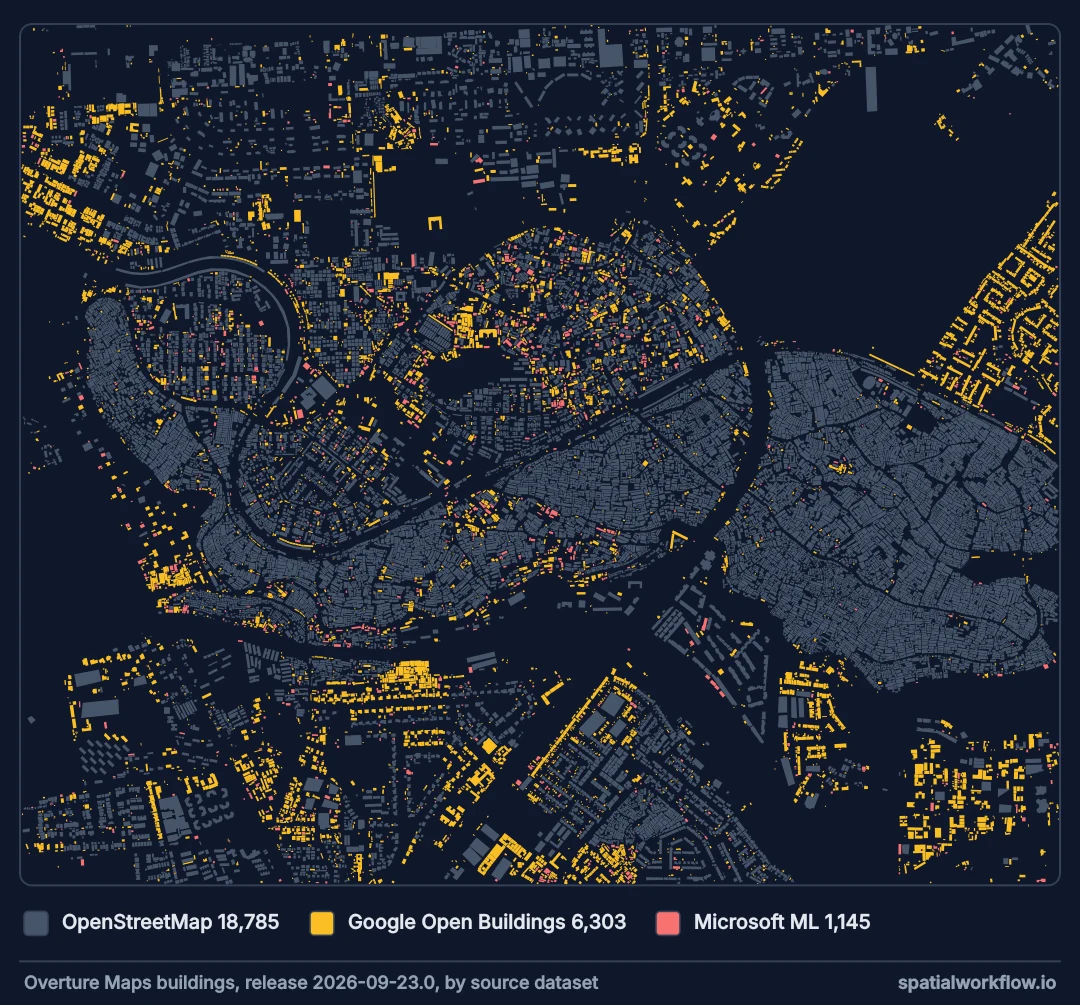
Overture by source: {'OpenStreetMap': 18785, 'Google Open Buildings': 6303, 'Microsoft ML Buildings': 1145}
In Den Haag every Overture building comes from OSM: OSM is the complete layer, and the two differ only by edge effects of the box. In Nairobi, 7,448 of Overture's 26,233 buildings — more than a quarter — come from Google's and Microsoft's machine-learned footprints, and those are buildings OSM does not have.
An independent reference, area comparisons, completeness maps
1. Pick an independent reference
A cadastre where one exists; otherwise machine-learned footprints (Microsoft, Google) or Overture's conflated layer, which records the source of each building.
2. Compare footprint area, not only counts
Counts depend on how attached buildings are divided. Covered area is the better completeness measure.
3. Map completeness, not just a total
Completeness varies block by block. A grid of OSM/reference area ratios shows where the gaps are and whether they correlate with the phenomenon being studied.
4. Choose: switch, fill or restrict
Use the reference instead; add reference buildings where OSM has none nearby; or restrict the analysis to areas where OSM is near complete. State which.
5. Re-check after filling
Combining sources can double-count buildings drawn in both. Remove reference footprints that overlap OSM ones before merging.
Completeness on a grid, and filling the gaps
The data used on this page
OpenStreetMap buildings fetched live through the Overpass API with OSMnx, and Overture Maps buildings (release 2026-09-23.0) read straight from Overture's public S3 bucket with DuckDB. overpass-api.de refuses connections from here, so the queries go to the maps.mail.ru mirror of the same API. OpenStreetMap is edited continuously, so its counts drift a little between runs; Overture's are fixed by the release. The OpenStreetMap answers are read as the Overpass mirror gave them on 10 October 2026.
import io
import os
import osmnx as ox
import requests
import zipfile

# OpenStreetMap as Overpass returned it on 10 October 2026, saved as osmnx's own cache so the counts
# below do not drift as OSM is edited; delete the cache folder to query live instead
if not os.path.exists("cache"):
    reply = requests.get("https://data.spatialworkflow.io/osm-cache-osm-buildings-missing-2026-10-10.zip", timeout=300)
    reply.raise_for_status()
    with zipfile.ZipFile(io.BytesIO(reply.content)) as archive:
        archive.extractall("cache")

ox.settings.overpass_url = "https://maps.mail.ru/osm/tools/overpass/api"
print("Overpass:", ox.settings.overpass_url)
Overpass: https://maps.mail.ru/osm/tools/overpass/api
Example 1 — completeness on a grid
import numpy as np
from shapely.geometry import box

w, s, e, n = AREAS["Nairobi, Kibera and surroundings"]
osm = ox.features_from_bbox((w, s, e, n), {"building": True})
osm = osm[osm.geom_type.isin(["Polygon", "MultiPolygon"])]
ov = overture(w, s, e, n)
crs = ov.estimate_utm_crs()
osm_m, ov_m = osm.to_crs(crs), ov.to_crs(crs)
x0, y0, x1, y1 = ov_m.total_bounds
grid = gpd.GeoDataFrame(geometry=[box(x, y, x + 500, y + 500) for x in np.arange(x0, x1, 500)
                                  for y in np.arange(y0, y1, 500)], crs=crs)
def area_in(g):
    parts = gpd.overlay(g[["geometry"]], grid.reset_index(), how="intersection")
    return parts.assign(a=parts.area).groupby("index").a.sum()
ratio = (area_in(osm_m) / area_in(ov_m)).reindex(grid.index)
print(f"{len(grid)} cells of 500 m; OSM/Overture footprint area ratio: "
      f"median {ratio.median():.2f}, cells under 0.5: {(ratio < 0.5).mean():.0%}")
42 cells of 500 m; OSM/Overture footprint area ratio: median 0.85, cells under 0.5: 12%
Most cells are fairly complete — Kibera has been mapped intensively by community projects — but the median cell still has 15% less footprint area in OSM, and one cell in eight has less than half. A density map built from OSM here would show those cells as sparse neighbourhoods, when what is sparse is the mapping.
Example 2 — what the gap does to a density measure
cov_osm = osm_m.area.sum() / grid.area.sum()
cov_ov = ov_m.area.sum() / grid.area.sum()
print(f"building coverage from OSM:      {cov_osm:.1%}")
print(f"building coverage from Overture: {cov_ov:.1%}")
building coverage from OSM: 17.7%
building coverage from Overture: 22.0%
OSM implies a fifth less building coverage than Overture over the same 42 cells. Every downstream measure — coverage, tessellation cell sizes, fabric clusters — inherits the gap.
Example 3 — fill without double counting
extra = ov_m[ov_m.source != "OpenStreetMap"]
overlaps = gpd.sjoin(extra[["geometry"]], osm_m[["geometry"]], predicate="intersects")
fill = extra.drop(index=overlaps.index.unique())
merged = gpd.GeoDataFrame(pd.concat([osm_m[["geometry"]].assign(source="OpenStreetMap"),
                                     fill[["geometry", "source"]]]), crs=crs)
print(f"added {len(fill):,} non-overlapping machine-learned footprints; "
      f"merged coverage {merged.area.sum() / grid.area.sum():.1%}")
added 7,448 non-overlapping machine-learned footprints; merged coverage 22.5%
Overture has already done this conflation; the example shows the logic for combining any two sources. Keep the source column so later analyses can test sensitivity to it.
Why OSM completeness is uneven
Why OSM completeness is uneven
OSM is mapped by people. Countries with active communities and large imports of official data are near complete; many cities in the Global South were mapped in bursts by humanitarian projects that covered some districts thoroughly and left others empty. The gaps are systematic and often correlate with poverty and informality — exactly the places many analyses care about.
Why machine-learned footprints fill the gap
Models trained on satellite imagery can detect most buildings everywhere imagery is recent. They merge attached buildings, miss some small structures and occasionally hallucinate, but their coverage is consistent. Overture combines them with OSM, preferring OSM where it exists.
Why the source must stay in the data
A morphological measure computed partly on hand-mapped and partly on machine-learned footprints mixes two definitions of "a building". Keeping the source per footprint lets you check whether a pattern is real or an artefact of where each source dominates.
Imports, merged footprints and recent construction
- Import quality: some imported footprints are old or offset; completeness is not correctness.
- Machine-learned merges: terraces become one polygon, which lowers counts and raises median sizes.
- Recent construction may be in neither source; imagery dates matter in fast-growing cities.
- Overture releases update the conflation monthly; pin the release.
- Licences: OSM is ODbL; machine-learned datasets have their own licences — Overture records them.
Internal links
- How to download building footprints from OSM and Overture — both sources in detail
- OpenStreetMap data model explained — how OSM is made
- Occurrence bias explained — the same "map of effort" problem in species data
- Urban morphology explained — what incomplete footprints distort
- Tessellation fails or produces odd cells — the other footprint problem
- How to calculate coverage and floor area ratio — a measure that inherits the gap
FAQ
How complete is OpenStreetMap building data?
Near complete in much of Europe and North America; highly variable elsewhere. Measure it for your area.
How do I check OSM completeness?
Compare footprint area with an independent source — a cadastre, machine-learned footprints or Overture — on a grid.
What is Overture's building layer?
A conflation of OSM with machine-learned and other building datasets, published as GeoParquet with a source for each building.
Can I merge OSM with machine-learned footprints?
Yes, adding only reference footprints that do not overlap OSM ones, and keeping a source column.
Does missing data bias density maps?
Yes — systematically towards where mapping has happened.
Which source should I use outside Europe?
Usually Overture or a machine-learned dataset, checked against imagery for your area.