
How to Analyse Noise Complaints by Hour, Weekday and Season
On this page
Problem statement
Noise is New York's most common 311 complaint after illegal parking, and it has a rhythm: late at night, on weekends, in summer — or so the usual story goes. The 311 data can test it. Every noise complaint has a timestamp to the second, a type (residential, street, commercial, vehicle, helicopter, park, house of worship) and a descriptor, and a year of daily counts shows the seasons. This guide breaks July 2025's 64,113 noise complaints down by hour and weekday, puts them in the context of the whole year, and compares boroughs per resident.
Quick answer
Filter complaint types starting with "Noise", cross-tabulate created_date.dt.dayofweek against created_date.dt.hour, and plot the 7 × 24 grid. Use the daily counts for the season and divide by population for places.
nz = july[july.complaint_type.str.startswith("Noise")]
hw = pd.crosstab(nz.created_date.dt.dayofweek, nz.created_date.dt.hour)
print(f"July 2025 noise complaints: {len(nz):,} ({len(nz) / len(july):.1%} of all requests)")
pk = hw.stack().idxmax()
print(f"busiest hour: {['Mon', 'Tue', 'Wed', 'Thu', 'Fri', 'Sat', 'Sun'][pk[0]]} {pk[1]}:00 ({hw.values.max():,} complaints in the month)")
print("share by hour band:", nz.created_date.dt.hour.pipe(lambda h: pd.cut(h, [-1, 5, 11, 17, 21, 23], labels=["0-5", "6-11", "12-17", "18-21", "22-23"])).value_counts(normalize=True).sort_index().round(3).to_dict())
July 2025 noise complaints: 64,113 (20.3% of all requests)
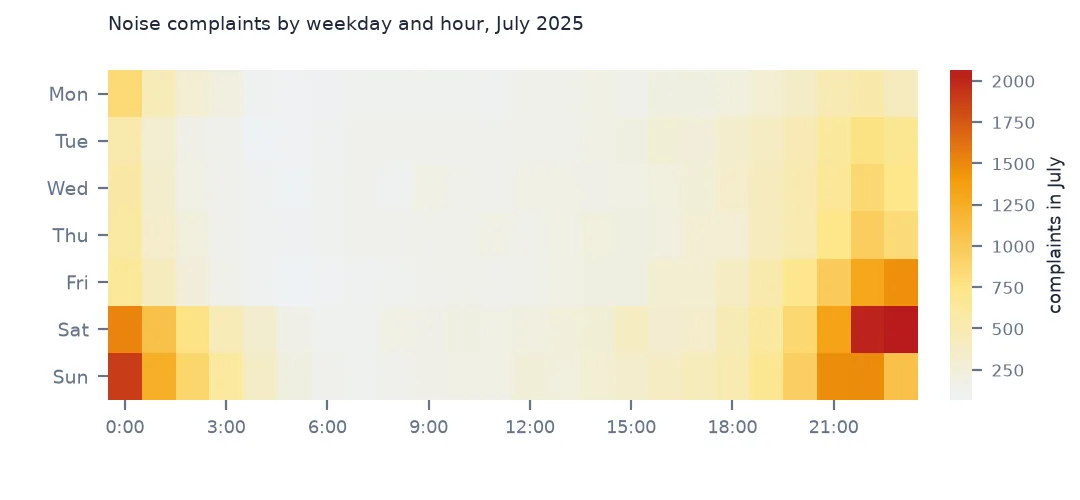
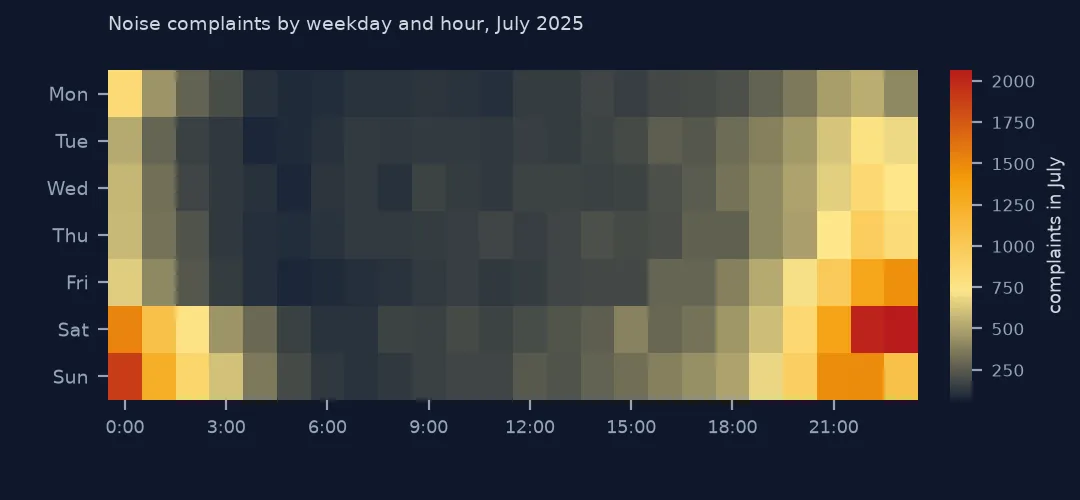
busiest hour: Sat 23:00 (2,065 complaints in the month)
share by hour band: {'0-5': 0.269, '6-11': 0.09, '12-17': 0.148, '18-21': 0.256, '22-23': 0.237}
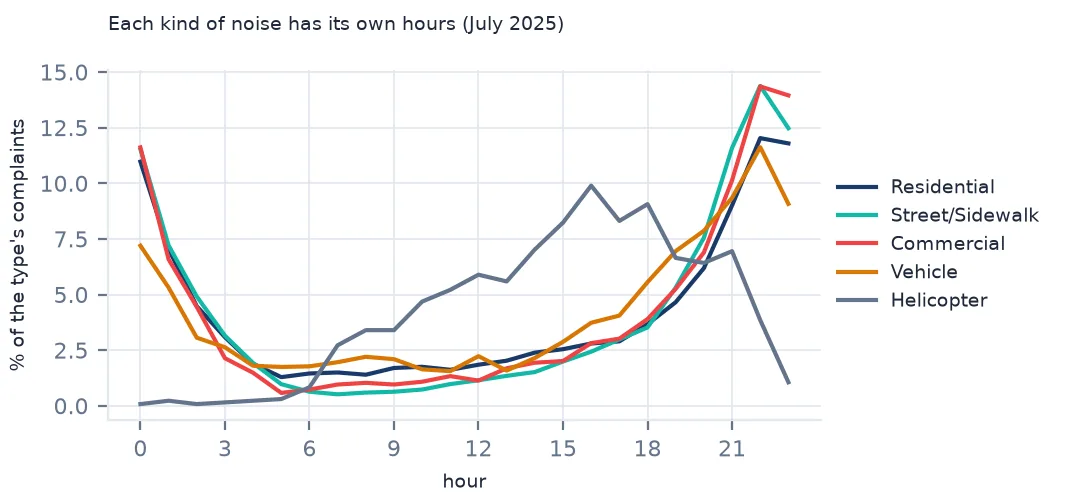
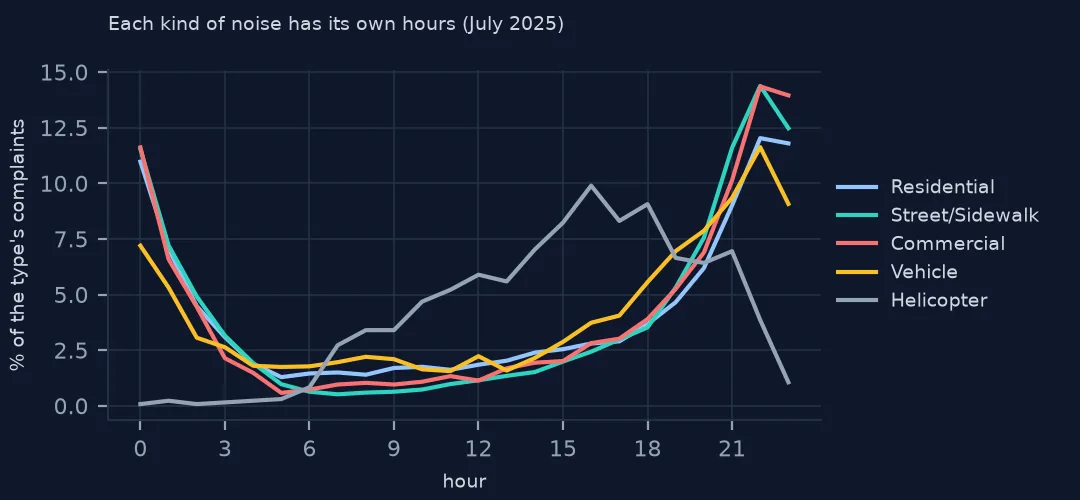
Noise made up 20.3% of July's requests: 64,113 complaints. The busiest hour of the week was Saturday at 23:00, with 2,065 complaints in the month. Half of all noise complaints come between 18:00 and midnight (25.6% from 18:00 to 21:59 and 23.7% from 22:00 to 23:59), and another 26.9% between midnight and 6:00; mornings are quiet (9.0%).
Hour, weekday and season
1. Five kinds of noise
print(nz.complaint_type.value_counts().to_dict())
print("residential descriptors:", nz[nz.complaint_type == "Noise - Residential"].descriptor.value_counts().head(4).to_dict())
{'Noise - Residential': 26659, 'Noise - Street/Sidewalk': 23287, 'Noise - Commercial': 3978, 'Noise - Vehicle': 3725, 'Noise': 3604, 'Noise - Helicopter': 1324, 'Noise - Park': 1239, 'Noise - House of Worship': 297}
residential descriptors: {'Loud Music/Party': 15990, 'Banging/Pounding': 7952, 'Loud Talking': 2437, 'Loud Television': 280}
Residential noise (26,659) and street or sidewalk noise (23,287) dominate; commercial, vehicle and generic noise each add a few thousand, and helicopters 1,324. Within residential noise, loud music or parties are the largest group (15,990), then banging or pounding (7,952).
2. The weekend night
night = nz.created_date.dt.hour.isin([22, 23, 0, 1, 2])
wk = nz.created_date.dt.dayofweek
print(f"share of complaints at night (22:00-02:59): weekdays {night[wk < 5].mean():.1%}, Saturday and Sunday {night[wk >= 5].mean():.1%}")
share of complaints at night (22:00-02:59): weekdays 41.1%, Saturday and Sunday 49.4%
Weekend nights are noisier: 49.4% of Saturday and Sunday complaints come between 22:00 and 02:59, against 41.1% on weekdays.
3. The year
n = daily[daily.complaint_type.str.startswith("Noise")]
mo = n.groupby(n.day.dt.month).n.sum()
print("noise complaints by month, 2025:", mo.to_dict())
d = n.groupby("day").n.sum()
print("busiest days:", d.nlargest(3).rename(lambda x: f"{x:%a %d %b}").to_dict())
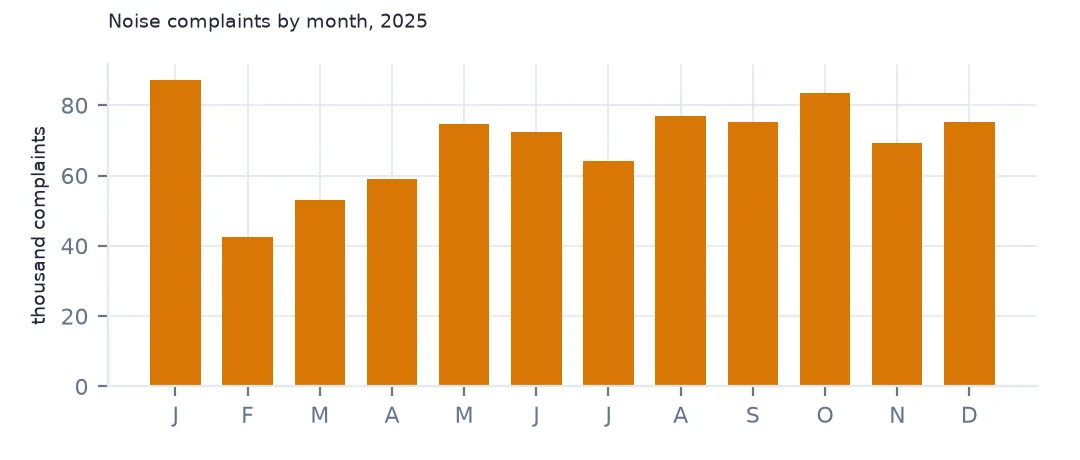
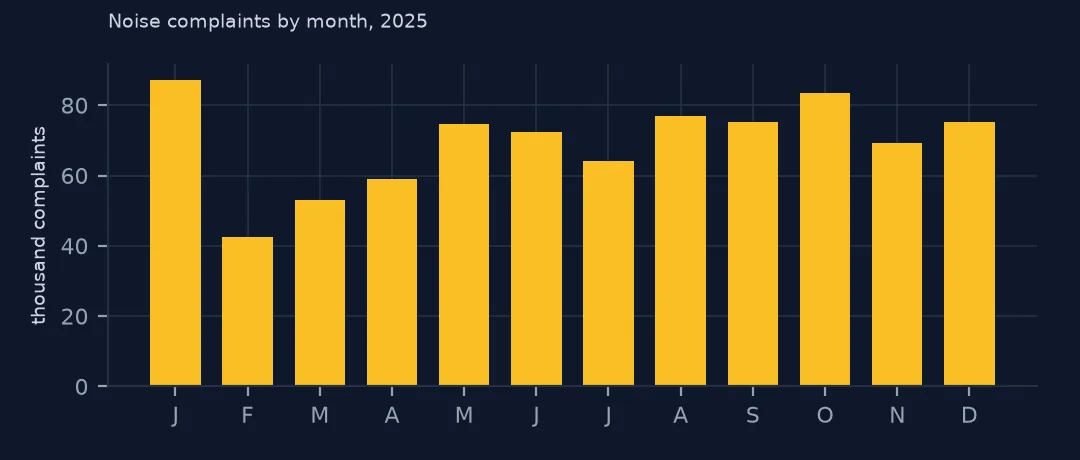
noise complaints by month, 2025: {1: 87250, 2: 42507, 3: 53122, 4: 59123, 5: 74541, 6: 72281, 7: 64113, 8: 76841, 9: 75320, 10: 83353, 11: 69255, 12: 75294}
busiest days: {'Sun 05 Jan': 6647, 'Wed 01 Jan': 5539, 'Sun 12 Jan': 5515}
Across 2025, noise complaints were lowest in February (42,507) and highest in January (87,250), not in summer; the three busiest single days were all in January, the busiest Sunday 5 January with 6,647. From May to December the counts stay between 64,113 (July) and 83,353 (October) a month. The data does not say why January was so high; the descriptor mix is the place to look before explaining it.
4. Where
nb = n.groupby("borough").n.sum()
print("noise complaints per 1,000 residents, 2025:", (1000 * nb / boro_pop).dropna().round(1).sort_values(ascending=False).to_dict())
noise complaints per 1,000 residents, 2025: {'BRONX': 189.4, 'MANHATTAN': 107.8, 'BROOKLYN': 73.1, 'QUEENS': 63.9, 'STATEN ISLAND': 35.6}
Per resident, the Bronx files by far the most noise complaints — 189.4 per 1,000 people in 2025 — against 107.8 in Manhattan, 73.1 in Brooklyn and 35.6 on Staten Island. Density, housing type and reporting habits all contribute.
How complaints are closed, and bars at night
The data used on this page
NYC 311 noise complaints: every request created in July 2025 and the 2025 daily counts (NYC Open Data, saved copies), and NYC City Planning's 2020 Census borough populations.
from pathlib import Path

import geopandas as gpd
import numpy as np
import pandas as pd
import requests

Path("data").mkdir(exist_ok=True)
# NYC 311 Service Requests (NYC Open Data, dataset erm2-nwe9) as queried on 15 October 2026 and saved on this site,
# because requests that are still open keep changing: every request created in July 2025, and the 2025 daily counts by
# agency, complaint type, borough and channel. The queries are in data/README.txt; the live API is
# https://data.cityofnewyork.us/resource/erm2-nwe9.csv
FILES = ["nyc-311-2025-daily-counts-2026-10-15.zip", "nyc-311-2025-07-requests-2026-10-15.zip", "nyc-census-2020-by-geography-2026-10-15.xlsx"]
for name in FILES:
    if not Path(f"data/{name}").exists():
        Path(f"data/{name}").write_bytes(requests.get(f"https://data.spatialworkflow.io/{name}", timeout=600).content)
daily = pd.read_csv("data/nyc-311-2025-daily-counts-2026-10-15.zip", parse_dates=["day"])
july = pd.read_csv("data/nyc-311-2025-07-requests-2026-10-15.zip", low_memory=False,
                   dtype={"unique_key": str, "incident_zip": str, "bbl": str, "community_board": str},
                   parse_dates=["created_date", "closed_date", "resolution_action_updated_date"])
cen = pd.read_excel("data/nyc-census-2020-by-geography-2026-10-15.xlsx", sheet_name="2010, 2020, and Change", skiprows=3)
boro_pop = cen[cen.GeoType == "Boro"].assign(b=lambda d: d.Name.str.upper()).set_index("b").Pop_20
print(f"NYC 311: {daily.n.sum():,} requests in the 2025 daily counts; {len(july):,} requests created in July 2025")
NYC 311: 3,655,042 requests in the 2025 daily counts; 315,883 requests created in July 2025
Example 1: how the police close noise complaints
res = nz.assign(minutes=(nz.closed_date - nz.created_date).dt.total_seconds() / 60)
print(f"median minutes to close a July noise complaint: {res.minutes.median():.0f}; within an hour {(res.minutes < 60).mean():.1%}")
median minutes to close a July noise complaint: 59; within an hour 50.6%
The police close the median July noise complaint in 59 minutes, and 50.6% within an hour. Closure means a response, not silence: the resolution text often records that officers found no evidence of the violation.
Example 2: commercial noise by hour
cm = nz[nz.complaint_type == "Noise - Commercial"].created_date.dt.hour.value_counts(normalize=True).sort_index()
print(f"commercial noise between 22:00 and 03:59: {cm.loc[[22, 23, 0, 1, 2, 3]].sum():.1%}")
commercial noise between 22:00 and 03:59: 53.1%
Commercial noise is the most nocturnal type: 53.1% arrives between 22:00 and 03:59, when bars and clubs are open and neighbours are trying to sleep.
Complaints, not decibels
A noise complaint records that someone was bothered enough to report it at that moment, not a sound level. The hourly pattern mixes when noise happens with when people are home and trying to sleep: a midday jackhammer may be louder than a late party but draws fewer complaints. The Bronx's high rate per resident reflects the noise, the density of apartment buildings with shared walls, and how readily residents call 311 rather than confronting neighbours.
For a measure of actual sound, the city has noise monitoring projects and sensor networks; 311 is the record of annoyance, which is what noise policy is ultimately about.
Pitfalls with noise data
- Repeat callers. A single party can produce many complaints; residential noise repeats at the same address within 24 hours in about a third of cases (311 duplicates).
- Time zone. Timestamps are local New York time; keep them naive and local.
- Generic "Noise". Some complaints use the plain type without a category; include or exclude it consistently.
- Helicopter noise has no useful location in many records; leave it out of street-level maps.
Internal links
- How to map 311 complaints per resident — noise per neighbourhood
- How to relate heat complaints to temperature — the other seasonal complaint
- How to analyse the hourly traffic profile — another city rhythm by hour
FAQ
When do New Yorkers make the most noise complaints?
Late at night and on weekends: in July 2025 the busiest hour was Saturday at 23:00, and half of complaints came between 18:00 and midnight.
Which borough has the most noise complaints?
Per resident, the Bronx: 189.4 per 1,000 people in 2025.