
How to Get Railway Lines and Stations From OpenStreetMap in Python
On this page
Problem statement
OpenStreetMap holds the most detailed open map of railways anywhere: main lines, metro, light rail and trams, with tracks, tunnels, stations and platforms. Extracting a rail network means knowing how it is modelled. Track is mapped as railway=rail, subway, light_rail or tram lines, often one way per track. Stations are nodes or areas with railway=station. The named services, such as Metro's Red Line, are route relations that group the tracks.
This page extracts the rail network of Washington, D.C. from the OpenStreetMap extract of 1 January 2026. It measures track length by type and how much of the Metro runs underground, lists the stations by type, and reads the route relations for the Metro lines.
Quick answer
Read the railway ways as lines and sum their length by type:
fp = (osmium.FileProcessor(str(PBF)).with_locations().with_filter(osmium.filter.EntityFilter(osmium.osm.WAY))
      .with_filter(osmium.filter.KeyFilter("railway"))
      .with_filter(osmium.filter.GeoInterfaceFilter(tags=["railway", "name", "tunnel", "service", "usage"])))
R = gpd.GeoDataFrame.from_features(fp, crs=4326)
R = gpd.clip(R[R.geom_type == "LineString"], DC).to_crs(32618)
R["km"] = R.length / 1000
print(f"{len(R):,} railway ways inside D.C.")
print(R.groupby("railway").km.sum().sort_values(ascending=False).head(8).round(1).to_string())
1,058 railway ways inside D.C.
railway
rail 136.9
subway 135.3
abandoned 23.1
platform 15.0
tram 9.5
disused 7.7
light_rail 1.7
turntable 0.1
Inside the District there are 1,058 railway ways. Main-line rail (136.9 km) and subway (135.3 km) dominate; the streetcar adds 9.5 km of tram. Platforms add 15.0 km of railway=platform ways that are not track at all, and abandoned and disused lines another 30.8 km.
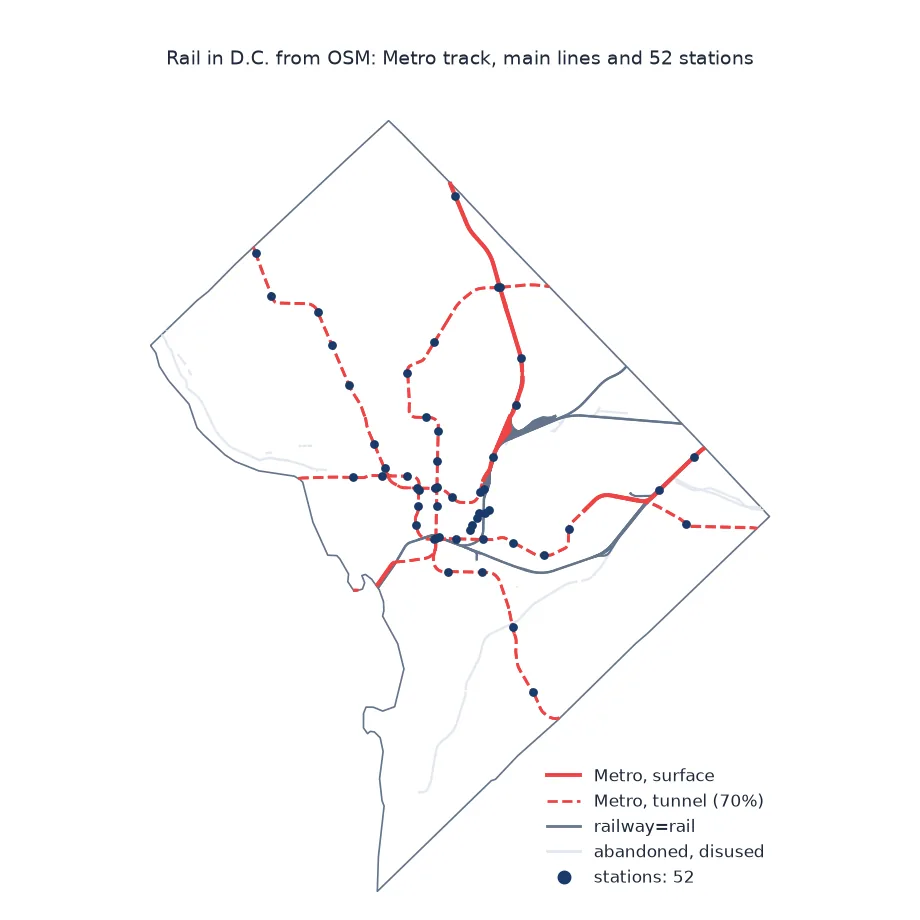
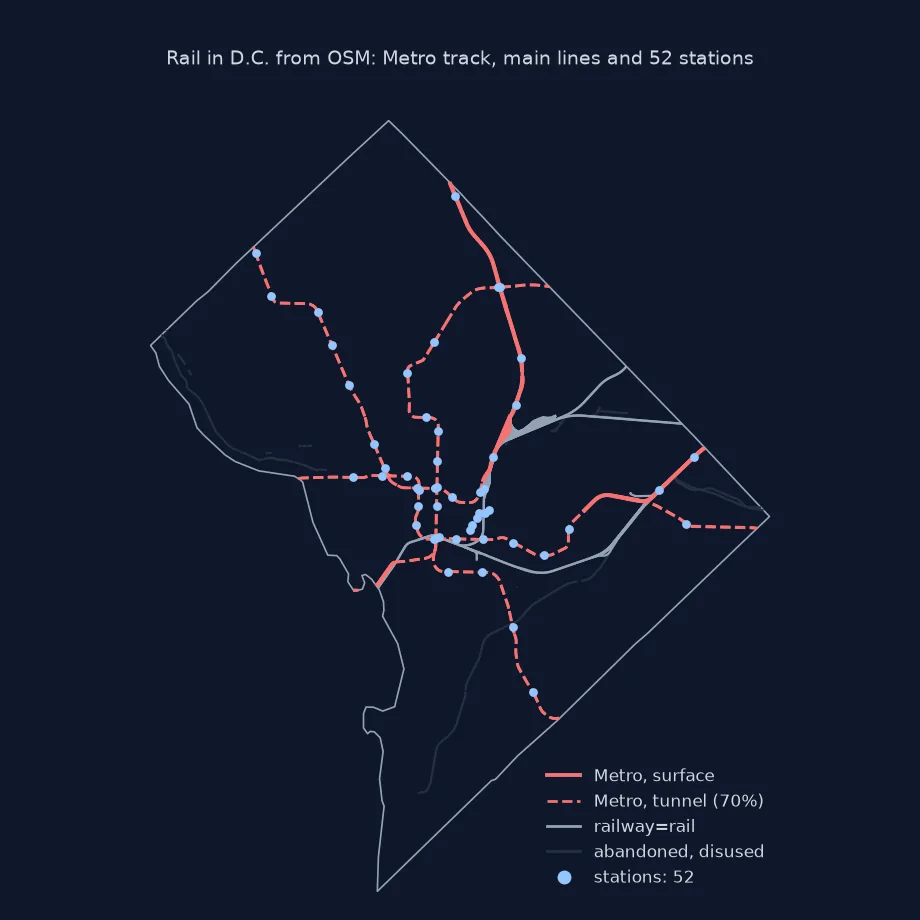
Main line, sidings and Metro, stations, route relations
1. Main line, sidings and the Metro underground
railway=rail includes yards and sidings, marked with service=*. The Metro is railway=subway, with tunnels tagged tunnel=yes:
rail = R[R.railway == "rail"]
print(f"rail: {rail.km.sum():.1f} km, of which yards, sidings and spurs (service=*): {rail.loc[rail.service.notna(), 'km'].sum():.1f} km")
sub = R[R.railway == "subway"]
under = sub.tunnel.isin(["yes", "building_passage"])
print(f"subway: {sub.km.sum():.1f} km of track ways; in tunnels: {sub.loc[under, 'km'].sum():.1f} km ({sub.loc[under, 'km'].sum() / sub.km.sum():.0%})")
rail: 136.9 km, of which yards, sidings and spurs (service=*): 47.7 km
subway: 135.3 km of track ways; in tunnels: 95.0 km (70%)
Of the 136.9 km of rail, 47.7 km are yards, sidings and spurs. Of the 135.3 km of Metro track ways, 95.0 km, 70%, run in tunnels: a map that hides tunnels loses most of the Metro inside the District.
2. Stations
Stations are tagged railway=station, with station=subway for the Metro and station=light_rail for the streetcar:
fp = (osmium.FileProcessor(str(PBF)).with_areas().with_filter(osmium.filter.TagFilter(("railway", "station")))
      .with_filter(osmium.filter.GeoInterfaceFilter(tags=["name", "station", "network"])))
S = gpd.GeoDataFrame.from_features(fp, crs=4326)
S = S[S.geom_type != "LineString"]
S = S[S.to_crs(32618).representative_point().to_crs(4326).within(DC.geometry.iloc[0])]
print(f"stations inside D.C.: {len(S)}; by type {S.station.fillna('(train)').value_counts().to_dict()}")
print("train stations:", sorted(S[S.station.isna()].name.dropna().unique()))
stations inside D.C.: 52; by type {'subway': 44, 'light_rail': 6, '(train)': 2}
train stations: ["L'Enfant", 'Washington Union Station']
The District has 52 stations: 44 tagged as Metro stations, 6 light-rail (streetcar) stops, and 2 train stations, Union Station and L'Enfant.
3. The Metro lines as route relations
Each Metro line is a route=subway relation listing its stops and tracks. DuckDB reads the relations and their tags directly:
con = duckdb.connect(); con.sql("INSTALL spatial; LOAD spatial")
routes = con.sql(f"""SELECT tags['name'] AS name, tags['colour'] AS colour, len(refs) AS members
                     FROM ST_ReadOSM('{PBF}') WHERE kind = 'relation' AND tags['route'] = 'subway' ORDER BY name""").df()
print(f"route=subway relations: {len(routes)}")
print(routes.to_string(index=False))
route=subway relations: 14
name colour members
WMATA Blue Line: Downtown Largo → Franconia–Springfield #009CDE 150
WMATA Blue Line: Franconia–Springfield → Downtown Largo #009CDE 154
WMATA Green Line: Branch Avenue → Greenbelt #00B140 94
WMATA Green Line: Greenbelt → Branch Avenue #00B140 94
WMATA Orange Line: New Carrollton → Vienna/Fairfax–GMU #ED8B00 142
WMATA Orange Line: Vienna/Fairfax–GMU → New Carrollton #ED8B00 121
WMATA Red Line: Glenmont → Shady Grove #BF0D3E 131
WMATA Red Line: Shady Grove → Glenmont #BF0D3E 133
WMATA Silver Line: Ashburn → Downtown Largo #919D9D 204
WMATA Silver Line: Ashburn → New Carrollton #919D9D 197
WMATA Silver Line: Downtown Largo → Ashburn #919D9D 205
WMATA Silver Line: New Carrollton → Ashburn #919D9D 200
WMATA Yellow Line: Huntington → Mount Vernon Square #FFD100 65
WMATA Yellow Line: Mount Vernon Square → Huntington #FFD100 67
The 14 route=subway relations are the six Metro lines, one relation per direction, with extra variants for the Silver Line to Downtown Largo and New Carrollton; the Yellow Line's pair runs between Huntington and Mount Vernon Square. Each carries its colour, for example #BF0D3E for the Red Line.
Abandoned and disused lines
The data used on this page
The Geofabrik OpenStreetMap extract for the District of Columbia dated 1 January 2026 (© OpenStreetMap contributors, ODbL), clipped to the District's boundary from the US Census Bureau's 2023 cartographic boundary files at 1:500,000.
from pathlib import Path

import duckdb
import geopandas as gpd
import osmium
import requests

Path("data").mkdir(exist_ok=True)
def cached(path, url):
    p = Path(path)
    if not p.exists():
        r = requests.get(url, timeout=600)
        r.raise_for_status()
        p.write_bytes(r.content)
    return p
PBF = cached("data/district-of-columbia-260101.osm.pbf", "https://download.geofabrik.de/north-america/us/district-of-columbia-260101.osm.pbf")
C = gpd.read_file(cached("data/cb_2023_us_county_500k.zip", "https://www2.census.gov/geo/tiger/GENZ2023/shp/cb_2023_us_county_500k.zip"))
DC = C[C.GEOID == "11001"].to_crs(4326)
print("boundary loaded")
boundary loaded
The District boundary is loaded for clipping.
Example 1: abandoned and disused lines
Old railways stay in OSM with lifecycle values such as abandoned and disused. Measure them separately:
old = R[R.railway.isin(["abandoned", "disused", "razed"])]
print(f"abandoned or disused railway: {old.km.sum():.1f} km in {len(old)} ways")
print(old.groupby("railway").km.sum().round(1).to_dict())
abandoned or disused railway: 30.8 km in 77 ways
{'abandoned': 23.1, 'disused': 7.7}
30.8 km of railway in 77 ways are abandoned or disused lines that stay in OSM for their history.
Infrastructure separated from service
OpenStreetMap separates infrastructure from service. The infrastructure is the track: each railway=* way is a stretch of track, or of a track group on simpler maps, with tags for its type (rail, subway, light_rail, tram, narrow_gauge), its role (usage=main, service=siding, yard or spur), and its situation (tunnel=yes, bridge=yes). Stations are features of their own, tagged railway=station with public_transport=station, and platforms are separate again. The service, a named line that trains run along, is a route relation that lists the tracks and stops in order, one per direction in the public transport scheme.
That modelling explains the usual surprises. Track length is not route length, because double track counts twice and yards add kilometres no passenger travels. A station count depends on which tags are used, since old and new public transport tagging coexist. Underground lines are in the map but drawn with tunnel=yes and often a negative layer, so a map that hides tunnels makes most of the Metro disappear from downtown. Lifecycle values such as abandoned and disused keep old lines in the data, useful for history but to be excluded from today's network.
Route geometry, platforms and level crossings
- Route geometry: assembling a line's shape from its relation means ordering member ways; for timetabled services, GTFS shapes are often easier.
- Platforms:
railway=platformandpublic_transport=platformare separate features, useful for station footprints. - Level crossings: nodes tagged
railway=level_crossingmark where roads cross track at grade. - Extract edges: lines crossing the boundary are cut by the extract and again by the clip.
Internal links
- How to map transit routes and stops from GTFS shapes — the timetable side
- How to get roads by type from OpenStreetMap in Python — the road network
- How to read an OpenStreetMap PBF file in Python — reading the extract
FAQ
How do I get railway lines from OpenStreetMap?
Filter ways with the railway key and group by its value: rail, subway, light_rail and tram are track; exclude abandoned and disused.
How do I find train stations in OSM?
Look for railway=station; station=subway and station=light_rail mark metro and light-rail stations.
Why is the railway length so much longer than the line?
Each track is mapped separately, and yards and sidings add length.
How do I get a metro line like the Red Line?
Read the route=subway relations; each lists the tracks and stops of one line, often one relation per direction.