
SAR scenes from different dates do not line up
On this page
Problem statement
Two Sentinel-1 scenes of the same place refuse to stack. The arrays have different shapes, or they have the same shape and the coastline sits a few pixels off, or they align perfectly and the difference between them shows change everywhere — brightest on slopes and in towns, where nothing has happened.
These are three different problems with one root: "the same place" is not enough. A stack needs the same grid, the same relative orbit, and the same product. The grid problem is mechanical and easy to fix. The orbit problem is physical: two passes from different tracks see the ground from different angles, and their difference is geometry, not change.
Quick answer
Read every pass onto one grid you define, and keep relative orbits apart:
import numpy as np
from sar_io import search, passes, grid, read_pass, to_db

bbox = [-0.46, 39.25, -0.33, 39.45]
g = grid(bbox, "EPSG:25830")                        # one grid for everything

P = passes(search(bbox, "2024-07-01/2024-07-31"))
shapes, orbits = set(), {}
for (day, orbit), frames in P.items():
    a = read_pass(frames, "vv", g)
    shapes.add(a.shape)
    orbits.setdefault(orbit, []).append(to_db(np.nanmean(a)))
print("distinct array shapes:", shapes)
for orbit, vals in sorted(orbits.items()):
    print(f"orbit {orbit:3d}: scene mean {np.mean(vals):6.2f} dB over {len(vals)} passes")
distinct array shapes: {(2252, 1184)}
orbit 8: scene mean -4.86 dB over 2 passes
orbit 30: scene mean -5.76 dB over 2 passes
orbit 103: scene mean -5.60 dB over 3 passes
orbit 110: scene mean -4.96 dB over 3 passes
Every array has the same shape because they were all read onto the same grid. The means still differ by orbit, and no reprojection can remove that.
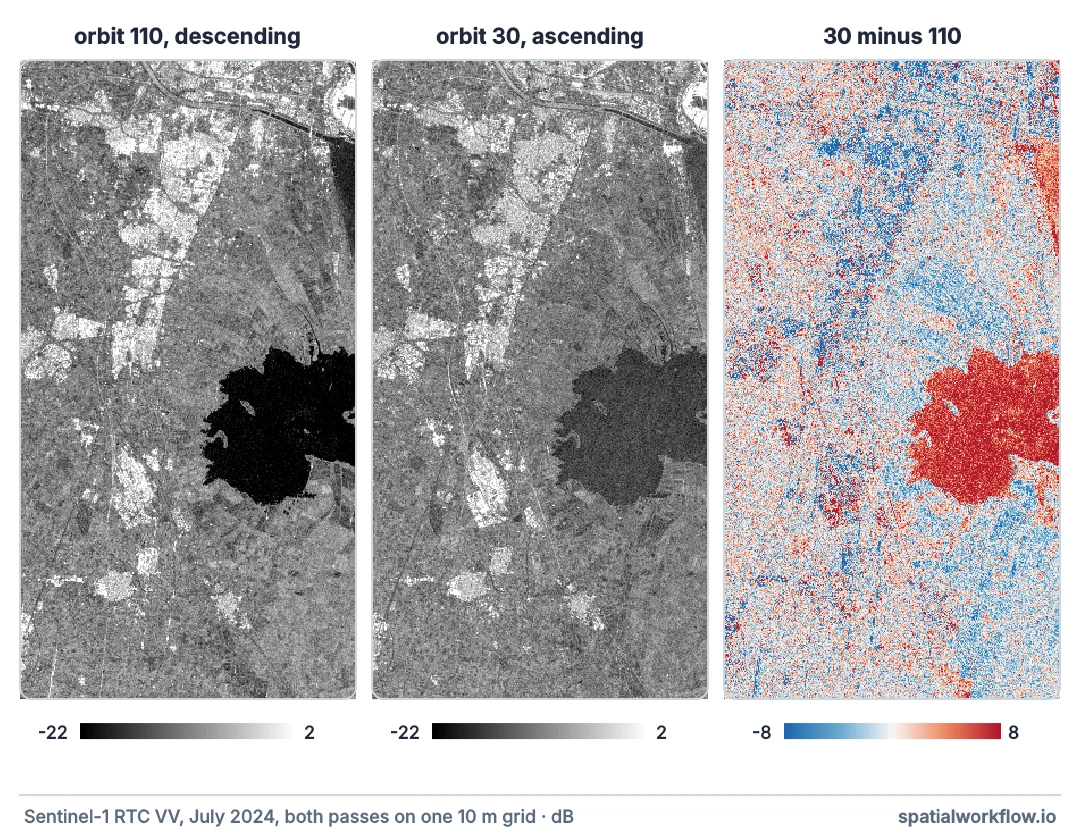
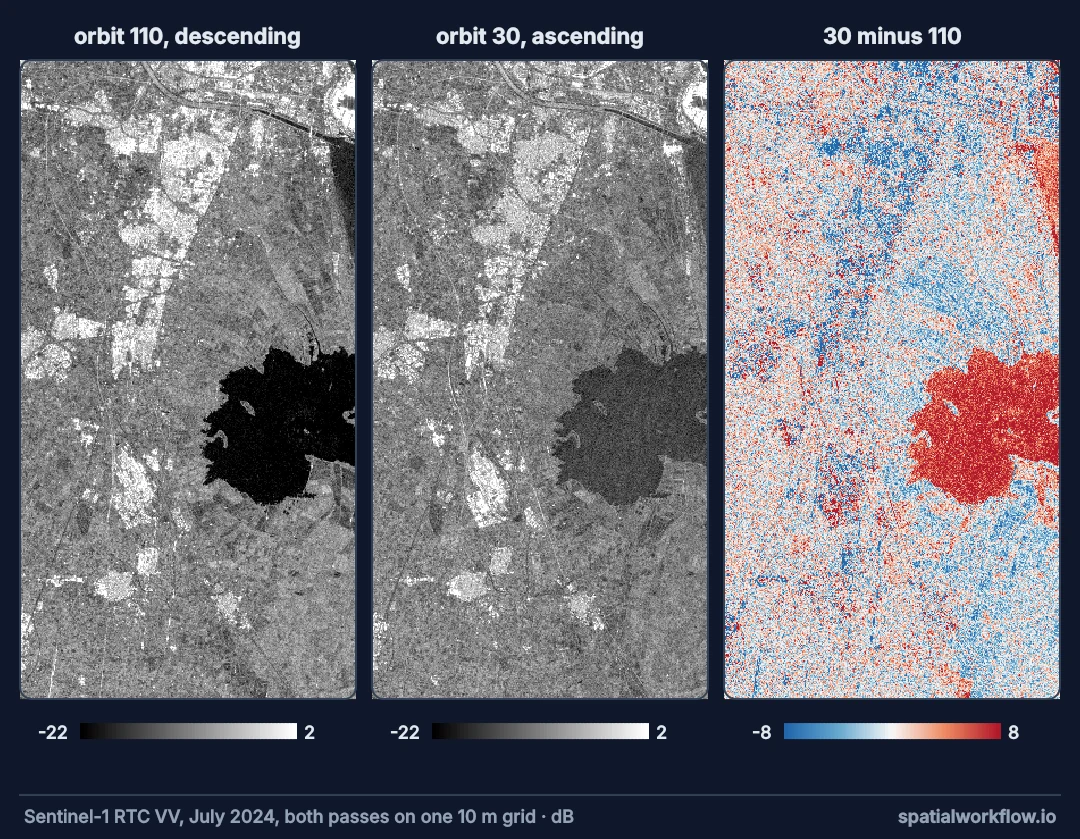
One grid, one relative orbit, one pass direction
1. Define the grid once
CRS, resolution and bounds fixed in code, and every read warped onto it. Do not take the grid from whichever file loaded first.
2. Do not stack across relative orbits
Group by sat:relative_orbit. Analyse each orbit as its own series, or use them as separate features.
3. Do not stack ascending with descending
They look from opposite sides. On flat farmland the difference is small; on slopes and in cities it is large.
4. Check the geolocation
Sentinel-1 products are usually located to within a few metres. Larger offsets appear when products were processed with predicted rather than precise orbits — s1:orbit_source says which.
5. Compare against a stable surface
Correlate two dates over an area that cannot have changed — a car park, a runway, bare rock. A systematic offset shows as a shifted correlation peak; geometry differences show as a brightness offset with no shift.
6. Fix what can be fixed, and report what cannot
A grid mismatch is fixed by reading again. An orbit mismatch is fixed by dropping passes. A geolocation error of a metre is reported, not corrected.
Same-orbit pairs against mixed pairs
The data used on this page
Sentinel-1 radiometrically terrain-corrected backscatter (sentinel-1-rtc) from the Microsoft Planetary Computer, read through sar_io.py — the small module from the reading guide that searches, groups frames into passes and mosaics each pass onto a fixed grid.
%%writefile sar_io.py
"""Find, read and mosaic Sentinel-1 RTC scenes from Microsoft Planetary Computer."""
from collections import defaultdict

import numpy as np
import planetary_computer
import pystac_client
import rasterio
from rasterio.enums import Resampling
from rasterio.transform import from_origin
from rasterio.vrt import WarpedVRT
from rasterio.warp import transform_bounds

STAC = "https://planetarycomputer.microsoft.com/api/stac/v1"


def search(bbox, dates, orbit=None, direction=None, collection="sentinel-1-rtc"):
    """Items over bbox (lon/lat) in a date range, filtered by relative orbit and pass direction."""
    cat = pystac_client.Client.open(STAC, modifier=planetary_computer.sign_inplace)
    items = cat.search(collections=[collection], bbox=bbox, datetime=dates).item_collection()
    keep = [i for i in items
            if (orbit is None or i.properties["sat:relative_orbit"] == orbit)
            and (direction is None or i.properties["sat:orbit_state"] == direction)]
    return sorted(keep, key=lambda i: i.datetime)


def passes(items):
    """Group frames into passes: same day, same relative orbit."""
    groups = defaultdict(list)
    for i in items:
        groups[(i.datetime.date(), i.properties["sat:relative_orbit"])].append(i)
    return dict(sorted(groups.items()))


def grid(bbox, crs, res=10):
    """A fixed target grid: every pass is read onto this, so arrays line up."""
    left, bottom, right, top = transform_bounds(4326, crs, *bbox)
    width, height = int((right - left) // res), int((top - bottom) // res)
    return {"crs": crs, "transform": from_origin(left, top, res, res),
            "width": width, "height": height}


def read_pass(frames, band, g):
    """Mosaic one pass's frames for one band onto grid g. Linear power; NaN where no data."""
    out = np.full((g["height"], g["width"]), np.nan, dtype="float32")
    for item in frames:
        with rasterio.open(item.assets[band].href) as src, WarpedVRT(
                src, crs=g["crs"], transform=g["transform"], width=g["width"],
                height=g["height"], resampling=Resampling.bilinear, nodata=np.nan) as vrt:
            a = vrt.read(1)
        a[a <= 0] = np.nan                       # -32768 nodata and zero-padding
        fill = np.isnan(out) & np.isfinite(a)
        out[fill] = a[fill]
    return out


def to_db(linear):
    return 10 * np.log10(linear)
Overwriting sar_io.py
Example 1 — the same-orbit pair against the mixed pair
same = [to_db(read_pass(P[k], "vv", g)) for k in P if k[1] == 110]
mixed = [to_db(read_pass(P[k], "vv", g)) for k in P if k[1] in (110, 30)][:2]
for name, (a, b) in [("same orbit (110, 12 days apart)", same[:2]),
                     ("different orbits, one week apart", mixed)]:
    d = b - a
    print(f"{name:34} median |difference| {np.nanmedian(np.abs(d)):4.2f} dB, "
          f"pixels over 3 dB {np.nanmean(np.abs(d) > 3):5.1%}")
same orbit (110, 12 days apart) median |difference| 1.55 dB, pixels over 3 dB 22.1%
different orbits, one week apart median |difference| 2.40 dB, pixels over 3 dB 40.7%
Example 2 — where the mixed-orbit difference lands
import pystac_client, planetary_computer, rasterio
from rasterio.enums import Resampling
from rasterio.vrt import WarpedVRT

cat = pystac_client.Client.open("https://planetarycomputer.microsoft.com/api/stac/v1",
                                modifier=planetary_computer.sign_inplace)
wc_item = next(cat.search(collections=["esa-worldcover"], bbox=bbox).items())
with rasterio.open(wc_item.assets["map"].href) as src, WarpedVRT(
        src, crs=g["crs"], transform=g["transform"], width=g["width"], height=g["height"],
        resampling=Resampling.nearest) as vrt:
    wc = vrt.read(1)

d_same, d_mixed = same[1] - same[0], mixed[1] - mixed[0]
for code, name in {40: "cropland", 50: "built-up", 80: "open water"}.items():
    m = wc == code
    print(f"{name:11} same orbit {np.nanmedian(np.abs(d_same[m])):4.2f} dB   "
          f"mixed orbits {np.nanmedian(np.abs(d_mixed[m])):4.2f} dB")
cropland same orbit 1.69 dB mixed orbits 1.98 dB
built-up same orbit 1.08 dB mixed orbits 3.23 dB
open water same orbit 2.70 dB mixed orbits 6.25 dB
Built-up land triples its median difference when the orbits are mixed, while cropland barely moves — the pattern the explanation below predicts. Open water's large difference even within one orbit is wind roughening the surface, not geometry.
Example 3 — the orbit metadata that decides all of this
for (day, orbit), frames in list(P.items())[:5]:
    p = frames[0].properties
    print(f"{day}  orbit {orbit:3d}  {p['sat:orbit_state']:10}  "
          f"orbit source {p['s1:orbit_source']:8}  platform {p['platform']}")
2024-07-03 orbit 103 ascending orbit source PREORB platform SENTINEL-1A
2024-07-04 orbit 110 descending orbit source PREORB platform SENTINEL-1A
2024-07-09 orbit 8 descending orbit source PREORB platform SENTINEL-1A
2024-07-10 orbit 30 ascending orbit source PREORB platform SENTINEL-1A
2024-07-15 orbit 103 ascending orbit source PREORB platform SENTINEL-1A
The same grid is not the same geometry
Why the same grid is not the same geometry
Warping two scenes onto one grid makes their arrays comparable as arrays: the same pixel is the same patch of ground. It does not make the measurements comparable, because each was taken from a different position in the sky. Backscatter depends on incidence angle and look direction, so the same patch legitimately returns different power to different tracks.
Why cities and slopes differ most
Double bounce depends on how buildings are oriented relative to the flight path, so a street grid that lines up with one track and not another changes brightness by several decibels between them. Slopes change the local incidence angle directly. Flat, rough farmland is the least sensitive, which is why mixed-orbit stacks can look fine over fields and fail over a town.
Why geolocation is rarely the problem
Sentinel-1's geolocation is good to a few metres with precise orbits, well under a pixel at 10 m. Where an apparent shift appears, it is usually terrain correction with a different DEM, or a product processed before precise orbits were available. Check s1:orbit_source before reaching for a coregistration routine.
UTM zones, overlapping tracks and DEM versions
- Different UTM zones between frames are normal; warp to your own CRS rather than theirs.
- Overlapping tracks give more frequent coverage if each is treated as a separate series.
- Coregistration at sub-pixel level is needed for interferometry, not for backscatter stacks.
- RTC and GRD of the same pass are different products; do not mix them in one stack.
- DEM version used in terrain correction can shift pixels in steep terrain between reprocessings.
- Record the orbit in every output file name.
Internal links
- How to read Sentinel-1 RTC data in Python — reading onto a fixed grid
- How to find Sentinel-1 scenes in Python — grouping by orbit
- SAR geometry explained — why look direction changes brightness
- How to detect change between two Sentinel-1 images — change detection done on one orbit
- Satellite bands do not align — the same grid problem in optical data
- How to reproject a raster with rasterio — warping in general
FAQ
Why do my Sentinel-1 arrays have different shapes?
They were read in their own geometries. Define one grid and warp every read onto it.
Why does my difference image show change everywhere?
Almost certainly mixed relative orbits or mixed pass directions.
Can I combine ascending and descending passes?
As separate layers or separate series, yes. In one stack or one difference, no.
How accurate is Sentinel-1 geolocation?
A few metres with precise orbits — well under one 10 m pixel.
Do I need to coregister Sentinel-1 scenes?
Not for terrain-corrected backscatter. Interferometry does.
What if my study area crosses two UTM zones?
Choose one CRS for the analysis and warp everything to it.