
How to read Sentinel-1 RTC data in Python
On this page
Problem statement
Sentinel-1 radiometrically terrain-corrected data on Microsoft Planetary Computer is a set of cloud-optimised GeoTIFFs, so reading it is a rasterio.open away. Reading it correctly takes a little more. Each pass is split into frames, and a window read from one frame may cover only part of your area. Frames come in the UTM zone of their own centre, which need not be the zone of your area. The files use -32768 as nodata, and zero-valued padding appears at frame edges. And the values are linear power, which is not what most thresholds and maps expect.
Reading the area south of Valencia from one frame of the 20 October 2024 pass gives valid pixels over 44.6% of it; the rest is nodata. Reading both frames of the pass onto one fixed grid gives 100%.
Quick answer
Search, group frames into passes, and mosaic each pass onto a grid you define:
import numpy as np
from sar_io import search, passes, grid, read_pass, to_db

bbox = [-0.46, 39.25, -0.33, 39.45]
g = grid(bbox, "EPSG:25830", res=10)                 # your grid, your CRS
P = passes(search(bbox, "2024-10-20/2024-11-01", orbit=110))
for (day, orbit), frames in P.items():
    vv = read_pass(frames, "vv", g)
    print(day, f"{len(frames)} frames -> {vv.shape}, valid {np.isfinite(vv).mean():.1%}, "
          f"median {np.nanmedian(to_db(vv)):.1f} dB")
2024-10-20 2 frames -> (2252, 1184), valid 100.0%, median -9.6 dB
2024-11-01 2 frames -> (2252, 1184), valid 100.0%, median -9.1 dB
Reading every pass onto the same grid is what makes arrays from different dates, and different orbits, line up pixel for pixel.
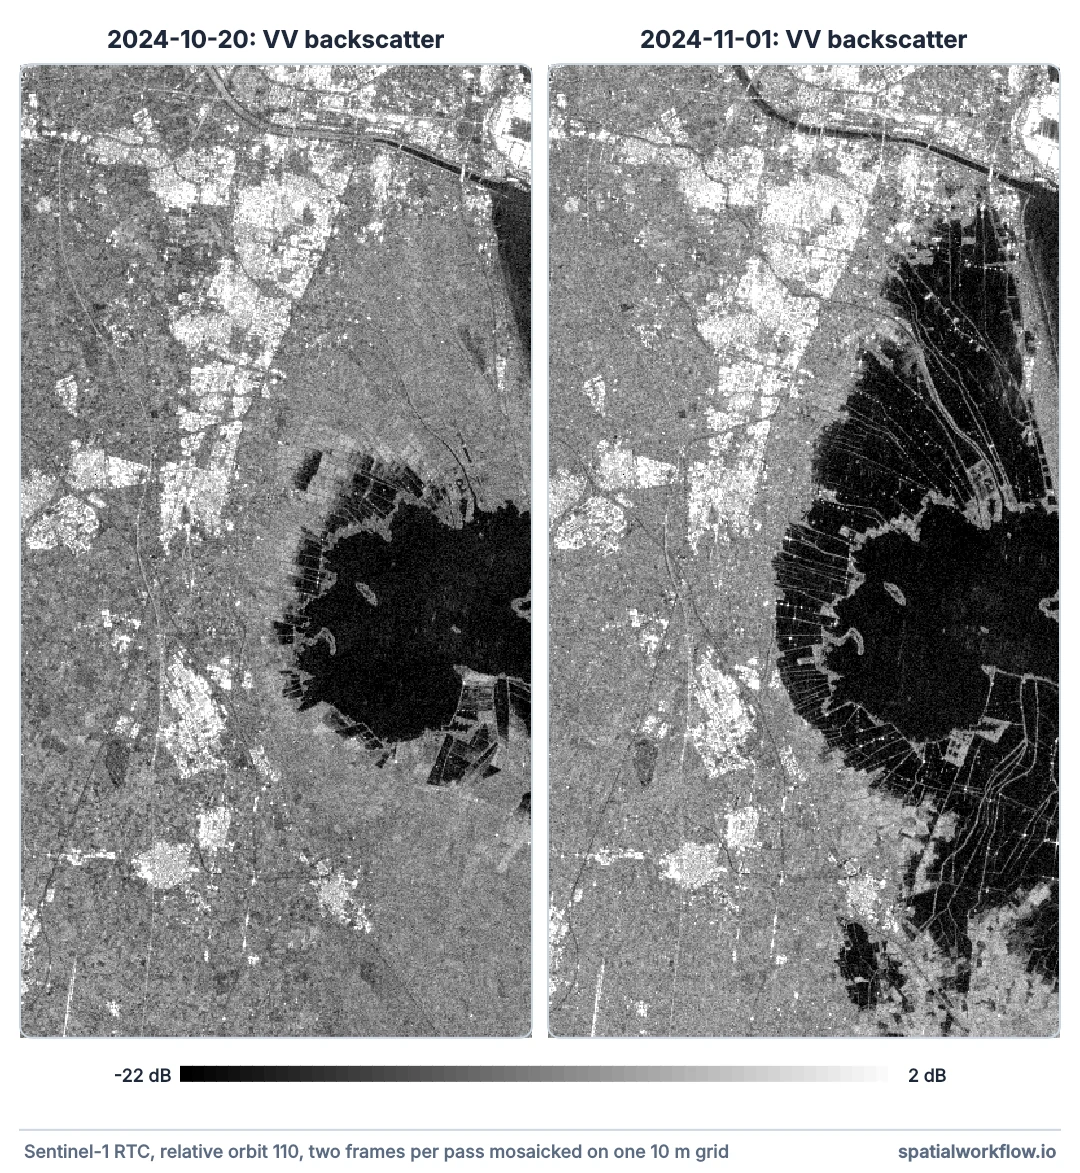
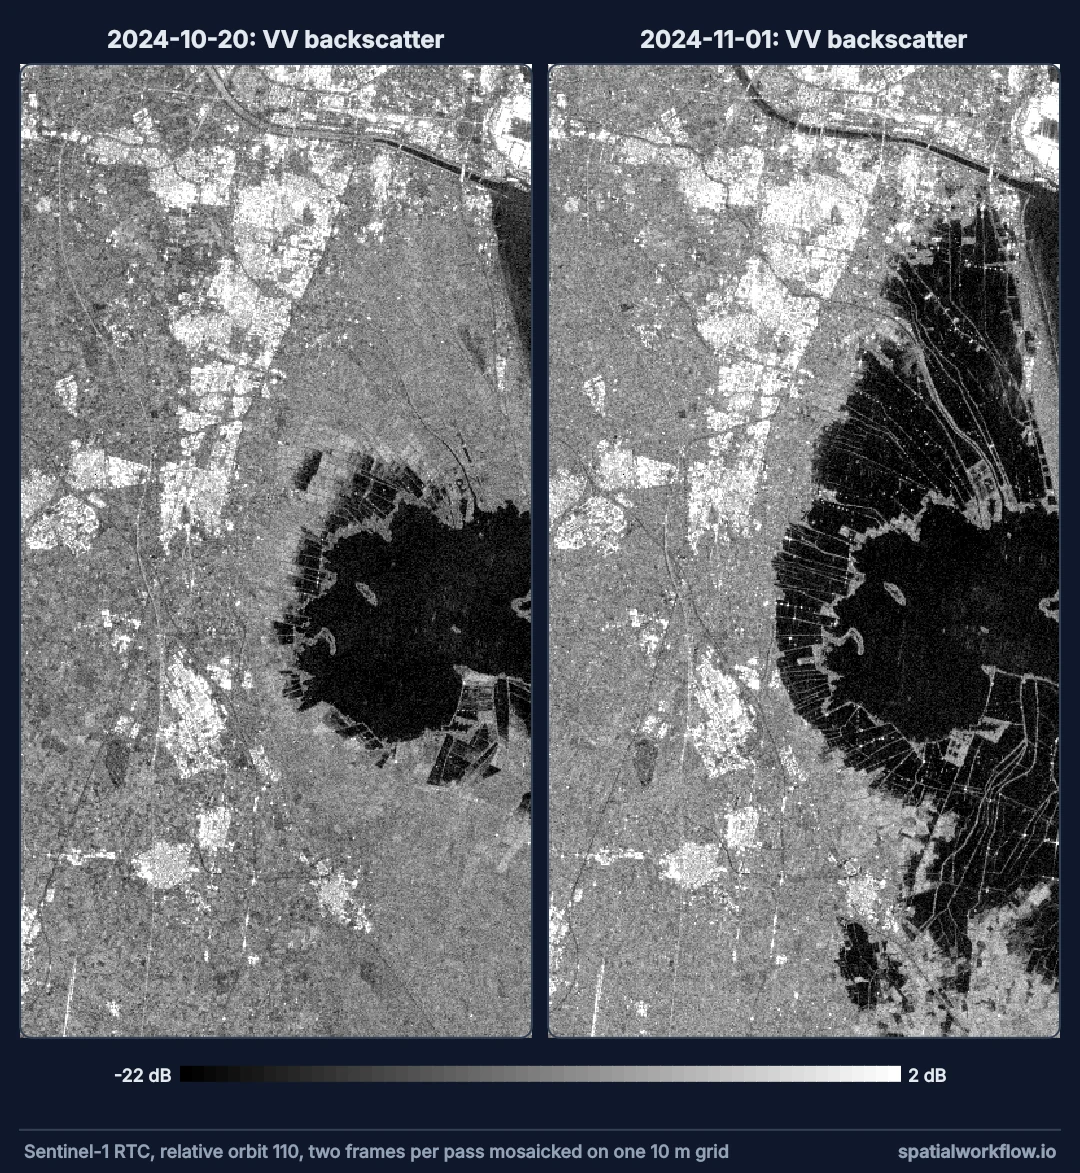
A fixed grid, warped reads, nodata first, mosaicked passes
1. Define the grid first
Choose a CRS appropriate to your area — here ETRS89 / UTM zone 30N, EPSG:25830 — a resolution, and bounds. Every read goes onto this grid, whatever the frames' own CRS.
2. Read through a warped VRT
rasterio.vrt.WarpedVRT reprojects on the fly, reading only the parts of the cloud-optimised file that overlap the grid. Bilinear resampling suits backscatter in linear units.
3. Treat nodata and zeros as missing
-32768 marks nodata, and frames can have zero-valued borders. Both become NaN before anything else; a single zero becomes minus infinity in decibels.
4. Mosaic the frames of a pass
Fill the grid from each frame in turn, keeping values already filled. Frames of one pass overlap slightly and agree where they do.
5. Keep linear values; convert to dB at the end
Average, filter and resample in linear power. Convert to decibels for display and thresholds, as the dB guide explains.
6. Save with the metadata that matters
Date, relative orbit, pass direction, polarisation and units belong in the file's tags. An array of floats with none of them cannot be reinterpreted later.
A reader module and what single frames miss
The data used on this page
Sentinel-1 radiometrically terrain-corrected backscatter (sentinel-1-rtc) from the Microsoft Planetary Computer, read through sar_io.py — the small module from the reading guide that searches, groups frames into passes and mosaics each pass onto a fixed grid.
%%writefile sar_io.py
"""Find, read and mosaic Sentinel-1 RTC scenes from Microsoft Planetary Computer."""
from collections import defaultdict

import numpy as np
import planetary_computer
import pystac_client
import rasterio
from rasterio.enums import Resampling
from rasterio.transform import from_origin
from rasterio.vrt import WarpedVRT
from rasterio.warp import transform_bounds

STAC = "https://planetarycomputer.microsoft.com/api/stac/v1"


def search(bbox, dates, orbit=None, direction=None, collection="sentinel-1-rtc"):
    """Items over bbox (lon/lat) in a date range, filtered by relative orbit and pass direction."""
    cat = pystac_client.Client.open(STAC, modifier=planetary_computer.sign_inplace)
    items = cat.search(collections=[collection], bbox=bbox, datetime=dates).item_collection()
    keep = [i for i in items
            if (orbit is None or i.properties["sat:relative_orbit"] == orbit)
            and (direction is None or i.properties["sat:orbit_state"] == direction)]
    return sorted(keep, key=lambda i: i.datetime)


def passes(items):
    """Group frames into passes: same day, same relative orbit."""
    groups = defaultdict(list)
    for i in items:
        groups[(i.datetime.date(), i.properties["sat:relative_orbit"])].append(i)
    return dict(sorted(groups.items()))


def grid(bbox, crs, res=10):
    """A fixed target grid: every pass is read onto this, so arrays line up."""
    left, bottom, right, top = transform_bounds(4326, crs, *bbox)
    width, height = int((right - left) // res), int((top - bottom) // res)
    return {"crs": crs, "transform": from_origin(left, top, res, res),
            "width": width, "height": height}


def read_pass(frames, band, g):
    """Mosaic one pass's frames for one band onto grid g. Linear power; NaN where no data."""
    out = np.full((g["height"], g["width"]), np.nan, dtype="float32")
    for item in frames:
        with rasterio.open(item.assets[band].href) as src, WarpedVRT(
                src, crs=g["crs"], transform=g["transform"], width=g["width"],
                height=g["height"], resampling=Resampling.bilinear, nodata=np.nan) as vrt:
            a = vrt.read(1)
        a[a <= 0] = np.nan                       # -32768 nodata and zero-padding
        fill = np.isnan(out) & np.isfinite(a)
        out[fill] = a[fill]
    return out


def to_db(linear):
    return 10 * np.log10(linear)
Writing sar_io.py
Example 1 — the module, saved as sar_io.py
"""Find, read and mosaic Sentinel-1 RTC scenes from Microsoft Planetary Computer."""
from collections import defaultdict

import numpy as np
import planetary_computer
import pystac_client
import rasterio
from rasterio.enums import Resampling
from rasterio.transform import from_origin
from rasterio.vrt import WarpedVRT
from rasterio.warp import transform_bounds

STAC = "https://planetarycomputer.microsoft.com/api/stac/v1"


def search(bbox, dates, orbit=None, direction=None, collection="sentinel-1-rtc"):
    """Items over bbox (lon/lat) in a date range, filtered by relative orbit and pass direction."""
    cat = pystac_client.Client.open(STAC, modifier=planetary_computer.sign_inplace)
    items = cat.search(collections=[collection], bbox=bbox, datetime=dates).item_collection()
    keep = [i for i in items
            if (orbit is None or i.properties["sat:relative_orbit"] == orbit)
            and (direction is None or i.properties["sat:orbit_state"] == direction)]
    return sorted(keep, key=lambda i: i.datetime)


def passes(items):
    """Group frames into passes: same day, same relative orbit."""
    groups = defaultdict(list)
    for i in items:
        groups[(i.datetime.date(), i.properties["sat:relative_orbit"])].append(i)
    return dict(sorted(groups.items()))


def grid(bbox, crs, res=10):
    """A fixed target grid: every pass is read onto this, so arrays line up."""
    left, bottom, right, top = transform_bounds(4326, crs, *bbox)
    width, height = int((right - left) // res), int((top - bottom) // res)
    return {"crs": crs, "transform": from_origin(left, top, res, res),
            "width": width, "height": height}


def read_pass(frames, band, g):
    """Mosaic one pass's frames for one band onto grid g. Linear power; NaN where no data."""
    out = np.full((g["height"], g["width"]), np.nan, dtype="float32")
    for item in frames:
        with rasterio.open(item.assets[band].href) as src, WarpedVRT(
                src, crs=g["crs"], transform=g["transform"], width=g["width"],
                height=g["height"], resampling=Resampling.bilinear, nodata=np.nan) as vrt:
            a = vrt.read(1)
        a[a <= 0] = np.nan                       # -32768 nodata and zero-padding
        fill = np.isnan(out) & np.isfinite(a)
        out[fill] = a[fill]
    return out


def to_db(linear):
    return 10 * np.log10(linear)
Example 2 — what a single-frame read misses
import rasterio
from rasterio.windows import from_bounds
from rasterio.warp import transform_bounds

frame = next(iter(P.values()))[0]
with rasterio.open(frame.assets["vv"].href) as src:
    print("frame CRS:", src.crs, "| nodata:", src.nodata)
    w = from_bounds(*transform_bounds(4326, src.crs, *bbox), src.transform)
    a = src.read(1, window=w)
print(f"window {a.shape}: nodata {np.mean(a == -32768):.1%}, zeros {np.mean(a == 0):.1%}, "
      f"valid {np.mean(a > 0):.1%}")
frame CRS: EPSG:32631 | nodata: -32768.0
window (2262, 1204): nodata 55.4%, zeros 0.0%, valid 44.6%
The frame is in UTM zone 31N although Valencia lies in zone 30: RTC frames are projected in the zone of their own centre.
Example 3 — save one pass with its metadata
import os

day, orbit = next(iter(P))
frames = P[(day, orbit)]
vv = read_pass(frames, "vv", g)
profile = dict(driver="GTiff", dtype="float32", count=1, crs=g["crs"], transform=g["transform"],
               width=g["width"], height=g["height"], nodata=np.nan, compress="deflate",
               predictor=3, tiled=True)
with rasterio.open("s1_vv_20241020_o110.tif", "w", **profile) as dst:
    dst.write(vv, 1)
    dst.update_tags(date=str(day), relative_orbit=orbit,
                    orbit_state=frames[0].properties["sat:orbit_state"],
                    polarisation="VV", units="gamma0 linear power",
                    source=",".join(f.id for f in frames))
print(f"{os.path.getsize('s1_vv_20241020_o110.tif') / 1e6:.1f} MB for {vv.size:,} pixels")
8.7 MB for 2,666,368 pixels
Why a fixed grid rather than the files' own
Why a fixed grid rather than the files' own
Each frame is its own raster with its own transform and, possibly, its own CRS. Stacking arrays read in native geometry requires them to match by accident. Defining the grid once and warping every read onto it guarantees alignment and puts the data in the CRS your other layers use.
Why warped reads are cheap on cloud-optimised files
A COG stores the image in internal tiles with overviews, and the VRT asks only for the tiles that overlap the target grid. A 13 × 22 km area is 2.7 million pixels of a frame that holds 640 million, and only the tiles covering those 2.7 million are fetched.
Why nodata handling comes first
Backscatter is converted to decibels with a logarithm. -32768 is negative and has no logarithm; zero has a logarithm of minus infinity. Either one, left in an array, breaks every mean, every threshold and every colour scale after it, and neither raises an error in NumPy — only a warning.
Tokens, resampling and memory
- Token lifetime. Signed URLs expire after a while; re-run the search for long jobs.
- Nearest vs bilinear. Use nearest for masks and class rasters, bilinear or average for backscatter.
- Downsampling to 20 or 30 m reduces speckle; use
Resampling.averagein linear units. - Memory. A full frame is about 600 million pixels per polarisation; read windows, not scenes.
- Dask and stackstac build lazy time stacks from the same items for large areas.
- VH and VV share grids within a frame; read both through the same function.
Internal links
- How to find Sentinel-1 scenes in Python — search and grouping
- Sentinel-1 products explained — what RTC contains
- How to convert SAR backscatter to decibels — the next step
- How to read a cloud-optimised GeoTIFF over HTTP — COG reads in general
- Satellite bands do not align — the same grid problem in optical data
- How to reproject a raster with rasterio — warping in general
FAQ
How do I read Sentinel-1 RTC data in Python?
Search Planetary Computer with pystac_client, sign the assets, and read with rasterio through a WarpedVRT onto a grid you define.
Why is part of my image empty?
Your area crosses a frame boundary. Mosaic all frames of the pass.
What is -32768 in Sentinel-1 RTC files?
The nodata value. Convert it, and any zeros, to NaN before taking logarithms.
What CRS is Sentinel-1 RTC in?
The UTM zone of each frame's centre, which may differ from your area's zone. Warp to your own grid.
Are the values in decibels?
No. They are gamma nought in linear power units.
How do I keep images from different dates aligned?
Read every pass onto the same fixed grid.