
A SAR flood map shows water where there is none
On this page
Problem statement
The flood map has water on an airport apron, along a motorway, on the lee side of a ridge, and across fields ten kilometres from any river. Radar maps water by darkness, and darkness has several causes: a smooth dry surface reflects the pulse away just as calm water does, radar shadow receives no pulse at all, and dry sand and salt flats can be nearly as dark as a lake.
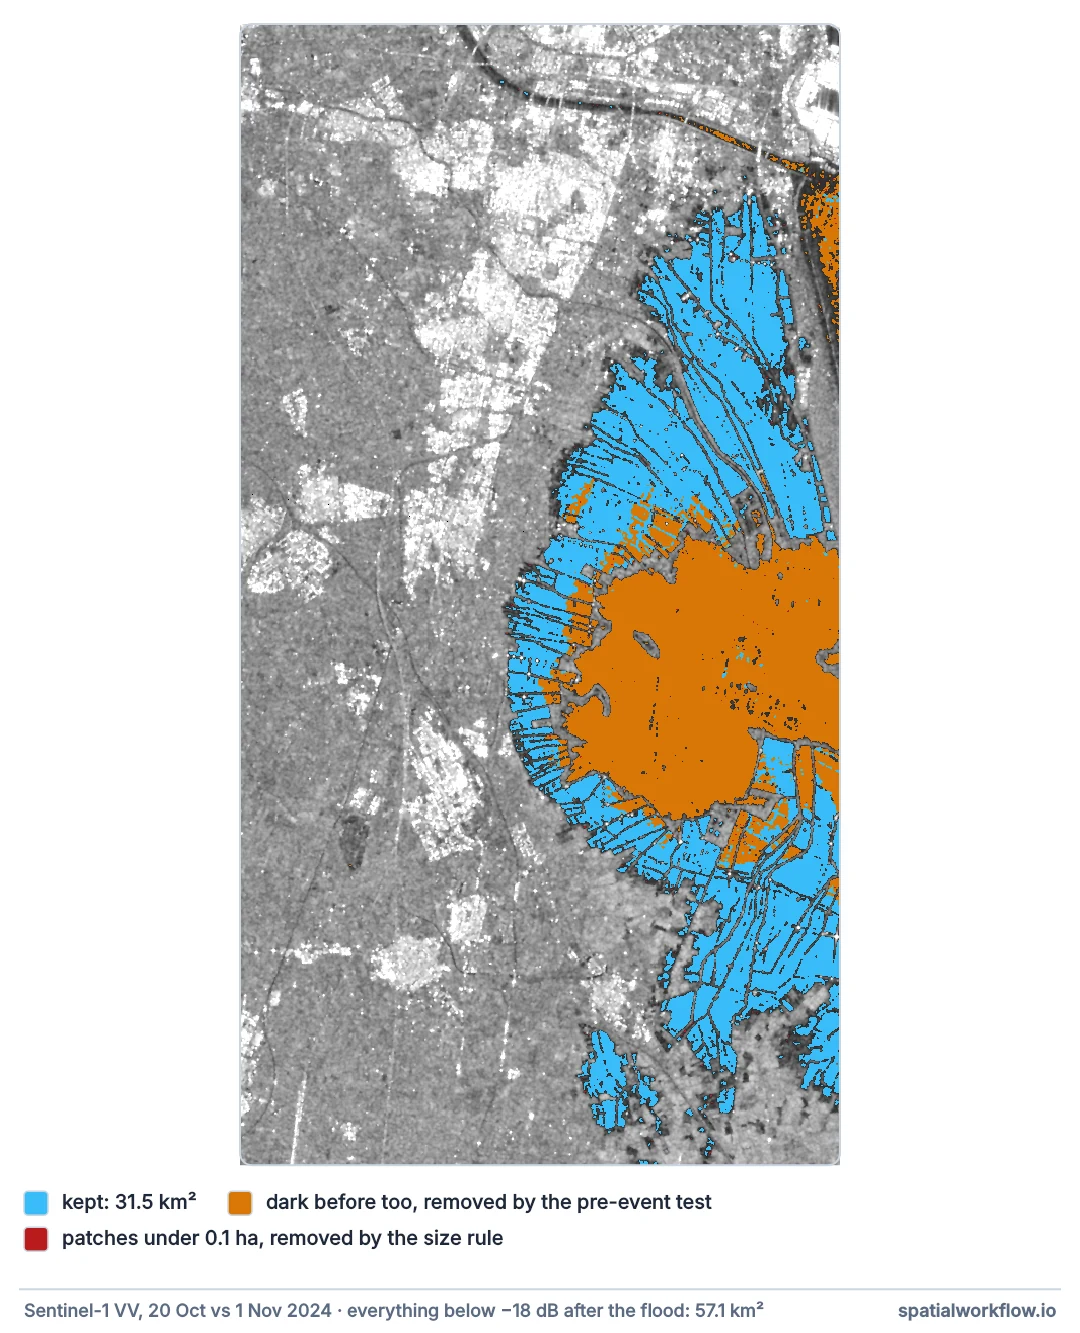
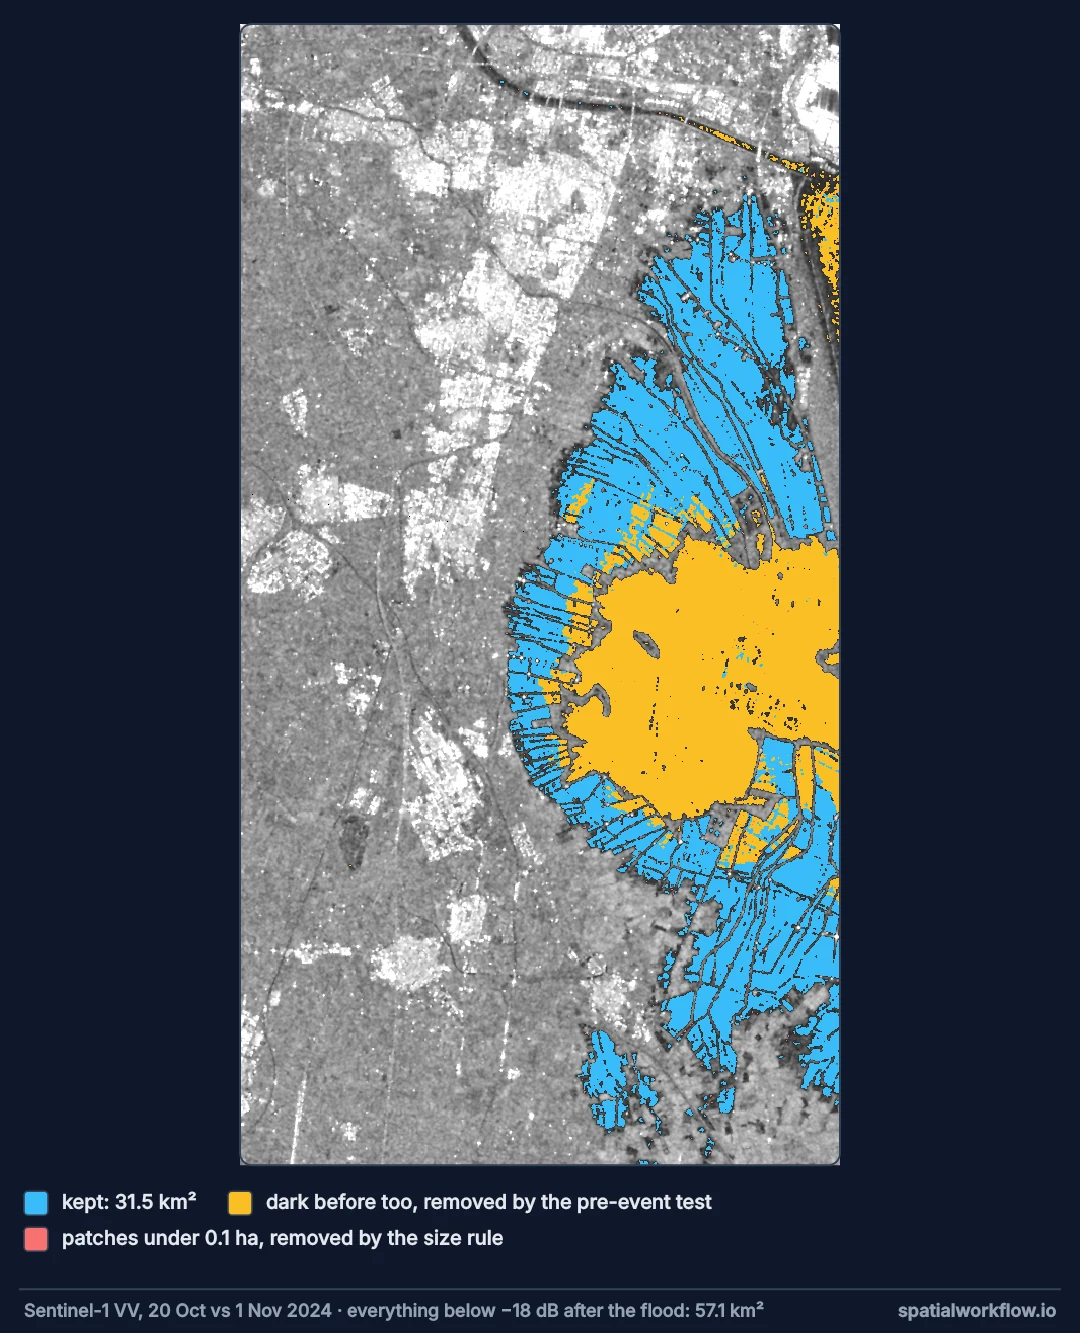
A single-date threshold cannot tell these apart, because they look identical. What separates them is context: they were dark before the flood too, they lie where water cannot stand, or they are too small and too thin to be a flood. On the pre-flood Sentinel-1 scene south of Valencia, 9.4% of the scene is already below −18 dB — and that is the flat coastal plain, with no hills to cast shadow.
Quick answer
Use a pre-event image, a terrain constraint and a minimum size, and each false cause falls away:
import numpy as np
from scipy.ndimage import label
from sar_io import search, passes, grid, read_pass, to_db
from sar_filters import lee_filter

bbox = [-0.46, 39.25, -0.33, 39.45]
g = grid(bbox, "EPSG:25830")
P = passes(search(bbox, "2024-10-20/2024-11-01", orbit=110))
pre, post = (to_db(lee_filter(read_pass(P[k], "vv", g))) for k in P)

naive = post < -18                                   # threshold only
change = naive & (pre >= -18) & (post - pre < -3)    # and it was not dark before
lab, n = label(change)
sizes = np.bincount(lab.ravel()); sizes[0] = 0
cleaned = (sizes >= 10)[lab]                         # and it is at least 0.1 ha

for name, m in [("threshold only", naive), ("+ pre-event test", change), ("+ min size", cleaned)]:
    print(f"{name:18} {m.sum() * 100 / 1e6:6.1f} km²")
threshold only 57.1 km²
+ pre-event test 31.6 km²
+ min size 31.5 km²
Each step removes a class of false positive, and none of them needs a better threshold.
Difference, require a drop, remove patches, use terrain
1. Difference against a pre-event pass
Roads, aprons, shadow and salt flats are dark on both dates, so they vanish from a change map. This removes most false water in one step.
2. Require a real drop
Pixels close to the threshold cross it by chance. Require a fall of at least 2–3 dB as well.
3. Remove tiny patches
A flood is a connected sheet of water. Patches of a few pixels are speckle, or single dark fields.
4. Constrain by terrain
Water cannot stand on a slope or far above the nearest drainage. A slope mask, or a height-above-nearest-drainage threshold, removes shadow and hillside artefacts.
5. Check the seasonal context
Rice paddies, irrigated fields and managed wetlands are flooded on a schedule. A third date from the year before, or a local calendar, tells you whether a flooded field is news.
6. Report what survived each step
The area after each filter is the most informative thing you can publish about a flood map's reliability.
What was already dark before the flood
The data used on this page
Sentinel-1 radiometrically terrain-corrected backscatter (sentinel-1-rtc) from the Microsoft Planetary Computer, read through sar_io.py — the small module from the reading guide that searches, groups frames into passes and mosaics each pass onto a fixed grid.
%%writefile sar_io.py
"""Find, read and mosaic Sentinel-1 RTC scenes from Microsoft Planetary Computer."""
from collections import defaultdict

import numpy as np
import planetary_computer
import pystac_client
import rasterio
from rasterio.enums import Resampling
from rasterio.transform import from_origin
from rasterio.vrt import WarpedVRT
from rasterio.warp import transform_bounds

STAC = "https://planetarycomputer.microsoft.com/api/stac/v1"


def search(bbox, dates, orbit=None, direction=None, collection="sentinel-1-rtc"):
    """Items over bbox (lon/lat) in a date range, filtered by relative orbit and pass direction."""
    cat = pystac_client.Client.open(STAC, modifier=planetary_computer.sign_inplace)
    items = cat.search(collections=[collection], bbox=bbox, datetime=dates).item_collection()
    keep = [i for i in items
            if (orbit is None or i.properties["sat:relative_orbit"] == orbit)
            and (direction is None or i.properties["sat:orbit_state"] == direction)]
    return sorted(keep, key=lambda i: i.datetime)


def passes(items):
    """Group frames into passes: same day, same relative orbit."""
    groups = defaultdict(list)
    for i in items:
        groups[(i.datetime.date(), i.properties["sat:relative_orbit"])].append(i)
    return dict(sorted(groups.items()))


def grid(bbox, crs, res=10):
    """A fixed target grid: every pass is read onto this, so arrays line up."""
    left, bottom, right, top = transform_bounds(4326, crs, *bbox)
    width, height = int((right - left) // res), int((top - bottom) // res)
    return {"crs": crs, "transform": from_origin(left, top, res, res),
            "width": width, "height": height}


def read_pass(frames, band, g):
    """Mosaic one pass's frames for one band onto grid g. Linear power; NaN where no data."""
    out = np.full((g["height"], g["width"]), np.nan, dtype="float32")
    for item in frames:
        with rasterio.open(item.assets[band].href) as src, WarpedVRT(
                src, crs=g["crs"], transform=g["transform"], width=g["width"],
                height=g["height"], resampling=Resampling.bilinear, nodata=np.nan) as vrt:
            a = vrt.read(1)
        a[a <= 0] = np.nan                       # -32768 nodata and zero-padding
        fill = np.isnan(out) & np.isfinite(a)
        out[fill] = a[fill]
    return out


def to_db(linear):
    return 10 * np.log10(linear)
Overwriting sar_io.py
lee_filter comes from the speckle-filter guide, saved as sar_filters.py:
%%writefile sar_filters.py
"""The Lee speckle filter from the speckle-filter guide."""
import numpy as np
from scipy.ndimage import uniform_filter

def lee_filter(img, size=5, enl=4.4):
    """Lee filter on linear intensity. Smooths homogeneous areas, keeps edges.
    enl: equivalent number of looks of the input (4.4 for Sentinel-1 IW GRD/RTC)."""
    ok = np.isfinite(img)
    x = np.where(ok, img, 0.0)
    n = uniform_filter(ok.astype("float64"), size)
    mean = uniform_filter(x, size) / np.maximum(n, 1e-9)
    sq = uniform_filter(x * x, size) / np.maximum(n, 1e-9)
    var = np.maximum(sq - mean ** 2, 0)
    noise = (mean ** 2) / enl                    # variance speckle alone would produce
    weight = np.clip((var - noise) / np.maximum(var, 1e-12), 0, 1)
    out = mean + weight * (x - mean)
    return np.where(ok, out, np.nan)
Overwriting sar_filters.py
Example 1 — what was already dark, by land cover
import pystac_client, planetary_computer, rasterio
from rasterio.enums import Resampling
from rasterio.vrt import WarpedVRT

cat = pystac_client.Client.open("https://planetarycomputer.microsoft.com/api/stac/v1",
                                modifier=planetary_computer.sign_inplace)
wc_item = next(cat.search(collections=["esa-worldcover"], bbox=bbox).items())
with rasterio.open(wc_item.assets["map"].href) as src, WarpedVRT(
        src, crs=g["crs"], transform=g["transform"], width=g["width"], height=g["height"],
        resampling=Resampling.nearest) as vrt:
    wc = vrt.read(1)

dark_before = pre < -18
print(f"already below -18 dB before the flood: {np.nanmean(dark_before):.1%} of the scene")
for code, name in {80: "open water", 90: "wetland", 40: "cropland", 50: "built-up", 60: "bare"}.items():
    m = wc == code
    if m.sum():
        print(f"  {name:11} {np.nanmean(dark_before[m]):6.1%} of its pixels ({m.sum() * 100 / 1e6:5.1f} km²)")
already below -18 dB before the flood: 9.4% of the scene
open water 80.8% of its pixels ( 26.8 km²)
wetland 12.8% of its pixels ( 20.1 km²)
cropland 0.9% of its pixels ( 91.2 km²)
built-up 0.0% of its pixels ( 45.7 km²)
bare 0.1% of its pixels ( 3.8 km²)
Example 2 — the patches a minimum size removes
lab_n, n_patches = label(change)
sizes = np.bincount(lab_n.ravel()); sizes[0] = 0
small = sizes[1:] < 10
print(f"{n_patches:,} patches; {small.sum():,} smaller than 0.1 ha "
      f"({small.sum() / max(n_patches, 1):.0%} of patches, "
      f"{sizes[1:][small].sum() * 100 / 1e6:.2f} km² of area)")
898 patches; 559 smaller than 0.1 ha (62% of patches, 0.14 km² of area)
Example 3 — the fields that flood every year
for (day, _), frames in passes(search(bbox, "2023-10-20/2023-12-20", orbit=110)).items():
    ly = to_db(lee_filter(read_pass(frames, "vv", g)))
    print(f"{day}: {np.nanmean((ly < -18)[cleaned]):5.1%} of the 2024 flood pixels were dark")
2023-10-26: 3.3% of the 2024 flood pixels were dark
2023-11-07: 14.8% of the 2024 flood pixels were dark
2023-11-19: 25.3% of the 2024 flood pixels were dark
2023-12-01: 34.6% of the 2024 flood pixels were dark
2023-12-13: 0.3% of the 2024 flood pixels were dark
Read the whole series, not one date. A year earlier the same fields went from 3.3% dark in late October to 34.6% by 1 December, as the paddies were flooded for the winter: the annual cycle arrives after the date of the 2024 flood, so most of what the change map found on 1 November was not simply that cycle.
Then look at 13 December: 0.3%. The fields did not drain in twelve days. Something — wind, most likely — roughened the surface enough for the water to stop reading as dark. That is the same failure in the other direction, and it is the reason a single comparison date settles nothing: whichever date you pick, you are at the mercy of that day's weather.
Smooth dry surfaces and radar shadow
Why smooth dry surfaces look like water
Backscatter measures roughness relative to the wavelength. At 5.5 cm, fresh tarmac, an airport apron and a dry salt flat are smooth, so they reflect the pulse forward and away from the sensor, exactly as calm water does. There is no property of a single radar image that separates them; only their behaviour over time differs.
Why shadow is the worst false positive
Radar shadow contains no signal at all, so it is darker than water and passes any threshold. It sits behind steep slopes, which is exactly where water cannot stand, so a terrain constraint removes it cleanly. In flat terrain, like this scene, shadow is not a problem at all — which is why flood maps in mountains need masks that coastal plains do not.
Why seasonal flooding is the hardest case
It is genuinely water and genuinely new since the previous pass. Nothing in the radar can say whether the field was flooded by a storm or by a farmer opening a sluice. Only context resolves it: the same date in previous years, the local cropping calendar, or an independent delineation.
Wind, shallow water and urban flooding
- Wind does the opposite: it roughens water and hides real flooding.
- Very shallow water over vegetation stays bright; absence of dark pixels is not absence of flood.
- Urban flooding brightens rather than darkens, and is missed by every test here.
- HAND thresholds of a few metres are a good terrain constraint where a DEM is available.
- Validation against an independent delineation is the only way to quantify what is left.
- Publish the intermediate areas, not just the final number.
Internal links
- How to map floods from Sentinel-1 in Python — the pipeline these tests belong to
- How to detect change between two Sentinel-1 images — the pre-event comparison
- SAR geometry explained — where shadow comes from
- Height above nearest drainage explained — the terrain constraint
- An inundation map floods inland areas that cannot flood — the same problem in modelled floods
- Speckle explained — why single pixels cross thresholds
FAQ
Why does my SAR flood map include roads and airports?
They are smooth and dark on radar. A pre-event image removes them, because they were dark before too.
What about dark areas in hills?
Radar shadow. Mask by slope or height above nearest drainage.
How do I tell a flood from a flooded rice field?
By context: the same date in earlier years, or the local cropping calendar. The radar cannot tell.
What minimum patch size should I use?
Around 0.1 ha at 10 m — ten pixels — removes speckle without losing real flooding.
Can wind hide a flood?
Yes. Roughened water returns more power and may not cross the threshold.
Is a better threshold the answer?
No. Every threshold maps darkness; the fix is context, not calibration.