
How to find Sentinel-1 scenes in Python
On this page
Problem statement
Searching for Sentinel-1 scenes looks like searching for Sentinel-2: a bounding box, a date range, a STAC query. The results need more handling. One satellite pass over your area is often split across two or three catalogue items, passes come from several relative orbits looking from different directions, and the number of passes per month has changed sharply over the mission's life as satellites failed and were replaced. A naive search returns a list of items; what an analysis needs is a list of complete passes from one consistent geometry.
Over the area south of Valencia, a two-week search returns seven passes from four different relative orbits, three of them ascending and four descending, and five of the passes are split across two frames.
Quick answer
Search, then filter and group on the client side:
from sar_io import search, passes

bbox = [-0.46, 39.25, -0.33, 39.45]
items = search(bbox, "2024-10-15/2024-11-10")               # sentinel-1-rtc by default
P = passes(items)
print(len(items), "items in", len(P), "passes")
for (day, orbit), frames in P.items():
    print(day, f"orbit {orbit:3d} {frames[0].properties['sat:orbit_state']:10} {len(frames)} frame(s)")
12 items in 7 passes
2024-10-19 orbit 103 ascending 1 frame(s)
2024-10-20 orbit 110 descending 2 frame(s)
2024-10-25 orbit 8 descending 1 frame(s)
2024-10-26 orbit 30 ascending 2 frame(s)
2024-11-01 orbit 110 descending 2 frame(s)
2024-11-06 orbit 8 descending 2 frame(s)
2024-11-07 orbit 30 ascending 2 frame(s)
search and passes are in the module from the reading guide. The filter by relative orbit and pass direction is done in Python because the Planetary Computer STAC API does not support the query extension; passing query= there only produces a warning.
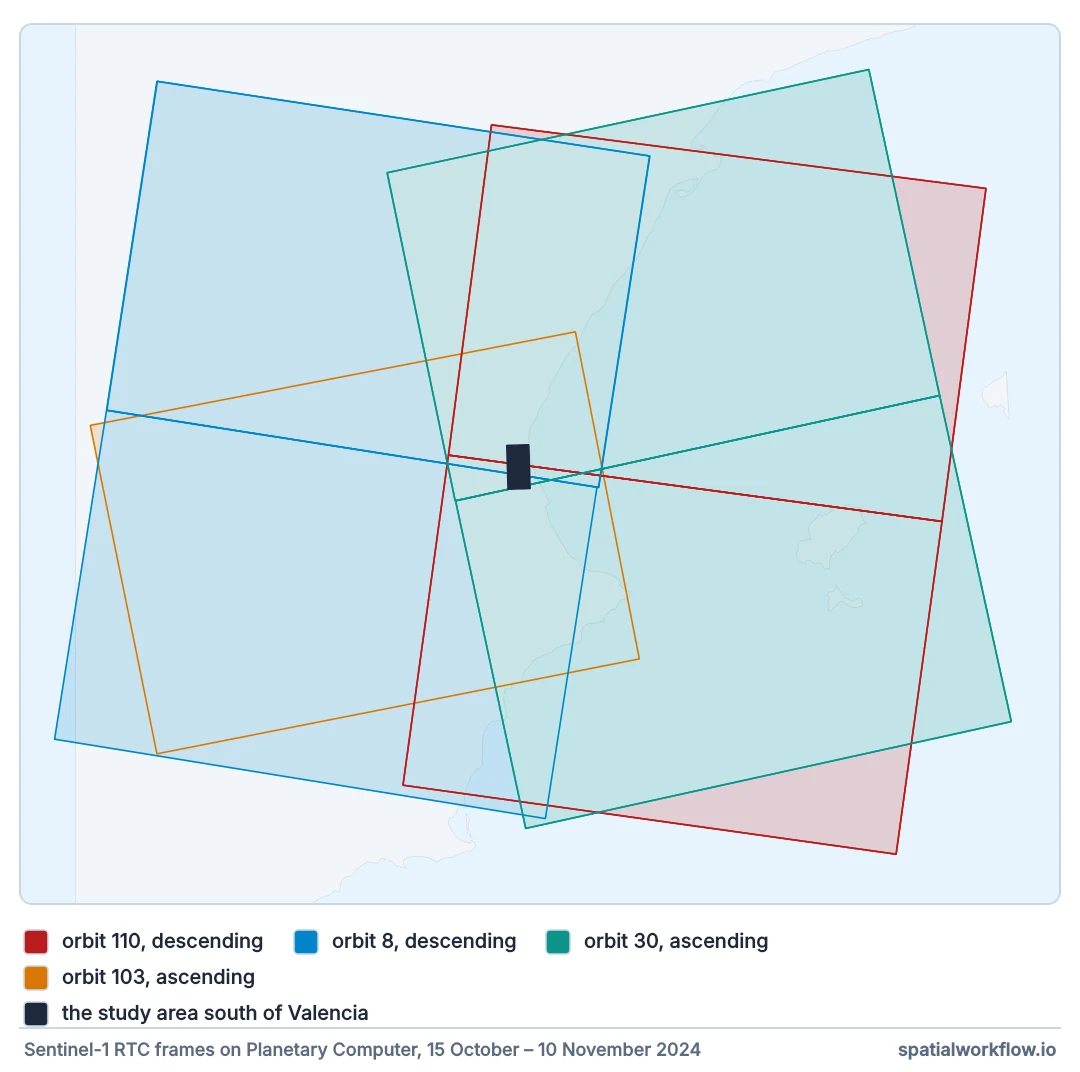
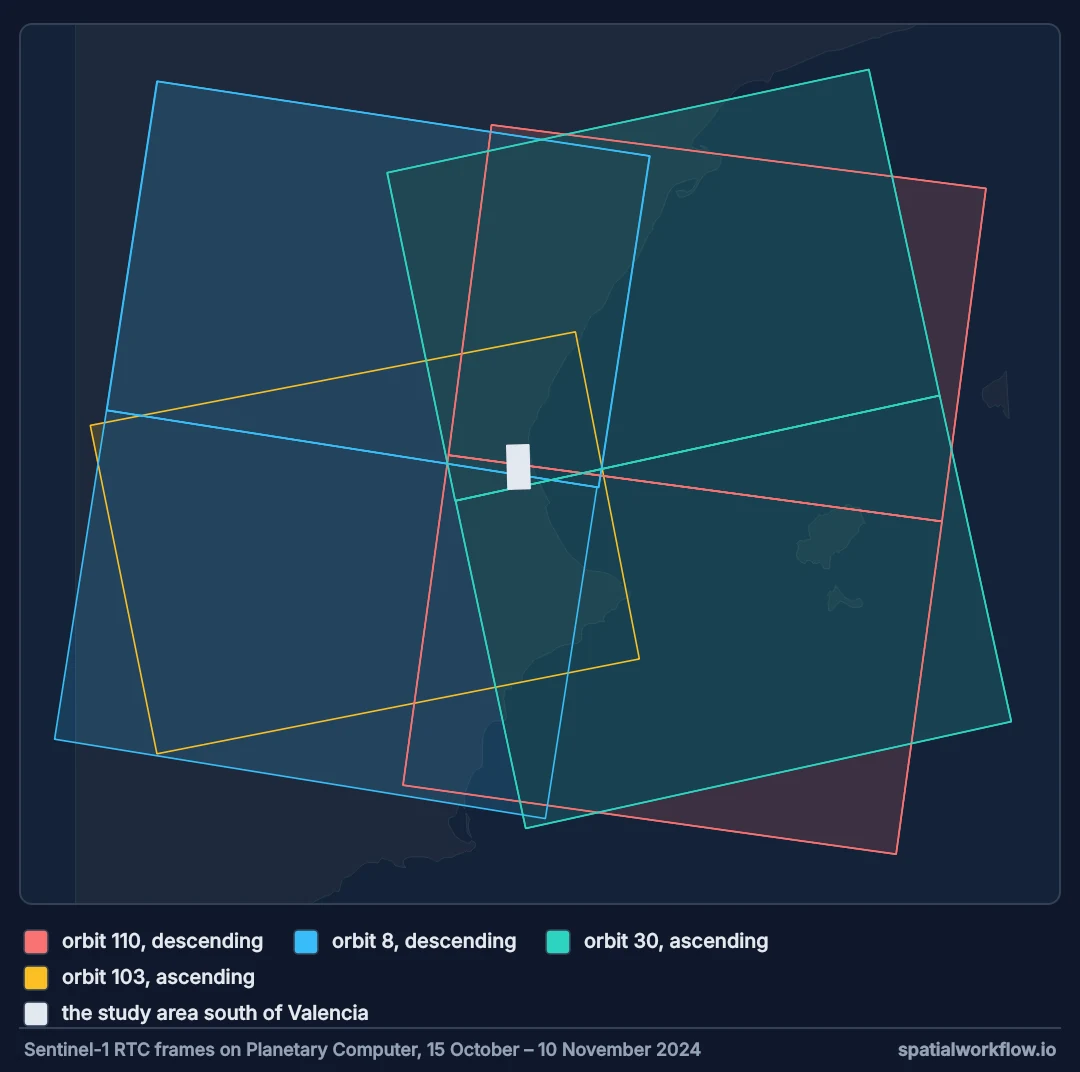
Right collection, orbit metadata, frames into passes
1. Search the right collection
On Microsoft Planetary Computer, sentinel-1-rtc is terrain-corrected and ready to use; sentinel-1-grd is the raw ground-range product. Sign asset URLs with planetary_computer.sign_inplace as a client modifier.
2. Keep the orbit metadata
sat:relative_orbit identifies the track, sat:orbit_state says ascending or descending. Two passes on the same relative orbit share their geometry exactly; that is what makes them comparable.
3. Group frames into passes
Consecutive frames from one pass share a date and relative orbit. Group on both, and mosaic the frames of each group before analysis.
4. Check coverage
A pass whose frames do not cover the whole area gives an image with a missing part. Compute the share of your area inside the union of the frame footprints and drop passes below a threshold.
5. Pick one relative orbit for a time series
Mixing orbits mixes look directions and incidence angles, which changes backscatter on slopes and in cities. Use the orbit with the most passes, or keep orbits separate.
6. Expect revisit to depend on the year
Sentinel-1B failed on 23 December 2021. From then until Sentinel-1C entered service in 2025, each orbit was revisited every 12 days instead of 6 in most of Europe.
Coverage, passes per half-year and the best orbit
The data used on this page
Sentinel-1 radiometrically terrain-corrected backscatter (sentinel-1-rtc) from the Microsoft Planetary Computer, read through sar_io.py — the small module from the reading guide that searches, groups frames into passes and mosaics each pass onto a fixed grid.
%%writefile sar_io.py
"""Find, read and mosaic Sentinel-1 RTC scenes from Microsoft Planetary Computer."""
from collections import defaultdict

import numpy as np
import planetary_computer
import pystac_client
import rasterio
from rasterio.enums import Resampling
from rasterio.transform import from_origin
from rasterio.vrt import WarpedVRT
from rasterio.warp import transform_bounds

STAC = "https://planetarycomputer.microsoft.com/api/stac/v1"


def search(bbox, dates, orbit=None, direction=None, collection="sentinel-1-rtc"):
    """Items over bbox (lon/lat) in a date range, filtered by relative orbit and pass direction."""
    cat = pystac_client.Client.open(STAC, modifier=planetary_computer.sign_inplace)
    items = cat.search(collections=[collection], bbox=bbox, datetime=dates).item_collection()
    keep = [i for i in items
            if (orbit is None or i.properties["sat:relative_orbit"] == orbit)
            and (direction is None or i.properties["sat:orbit_state"] == direction)]
    return sorted(keep, key=lambda i: i.datetime)


def passes(items):
    """Group frames into passes: same day, same relative orbit."""
    groups = defaultdict(list)
    for i in items:
        groups[(i.datetime.date(), i.properties["sat:relative_orbit"])].append(i)
    return dict(sorted(groups.items()))


def grid(bbox, crs, res=10):
    """A fixed target grid: every pass is read onto this, so arrays line up."""
    left, bottom, right, top = transform_bounds(4326, crs, *bbox)
    width, height = int((right - left) // res), int((top - bottom) // res)
    return {"crs": crs, "transform": from_origin(left, top, res, res),
            "width": width, "height": height}


def read_pass(frames, band, g):
    """Mosaic one pass's frames for one band onto grid g. Linear power; NaN where no data."""
    out = np.full((g["height"], g["width"]), np.nan, dtype="float32")
    for item in frames:
        with rasterio.open(item.assets[band].href) as src, WarpedVRT(
                src, crs=g["crs"], transform=g["transform"], width=g["width"],
                height=g["height"], resampling=Resampling.bilinear, nodata=np.nan) as vrt:
            a = vrt.read(1)
        a[a <= 0] = np.nan                       # -32768 nodata and zero-padding
        fill = np.isnan(out) & np.isfinite(a)
        out[fill] = a[fill]
    return out


def to_db(linear):
    return 10 * np.log10(linear)
Overwriting sar_io.py
Example 1 — which frames cover the area
from shapely.geometry import box, shape

aoi = box(*bbox)
for (day, orbit), frames in P.items():
    union = shape(frames[0].geometry)
    for f in frames[1:]:
        union = union.union(shape(f.geometry))
    covered = union.intersection(aoi).area / aoi.area
    print(day, f"orbit {orbit:3d}", f"covers {covered:6.1%}")
2024-10-19 orbit 103 covers 100.0%
2024-10-20 orbit 110 covers 100.0%
2024-10-25 orbit 8 covers 70.7%
2024-10-26 orbit 30 covers 99.9%
2024-11-01 orbit 110 covers 100.0%
2024-11-06 orbit 8 covers 100.0%
2024-11-07 orbit 30 covers 99.9%
Example 2 — passes per half-year, by satellite
from collections import Counter

for year in (2021, 2023, 2025):
    its = search(bbox, f"{year}-01-01/{year}-06-30")
    by_pass = passes(its)
    platforms = Counter(fr[0].properties["platform"] for fr in by_pass.values())
    print(year, len(by_pass), "passes", dict(sorted(platforms.items())))
2021 117 passes {'SENTINEL-1A': 60, 'SENTINEL-1B': 57}
2023 60 passes {'SENTINEL-1A': 60}
2025 82 passes {'SENTINEL-1A': 49, 'sentinel-1a': 8, 'sentinel-1c': 25}
Two things in that output. The first half of 2025 is below 2021 because Sentinel-1C only joined partway through it. And the platform is spelled two ways — SENTINEL-1A and sentinel-1a — in items from the same collection: normalise case before grouping on it.
Example 3 — the orbit with the most passes
year = passes(search(bbox, "2024-01-01/2024-12-31"))
per_orbit = Counter(orbit for (_, orbit) in year)
print(per_orbit.most_common())
best = per_orbit.most_common(1)[0][0]
dates = [d for (d, o) in year if o == best]
gaps = [(b - a).days for a, b in zip(dates, dates[1:])]
print(f"orbit {best}: {len(dates)} passes, gaps {Counter(gaps).most_common(3)}")
[(8, 28), (30, 28), (110, 27), (103, 26)]
orbit 8: 28 passes, gaps [(12, 26), (24, 1)]
Why one pass becomes several items
Why one pass becomes several items
Sentinel-1 acquires long continuous strips, which the ground segment cuts into frames of roughly 25 seconds of flight — about 170 km along track. An area near a cut appears in two consecutive frames, each covering part of it. Catalogues index frames, not passes, so grouping is the user's job.
Why the relative orbit is the unit of consistency
Sentinel-1 repeats its ground track exactly every 12 days per satellite. Every acquisition on a given relative orbit sees the ground from the same position, with the same incidence angle and look direction. Different relative orbits over the same area differ in all three, so their backscatter differs even when nothing on the ground changed.
Why revisit changed
With two satellites 180° apart in the same orbit, each track was revisited every 6 days. When Sentinel-1B failed, the constellation fell to one satellite and the revisit to 12 days, until Sentinel-1C launched in December 2024 and took over the second slot. A time series that spans 2021–2025 has a sampling rate that changes twice, which matters for anything computed per month.
Query extensions, expiring URLs and moving frames
- The
queryextension is supported on some STAC servers and not others; filter in Python to be portable. - Signed URLs expire. Re-sign items if a long job runs past the token lifetime.
- Frame boundaries move slightly between passes; check coverage per pass.
- Near-real-time products can be replaced by reprocessed ones with precise orbits.
- Polar and ocean areas use different modes and polarisations.
- Other catalogues — ASF, Copernicus Data Space, Earth Search — index the same data with different collection names.
Internal links
- How to read Sentinel-1 RTC data in Python — the module used here
- Sentinel-1 products explained — RTC against GRD
- SAR scenes from different dates do not line up — mixing orbits
- How to make a Sentinel-1 composite over a period — using many passes
- How to download satellite imagery with STAC in Python — STAC basics
- STAC catalogues explained — what items and collections are
FAQ
How do I search Sentinel-1 in Python?
With pystac_client against a STAC API such as Microsoft Planetary Computer, collection sentinel-1-rtc or sentinel-1-grd.
Why do I get several items for one date?
One pass is split into frames. Group items by date and relative orbit and mosaic them.
How do I filter by orbit?
Read sat:relative_orbit and sat:orbit_state from each item's properties and filter in Python.
How often does Sentinel-1 revisit?
Every 12 days per satellite per track; 6 days with two satellites. Most areas are also covered by neighbouring tracks.
Should I mix ascending and descending?
Not in a single time series. Keep them separate or analyse them side by side.
What happened to Sentinel-1B?
It failed in December 2021; Sentinel-1C replaced it in 2025.