
How to Download CAL FIRE Wildfire Perimeters in Python
On this page
Problem statement
CAL FIRE serves its fire perimeters through a public ArcGIS feature service: a query URL that takes a where clause and answers in GeoJSON, a cause field stored as numeric codes whose meanings live in the service's own domain, and an acreage the agency computed. Turning that into a table you can trust means one REST request, a lookup of the domain, areas recomputed in an equal-area projection and checked against the agency's, and a repair of the polygons that arrive invalid.
This page downloads CAL FIRE's perimeters for 2021–2025, checks the areas against the official acreage, and maps the 2024 season, dominated by the Park Fire.
Quick answer
Query the feature service as GeoJSON in WGS 84, read it with GeoPandas, and measure areas in California Albers (EPSG:3310):
fires = gpd.read_file(GEOJSON).to_crs(3310)
fires["geometry"] = fires.geometry.make_valid()
fires["acres_calc"] = fires.area / 4046.8564224
y24 = fires[fires.YEAR_ == 2024]
park = y24.loc[y24.FIRE_NAME == "PARK"].iloc[0]
print(f"{len(fires)} perimeters 2021–2025; 2024: {len(y24)} fires over 50 acres, {y24.acres_calc.sum():,.0f} acres")
print(f"Park Fire: {park.acres_calc:,.0f} acres computed, {park.GIS_ACRES:,.1f} official; cause {CAUSE[park.CAUSE]}, "
      f"alarm {pd.to_datetime(park.ALARM_DATE, unit='ms'):%d %b %Y}")
746 perimeters 2021–2025; 2024: 218 fires over 50 acres, 1,006,426 acres
Park Fire: 429,603 acres computed, 429,602.8 official; cause Arson, alarm 24 Jul 2024
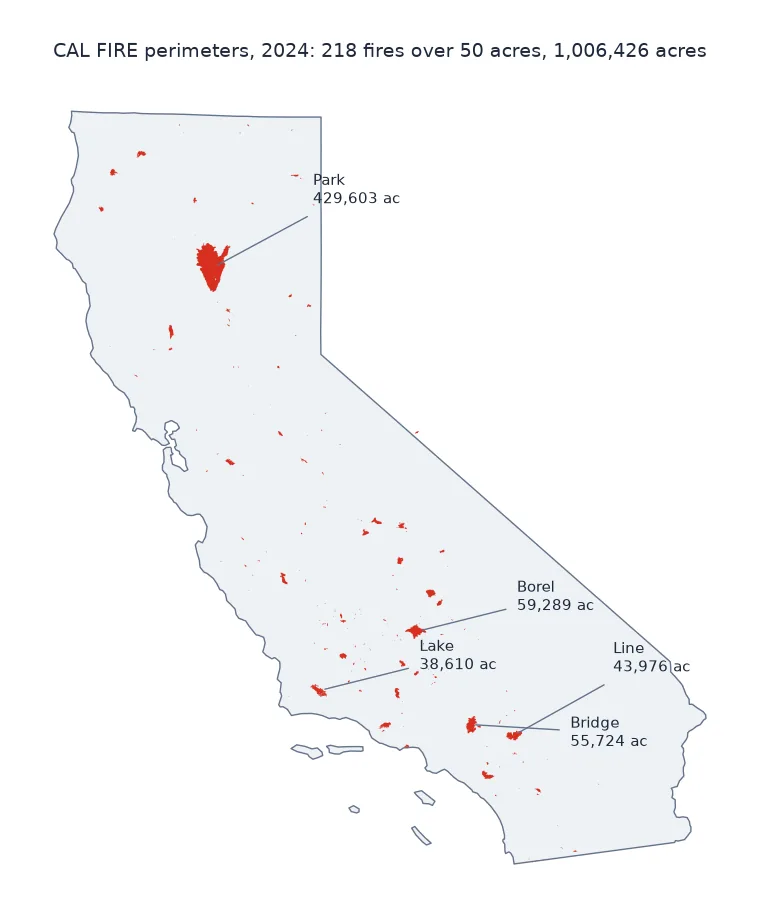
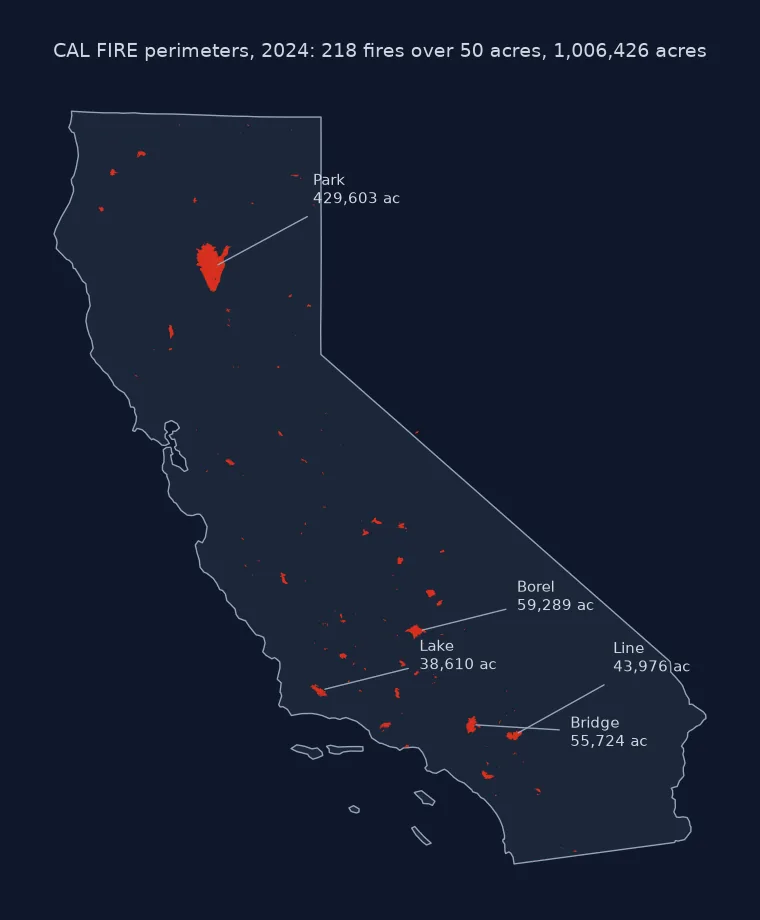
Query, decode, check areas, repair geometry
1. Query the service
ArcGIS feature services answer a query request with any where clause; outSR=4326 and f=geojson return standard GeoJSON. This view holds the last five years of perimeters, and only fires over 50 acres: its definition query says so. That keeps it well under the service's 2,000-record page size, so one request fetches it all:
print(f"{len(raw)} features; service page size {META['maxRecordCount']}; years {sorted(raw.YEAR_.unique().tolist())}")
print("view filter:", META.get("viewDefinitionQuery"))
print(raw[["YEAR_", "FIRE_NAME", "GIS_ACRES", "CAUSE", "ALARM_DATE"]].head(3).to_string(index=False))
746 features; service page size 2000; years [2021, 2022, 2023, 2024, 2025]
view filter: YEAR_ IN (2024,2025,2021,2022,2023) AND GIS_ACRES > 50
YEAR_ FIRE_NAME GIS_ACRES CAUSE ALARM_DATE
2025 GIFFORD 131613.50 14 1754006400000
2025 MADRE 80779.10 14 1751414400000
2025 GARNET 60019.23 1 1755993600000
2. Decode the codes from the service
CAUSE, AGENCY and C_METHOD are numeric or short codes. Their meanings are published in the layer's metadata as coded-value domains. Read them from there instead of typing them in:
print(f"{len(CAUSE)} cause codes from the service, e.g. 7 = {CAUSE[7]!r}, 11 = {CAUSE[11]!r}")
by_cause = fires.groupby(fires.CAUSE.map(CAUSE)).acres_calc.sum().sort_values(ascending=False)
print((by_cause / by_cause.sum()).head(5).map("{:.0%}".format).to_string())
19 cause codes from the service, e.g. 7 = 'Arson', 11 = 'Electrical Power'
CAUSE
Unknown / Unidentified 32%
Lightning 32%
Electrical Power 21%
Arson 10%
Miscellaneous 2%
3. Check areas against the official acreage
Compute areas in an equal-area projection and compare with GIS_ACRES. For the large fires they should agree closely:
big = fires[fires.GIS_ACRES > 1000]
ratio = big.acres_calc / big.GIS_ACRES
print(f"{len(big)} fires over 1,000 acres: computed / official median {ratio.median():.4f}, range {ratio.min():.3f}–{ratio.max():.3f}")
176 fires over 1,000 acres: computed / official median 1.0000, range 0.942–1.000
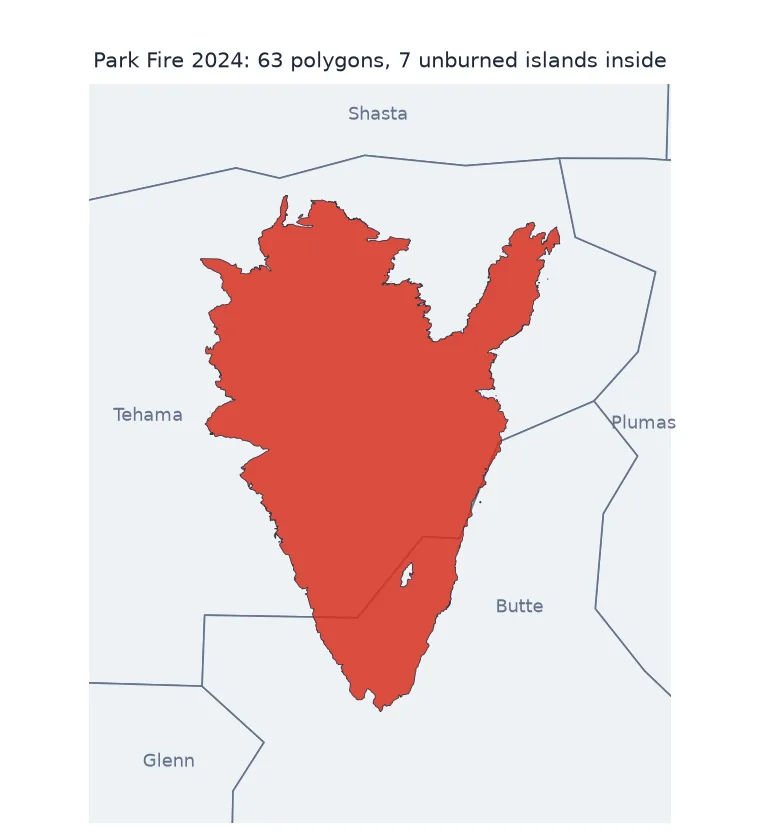
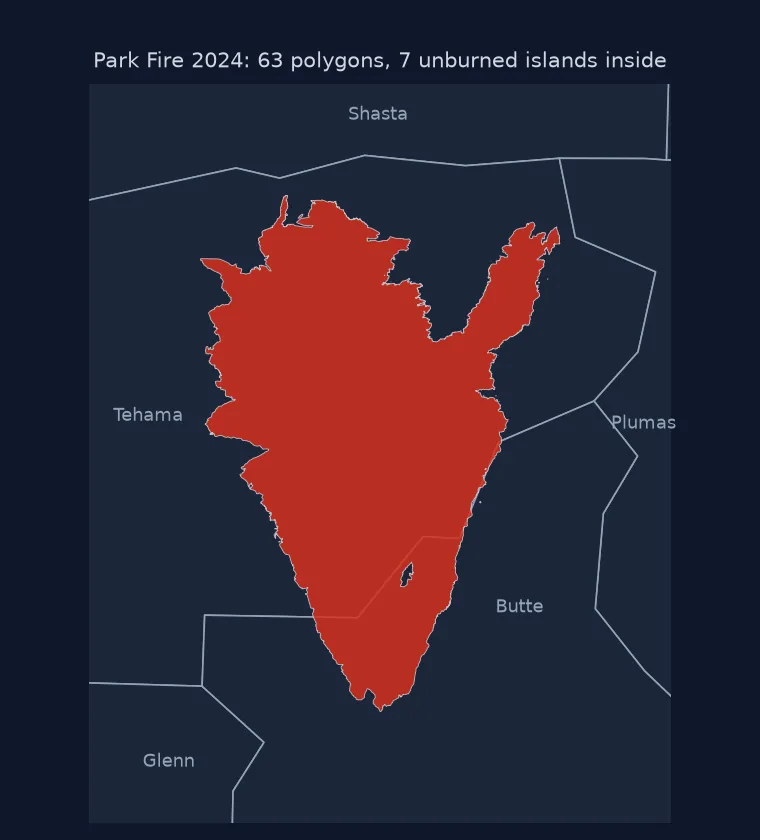
4. Repair invalid geometry
Hand-edited perimeters often contain self-intersections. Shapely flags them, and area or overlay operations on them can fail or give wrong answers:
print(f"invalid geometries as downloaded: {(~raw.geometry.is_valid).sum()} of {len(raw)} ({(~raw.geometry.is_valid).mean():.0%})")
print(f"after make_valid: {(~fires.geometry.is_valid).sum()} invalid")
invalid geometries as downloaded: 94 of 746 (13%)
after make_valid: 0 invalid
A season map of California fires
The data used on this page
CAL FIRE California Fire Perimeters, last-five-years public view (California_Fire_Perimeters_last_5_years_View on ArcGIS Online), and the 2023 state outline from the Census Bureau's cartographic boundary files.
from pathlib import Path

import geopandas as gpd
import matplotlib
matplotlib.use("Agg")
import matplotlib.pyplot as plt
import pandas as pd
import requests

Path("data").mkdir(exist_ok=True)
LAYER = "https://services1.arcgis.com/jUJYIo9tSA7EHvfZ/arcgis/rest/services/California_Fire_Perimeters_last_5_years_View/FeatureServer/0"
GEOJSON = Path("data/calfire_last5.geojson")
if not GEOJSON.exists():
    r = requests.get(LAYER + "/query", params={"where": "1=1", "outFields": "*", "outSR": 4326, "f": "geojson"}, timeout=300)
    GEOJSON.write_bytes(r.content)
META = requests.get(LAYER, params={"f": "json"}, timeout=60).json()
DOMAINS = {f["name"]: {c["code"]: c["name"] for c in f["domain"]["codedValues"]} for f in META["fields"] if f.get("domain")}
CAUSE = DOMAINS["CAUSE"]
raw = gpd.read_file(GEOJSON)
if not Path("data/cb_2023_us_state_20m.zip").exists():
    Path("data/cb_2023_us_state_20m.zip").write_bytes(requests.get("https://www2.census.gov/geo/tiger/GENZ2023/shp/cb_2023_us_state_20m.zip", timeout=300).content)
CA = gpd.read_file("data/cb_2023_us_state_20m.zip").query("STUSPS == 'CA'").to_crs(3310)
print(f"{len(raw)} perimeters downloaded; {len(DOMAINS)} coded fields: {sorted(DOMAINS)}")
746 perimeters downloaded; 6 coded fields: ['AGENCY', 'CAUSE', 'C_METHOD', 'OBJECTIVE', 'STATE', 'UNIT_ID']
Example 1: a season map
fig, ax = plt.subplots(figsize=(6, 8))
CA.plot(ax=ax, color="#f2efe9", edgecolor="#888888", lw=0.5)
y24.plot(ax=ax, color="#c0392b", edgecolor="none")
y24.nlargest(5, "acres_calc").apply(lambda r: ax.annotate(r.FIRE_NAME.title(), r.geometry.representative_point().coords[0],
                                                          fontsize=7, ha="center"), axis=1)
ax.set_axis_off(); fig.savefig("data/ca_fires_2024.png", dpi=150)
print("largest 2024 fires:", ", ".join(f"{r.FIRE_NAME.title()} {r.acres_calc:,.0f}" for _, r in y24.nlargest(5, "acres_calc").iterrows()))
largest 2024 fires: Park 429,603, Borel 59,289, Bridge 55,724, Line 43,976, Lake 38,610
Three habits of perimeter data that catch people out
A perimeter dataset is a polygon layer with an attribute table, but three of its habits catch people out. Attributes are coded, with the codes explained elsewhere, in the service metadata or a PDF. Geometry is drawn by people under time pressure from GPS tracks, infrared flights and imagery, so self-intersections are common. And the official acreage is computed by the agency in its own projection, so your area should be computed in an equal-area projection to compare.
Once those are handled, a perimeter layer answers the first questions directly: how much burned, where, from what cause. Most later analysis is an overlay of the perimeter with another layer: earlier perimeters to find reburns, buildings to count exposure, satellite images to grade severity. That is why getting the perimeters clean is worth the effort.
Epoch dates, interim perimeters and complexes
- Dates are milliseconds since 1970 in UTC; convert with
pd.to_datetime(..., unit="ms"). - Older and smaller fires: the full CAL FIRE archive (
California_Historic_Fire_Perimeters) goes back over a century and includes fires under 50 acres; this view covers only the last five years and drops them (see why most wildfires are missing from perimeter data). - Final vs interim: perimeters are revised after a fire; check the dates and
C_METHOD(collection method). - Complexes: several fires managed together share
COMPLEX_NAME; decide whether to count them separately. - Outside California: NIFC's WFIGS services publish perimeters nationally with different field names.
Internal links
- How to work with fire perimeter data — the national interagency perimeters
- Why is my fire area wrong? — Web Mercator areas
- How to find areas that burned before — overlaying perimeters
FAQ
Where can I download wildfire perimeters for California?
CAL FIRE publishes them through public ArcGIS feature services (all years and a last-five-years view) and as downloadable geodatabases; NIFC publishes national perimeters.
How do I query an ArcGIS feature service in Python?
Send a GET request to the layer's /query endpoint with where, outFields, outSR=4326 and f=geojson, then read the response with GeoPandas. Page with resultOffset if there are more features than the page size.
What do the CAUSE codes mean?
Read them from the layer metadata (?f=json), where each coded field lists its values: in CAL FIRE's perimeters 7 is arson, 11 electrical power, 1 lightning.
Why is my computed fire area different from the official acreage?
Usually because the area was computed in degrees or Web Mercator; use an equal-area projection such as California Albers (EPSG:3310).