
How to Use NOAA HMS Satellite Fire Points in Python
On this page
Problem statement
NOAA's Hazard Mapping System (HMS) publishes a daily file of fire detections over North America from several satellites at once. It holds GOES geostationary detections every few minutes, VIIRS detections from the polar-orbiting NOAA-20 and NOAA-21 satellites, and points added by NOAA analysts who review the imagery. It is one of the easiest open sources of fire locations: no account, no key, one text file per day. Using it well means knowing that the sources differ enormously. VIIRS pixels are 375 m across and pass over a few times a day; GOES pixels are kilometres across and come every few minutes. A count of "fire points" mixes the two unless you separate them.
This page reads four days of HMS fire points for the 2024 Park Fire and compares what each satellite saw.
Quick answer
Read the comma-separated text with whitespace stripped, build a UTC timestamp from the day-of-year and HHMM fields, and keep the points near the fire:
frames = []
for d in DAYS:
    t = pd.read_csv(fetch(d), skipinitialspace=True)
    t.columns = t.columns.str.strip()
    frames.append(t)
hms = pd.concat(frames, ignore_index=True)
hms["source"] = hms.Satellite.str.strip() + " " + hms.Method.str.strip()
hms["time"] = pd.to_datetime(hms.YearDay.astype(str) + hms.Time.astype(str).str.zfill(4), format="%Y%j%H%M", utc=True)
pts = gpd.GeoDataFrame(hms, geometry=gpd.points_from_xy(hms.Lon, hms.Lat), crs=4326).to_crs(3310)
park = pts[pts.within(PARK.buffer(1000))]
print(f"{len(hms):,} HMS fire points over North America on {len(DAYS)} days; {len(park):,} within 1 km of the Park Fire")
print(park.source.value_counts().to_string())
147,627 HMS fire points over North America on 4 days; 23,779 within 1 km of the Park Fire
source
GOES-EAST FDC 11762
NOAA 21 VIIRS 6258
NOAA 20 VIIRS 4861
GOES-WEST ANALYSIS 267
GOES-EAST ANALYSIS 251
NOAA 20 ANALYSIS 214
NOAA 21 ANALYSIS 166
Separate sources, overpass times, compared detail
1. Separate the sources
Each row names its satellite and method. FDC rows are GOES automated detections, VIIRS rows come from the polar orbiters, and ANALYSIS rows are points an analyst added. Count by source and day:
local_day = park.time.dt.tz_convert("America/Los_Angeles").dt.date
print(park.groupby([local_day.rename("day"), "source"]).size().unstack(fill_value=0).to_string())
source GOES-EAST ANALYSIS GOES-EAST FDC GOES-WEST ANALYSIS NOAA 20 ANALYSIS NOAA 20 VIIRS NOAA 21 ANALYSIS NOAA 21 VIIRS
day
2024-07-24 208 1545 0 0 1 0 0
2024-07-25 43 7752 162 43 1642 43 1979
2024-07-26 0 1757 69 108 1661 85 2039
2024-07-27 0 708 36 63 1557 38 2240
2. See when each satellite looks
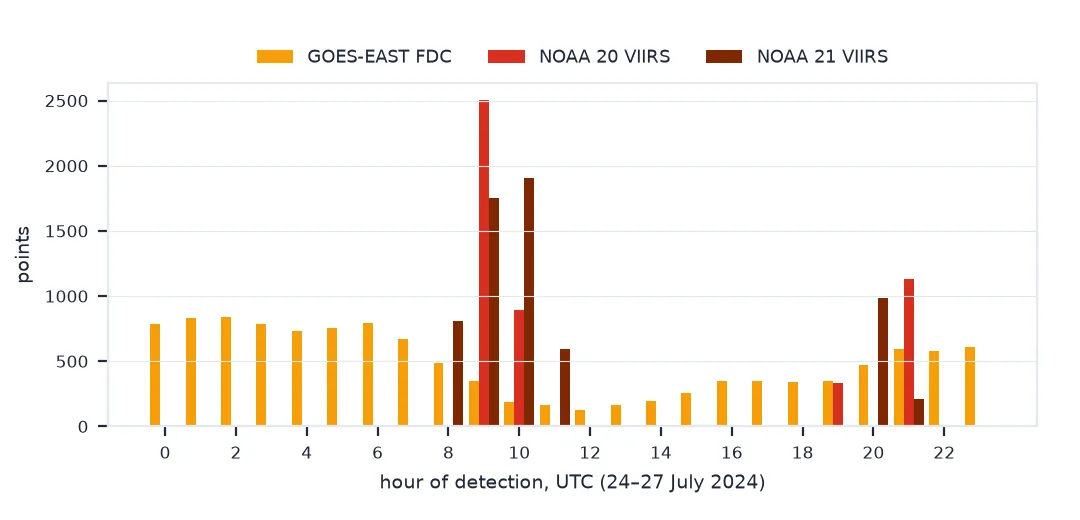
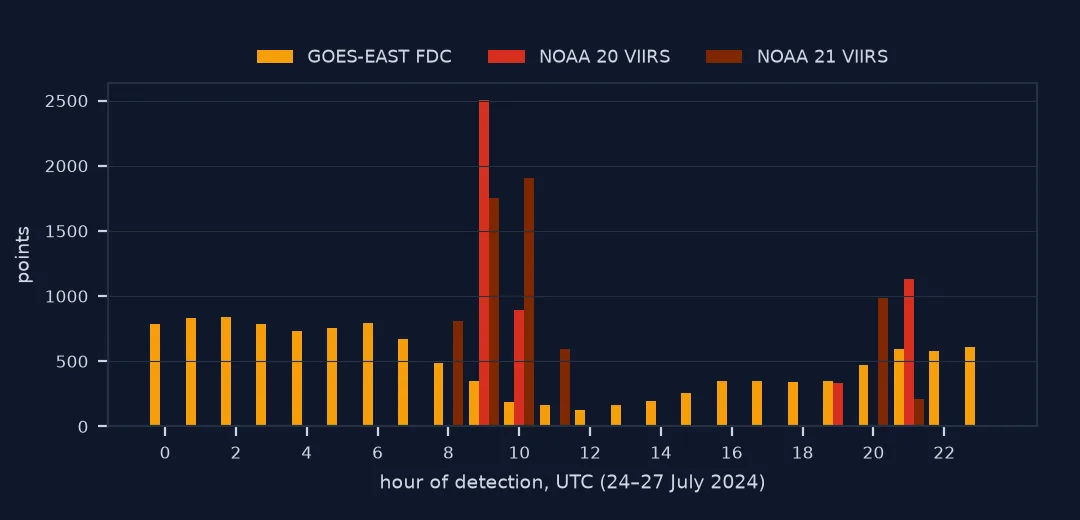
VIIRS sees a given place only when its satellite passes overhead, about twice a day each. GOES-East looks continuously. The hours of the detections show it:
hour = park.time.dt.hour
for s in ("NOAA 20 VIIRS", "NOAA 21 VIIRS", "GOES-EAST FDC"):
    h = hour[park.source == s].value_counts().sort_index()
    print(f"{s:14s}: UTC hours with detections {h.index.tolist()}")
NOAA 20 VIIRS : UTC hours with detections [9, 10, 19, 21]
NOAA 21 VIIRS : UTC hours with detections [8, 9, 10, 11, 20, 21]
GOES-EAST FDC : UTC hours with detections [0, 1, 2, 3, 4, 5, 6, 7, 8, 9, 10, 11, 12, 13, 14, 15, 16, 17, 18, 19, 20, 21, 22, 23]
3. Compare the detail
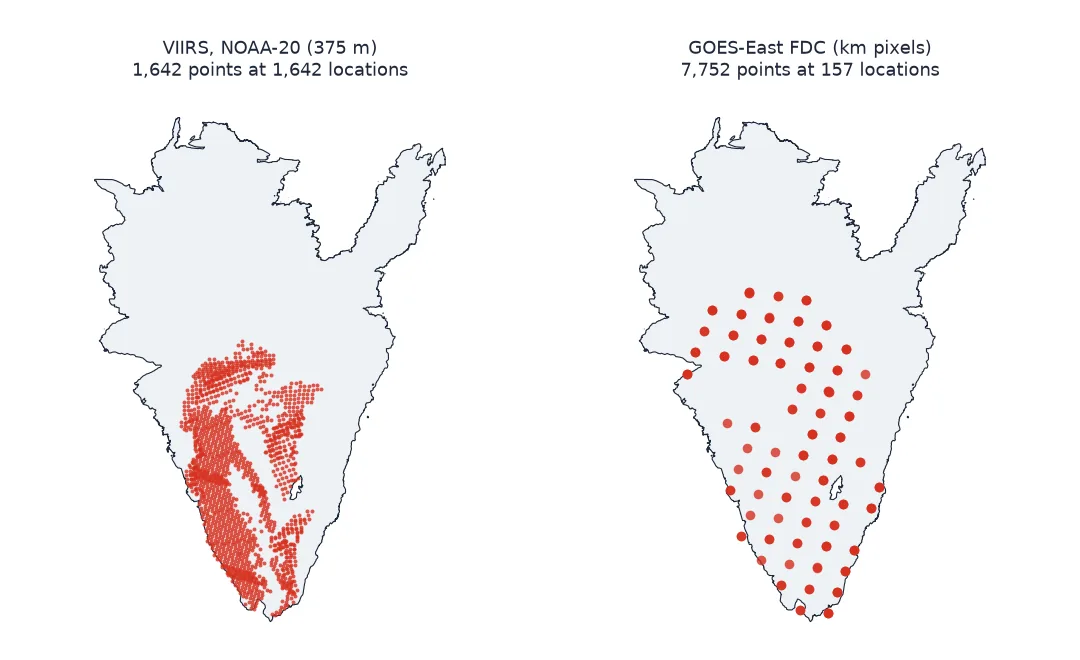
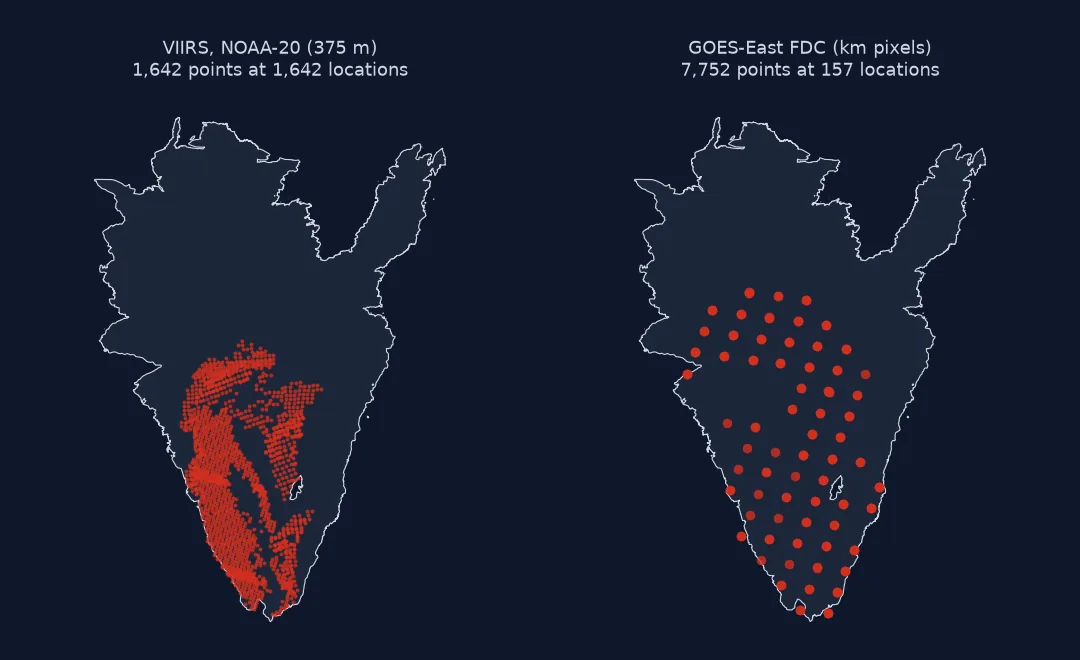
On one day, how many distinct locations does each sensor report across the same fire? VIIRS's small pixels resolve the fire front; GOES's large pixels report the same few cells again and again:
day = park[local_day == pd.Timestamp("2024-07-25").date()]
for s in ("NOAA 20 VIIRS", "NOAA 21 VIIRS", "GOES-EAST FDC"):
    sub = day[day.source == s]
    print(f"{s:14s}: {len(sub):>5,} points at {sub.drop_duplicates(['Lon', 'Lat']).shape[0]:>5,} distinct locations, "
          f"median FRP {sub.FRP.replace(-999, np.nan).median():.1f} MW")
NOAA 20 VIIRS : 1,642 points at 1,642 distinct locations, median FRP 14.9 MW
NOAA 21 VIIRS : 1,979 points at 1,979 distinct locations, median FRP 9.9 MW
GOES-EAST FDC : 7,752 points at 157 distinct locations, median FRP 701.2 MW
VIIRS points as a GeoJSON layer
The data used on this page
NOAA Hazard Mapping System fire and smoke product, daily fire point text files dated 24–27 July 2024, and the Park Fire perimeter from CAL FIRE's last-five-years perimeter service, both projected to California Albers (EPSG:3310).
from pathlib import Path

import geopandas as gpd
import numpy as np
import pandas as pd
import requests

Path("data").mkdir(exist_ok=True)
DAYS = pd.date_range("2024-07-24", "2024-07-27")
HMS = "https://satepsanone.nesdis.noaa.gov/pub/FIRE/web/HMS/Fire_Points/Text/"


def fetch(d):
    f = Path(f"data/hms_fire{d:%Y%m%d}.txt")
    if not f.exists():
        f.write_bytes(requests.get(f"{HMS}{d:%Y/%m}/{f.name}", timeout=120).content)
    return f


perims = gpd.read_file(requests.get("https://services1.arcgis.com/jUJYIo9tSA7EHvfZ/arcgis/rest/services/California_Fire_Perimeters_last_5_years_View/FeatureServer/0/query",
                                    params={"where": "FIRE_NAME='PARK' AND YEAR_=2024", "outFields": "FIRE_NAME", "outSR": 4326, "f": "geojson"}, timeout=120).text)
PARK = perims.to_crs(3310).geometry.make_valid().union_all()
print(f"{len(DAYS)} HMS days; Park Fire {PARK.area / 1e6:,.0f} km²")
4 HMS days; Park Fire 1,739 km²
Example 1: VIIRS points as a GeoJSON layer
viirs = park[park.Method.str.strip() == "VIIRS"].to_crs(4326)[["source", "time", "FRP", "geometry"]]
viirs.assign(time=viirs.time.dt.strftime("%Y-%m-%dT%H:%MZ")).to_file("data/park_viirs.geojson", driver="GeoJSON")
print(f"{len(viirs):,} VIIRS points written")
11,119 VIIRS points written
A merged product that is easy to misread
HMS is a merged product: it brings detections from different satellites and algorithms into one daily file, and analysts add points the algorithms miss. That makes it convenient and easy to misread. On 25 July, 7,752 GOES-East points over the Park Fire came from just 157 locations, seen again and again. NOAA-20's 1,642 VIIRS points came from 1,642 separate places along the fire, each seen once. Counting points without separating the sources mostly measures how often each satellite looked.
The two kinds of detection answer different questions. VIIRS at 375 m maps where the fire is burning at the moment of an overpass, fine enough to follow the front. GOES at kilometre scale shows when it is burning, continuously, as on the GOES pages in this cluster. HMS puts both in one file, with the satellite and method on every row to keep them apart.
File boundaries, missing FRP and analyst points
- A file is not a day: in these files the GOES detections run from 06:00 UTC on the file's date to 05:56 UTC the next day, and the VIIRS detections fall within the UTC date. Group by
YearDayandTime, never by file; see why daily fire counts land on the wrong day. - FRP of -999 marks a missing value (common for analyst points); exclude it before averaging.
- Whitespace: the columns are padded with spaces;
skipinitialspace=Trueand stripping the names are needed. - Analyst points are added where algorithms miss fires, often small agricultural burns; keep or drop them deliberately.
- Recent files may be revised; the archive is the final version.
Internal links
- How to track a wildfire with GOES detections — the geostationary side in full
- How to map smoke plumes from HMS — HMS's other product
FAQ
What is the NOAA Hazard Mapping System?
A NOAA product in which analysts combine satellite fire detections and draw smoke plumes over North America every day, published as text and shapefiles.
How do I read HMS fire points in Python?
pd.read_csv(path, skipinitialspace=True), strip the column names, and build times from YearDay and Time (HHMM, UTC).
What is the difference between VIIRS and GOES fire detections?
VIIRS has 375 m pixels and passes over each place a few times a day; GOES has kilometre-scale pixels and observes every few minutes.
Why are there so many GOES points in HMS?
GOES reports the same pixels in every scan, so a burning area produces a point every few minutes.