
How to Measure Exposure in Rings Around a Fire Perimeter in Python
On this page
Problem statement
A fire perimeter is a hard line on a map, but the hazard it describes fades out on both sides. Deep inside, almost everything burned. Near the edge, firefighting, roads and luck saved some structures. Just outside, embers still reached a few. Questions such as "how many homes are within a kilometre of the fire?" or "how far did damage extend beyond the line?" need distance rings, not a single polygon.
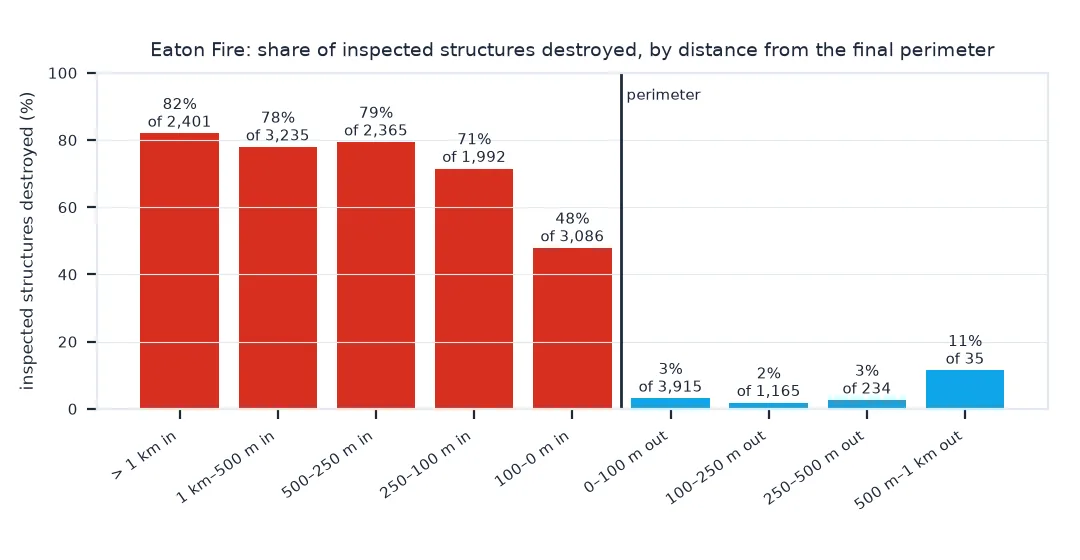
This page builds rings at set distances inside and outside the 2025 Eaton Fire perimeter. It counts Overture building footprints in each ring and uses CAL FIRE's damage inspections to show how the share of structures destroyed changes with distance from the edge.
Quick answer
Work in metres. Compute each building's signed distance to the perimeter edge (negative inside), then cut it into rings:
pts = BUILDINGS.geometry.representative_point()
inside = pts.within(PERIM)
BUILDINGS["dist_m"] = np.where(inside, -1, 1) * pts.distance(PERIM.boundary)
rings = pd.cut(BUILDINGS.dist_m, [-np.inf, 0, 100, 500, 1000, 2000], labels=["inside", "0–100 m", "100–500 m", "500 m–1 km", "1–2 km"])
print(rings.value_counts(sort=False).to_string())
print(f"buildings outside but within 1 km of the perimeter: {((BUILDINGS.dist_m > 0) & (BUILDINGS.dist_m <= 1000)).sum():,}")
dist_m
inside 11009
0–100 m 3733
100–500 m 13230
500 m–1 km 13289
1–2 km 20548
buildings outside but within 1 km of the perimeter: 30,252
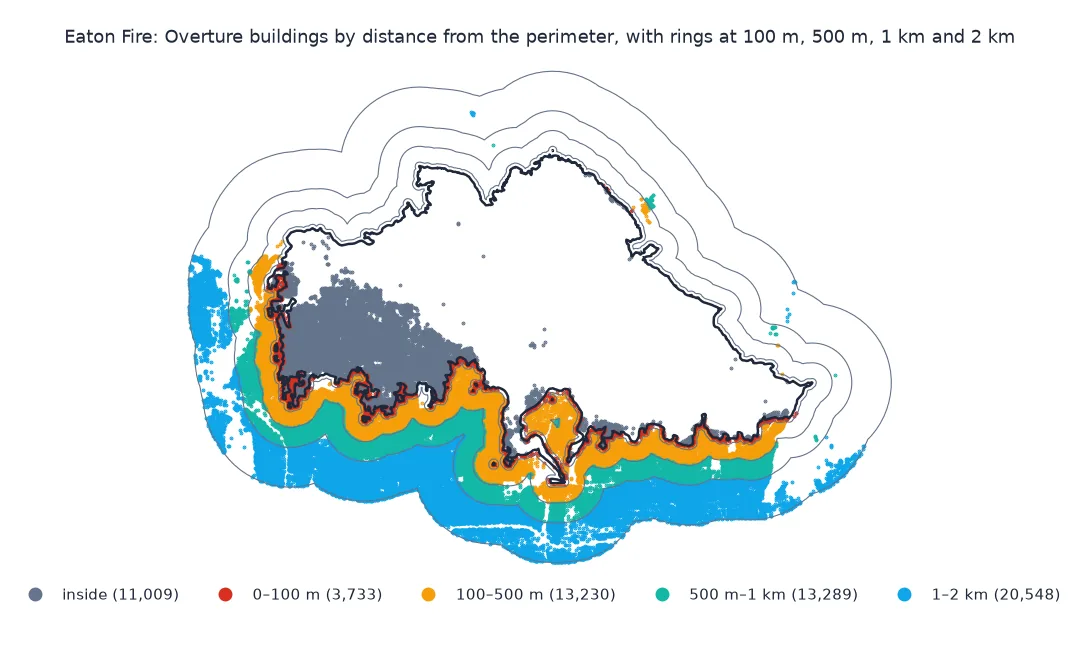
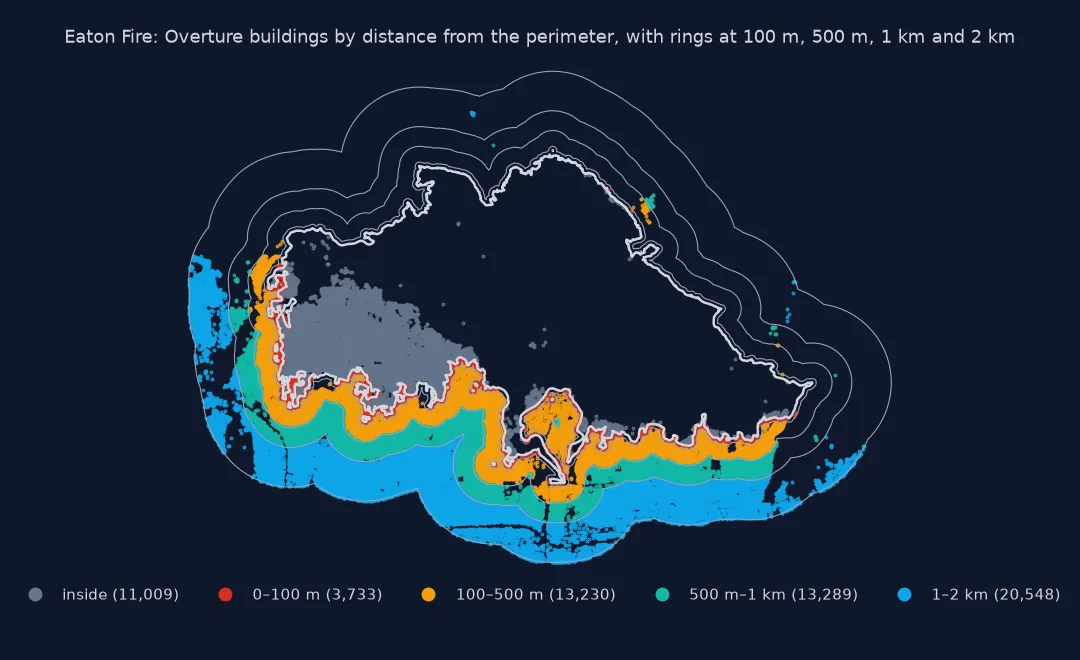
Signed distance, damage by distance, enough data reach
1. Use signed distance rather than nested buffers
The textbook method is to buffer the perimeter at each distance and subtract the smaller buffer from the larger to make donut rings. It works, but every ring is another polygon operation on a complex outline, and inside rings need negative buffers. One distance per building to the perimeter's boundary gives all rings, inside and out, from a single calculation:
ring100 = PERIM.buffer(100).difference(PERIM)
by_buffer = pts.within(ring100).sum()
by_distance = ((BUILDINGS.dist_m > 0) & (BUILDINGS.dist_m <= 100)).sum()
print(f"0–100 m ring: {by_buffer:,} buildings by buffer difference, {by_distance:,} by signed distance")
0–100 m ring: 3,733 buildings by buffer difference, 3,733 by signed distance
The two agree exactly here. A buffer is a polygon approximating the offset outline, so on tight curves it can differ from the exact distance by a building or two; the distance needs no polygon at all.
2. Measure damage by distance from the edge
Attach a signed distance to each damage inspection and compute the share destroyed per ring:
d_in = DINS.within(PERIM)
DINS["dist_m"] = np.where(d_in, -1, 1) * DINS.distance(PERIM.boundary)
edges = [-np.inf, -1000, -500, -250, -100, 0, 100, 250, 500, 1000]
DINS["ring"] = pd.cut(DINS.dist_m, edges)
t = DINS.groupby("ring", observed=False).agg(inspected=("DAMAGE", "size"), destroyed=("DAMAGE", lambda s: s.str.startswith("Destroyed").sum()))
t["share destroyed"] = t.destroyed / t.inspected
print(t.to_string(formatters={"share destroyed": "{:.0%}".format}))
print(f"inspections more than 1 km outside the perimeter: {(DINS.dist_m > 1000).sum()}")
inspected destroyed share destroyed
ring
(-inf, -1000.0] 2401 1968 82%
(-1000.0, -500.0] 3235 2520 78%
(-500.0, -250.0] 2365 1877 79%
(-250.0, -100.0] 1992 1424 71%
(-100.0, 0.0] 3086 1477 48%
(0.0, 100.0] 3915 122 3%
(100.0, 250.0] 1165 21 2%
(250.0, 500.0] 234 6 3%
(500.0, 1000.0] 35 4 11%
inspections more than 1 km outside the perimeter: 0
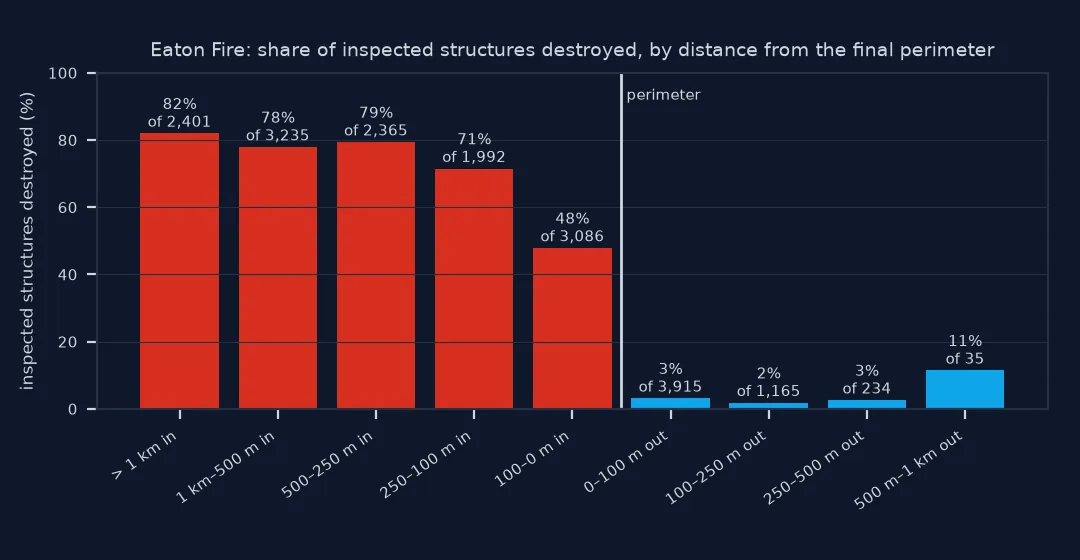
3. Make sure the data reaches the outer ring
A footprint download clipped to the perimeter's bounding box, or a box only slightly larger, silently truncates the outer rings. Compare the 1–2 km ring counted from a box padded by 0.01° with one padded far enough:
x0, y0, x1, y1 = PERIM_LL.total_bounds
small = pts.to_crs(4326)
in_small_box = (small.x > x0 - 0.01) & (small.x < x1 + 0.01) & (small.y > y0 - 0.01) & (small.y < y1 + 0.01)
far = (BUILDINGS.dist_m > 1000) & (BUILDINGS.dist_m <= 2000)
print(f"1–2 km ring: {far.sum():,} buildings with the wide download, {(far & in_small_box).sum():,} with a 0.01° pad")
1–2 km ring: 20,548 buildings with the wide download, 17,012 with a 0.01° pad
The narrow download misses a sixth of the ring, with no error. At 34° N, 0.01° is about 1.1 km north–south and 0.9 km east–west, less than the ring's outer edge. Pad the download by more than the largest ring, in metres converted at the right latitude.
Exposure at several distances from the Eaton Fire
The data used on this page
The Eaton Fire perimeter from CAL FIRE's historic fire perimeter layer, CAL FIRE's Damage Inspection (DINS) public view for the fire, and Overture Maps building footprints for the perimeter's bounding box padded by 0.03° (about 3 km), read with DuckDB. All are projected to California Albers (EPSG:3310).
import re
from pathlib import Path

import duckdb
import geopandas as gpd
import numpy as np
import pandas as pd
import requests

Path("data").mkdir(exist_ok=True)
SERVICES = "https://services1.arcgis.com/jUJYIo9tSA7EHvfZ/arcgis/rest/services/"
PERIM_LL = gpd.read_file(requests.get(SERVICES + "California_Historic_Fire_Perimeters/FeatureServer/0/query",
                                      params={"where": "FIRE_NAME = 'EATON' AND YEAR_ = 2025", "outFields": "FIRE_NAME,GIS_ACRES",
                                              "outSR": 4326, "f": "geojson"}, timeout=120).text)
rows, offset = [], 0
while True:
    page = requests.get(SERVICES + "DINS_2025_Eaton_Public_View/FeatureServer/0/query",
                        params={"where": "1=1", "outFields": "DAMAGE", "outSR": 4326, "resultOffset": offset, "resultRecordCount": 2000, "f": "json"},
                        timeout=120).json()
    rows += [dict(f["attributes"], x=f["geometry"]["x"], y=f["geometry"]["y"]) for f in page["features"]]
    offset += len(page["features"])
    if not page.get("exceededTransferLimit"):
        break
dins = pd.DataFrame(rows)
DINS = gpd.GeoDataFrame(dins, geometry=gpd.points_from_xy(dins.x, dins.y), crs=4326).to_crs(3310)
FOOT = Path("data/eaton_buildings_3km.parquet")
if not FOOT.exists():
    listing = requests.get("https://overturemaps-us-west-2.s3.amazonaws.com/", params={"list-type": "2", "prefix": "release/", "delimiter": "/"}, timeout=60).text
    release = sorted(re.findall(r"<Prefix>release/([^<]+)/</Prefix>", listing))[-1]
    x0, y0, x1, y1 = PERIM_LL.total_bounds + [-0.03, -0.03, 0.03, 0.03]
    con = duckdb.connect()
    con.execute("install httpfs; load httpfs; install spatial; load spatial; set s3_region = 'us-west-2'; set enable_progress_bar = false")
    con.execute(f"""copy (select id, geometry
                          from read_parquet('s3://overturemaps-us-west-2/release/{release}/theme=buildings/type=building/*.parquet', hive_partitioning = 0)
                          where bbox.xmin < {x1} and bbox.xmax > {x0} and bbox.ymin < {y1} and bbox.ymax > {y0})
                    to '{FOOT}' (format parquet)""")
BUILDINGS = gpd.read_parquet(FOOT).to_crs(3310)
PERIM = PERIM_LL.to_crs(3310).geometry.make_valid().union_all()
print(f"{len(BUILDINGS):,} footprints; {len(DINS):,} inspections; perimeter {PERIM.area / 1e6:.1f} km²")
108,768 footprints; 18,428 inspections; perimeter 56.9 km²
Example 1: exposure at several distances
for r in (100, 500, 1000, 2000):
    n = ((BUILDINGS.dist_m > 0) & (BUILDINGS.dist_m <= r)).sum()
    print(f"within {r:>5,} m outside the perimeter: {n:>6,} buildings")
print(f"inside the perimeter: {(BUILDINGS.dist_m <= 0).sum():,}")
within 100 m outside the perimeter: 3,733 buildings
within 500 m outside the perimeter: 16,963 buildings
within 1,000 m outside the perimeter: 30,252 buildings
within 2,000 m outside the perimeter: 50,800 buildings
inside the perimeter: 11,009
From inside-or-outside to a gradient
Distance rings turn a binary map, inside or outside, into a gradient, which is closer to how fire damage behaves. Here the share of inspected structures destroyed stays around 80% more than 250 m inside the line. It falls to about half in the last 100 m, as firefighting, roads and gaps in fuel stop the fire at the edge, and drops to a few per cent just outside. A ring analysis shows that edge directly, where a single polygon hides it.
The same rings serve exposure questions before a fire as well as after one: how many buildings lie within a given distance of a fire's edge, of a fire-prone area or of a forecast spread. The distances need to be in metres, in a projected CRS, and the data need to extend past the outermost ring. Signed distances make inside and outside rings one calculation, and points (a representative point per building) make each building fall in exactly one ring.
Points versus footprints, holes and coverage
- Representative points vs footprints: a large building can span two rings; use a point to assign each building once, or intersect footprints with rings to split their area.
- Holes: unburned islands are holes in the perimeter;
PERIM.boundaryincludes their edges, so buildings in an island get a positive distance to the nearest island edge. - Inspection coverage: CAL FIRE inspected structures up to about 1 km outside here and none beyond; an empty outer ring means "not inspected", not "undamaged".
- Projection: buffers and distances in EPSG:4326 are in degrees and differ north–south and east–west.
- Several fires: for exposure to many perimeters at once, take the minimum distance to any of them.
Internal links
- How to count buildings inside a wildfire perimeter — the same data, inside the line
- Why are my fire perimeter areas wrong? — repair perimeters before buffering
FAQ
How do I find buildings within 1 km of a wildfire?
Project the perimeter and buildings to a metric CRS, compute each building's distance to the perimeter (distance to the boundary, signed by within), and select those with a distance between 0 and 1,000 m.
How do I make buffer rings in GeoPandas?
perimeter.buffer(outer).difference(perimeter.buffer(inner)) gives a ring; for many rings, a signed distance per feature cut with pd.cut is simpler.
How far from the perimeter did buildings burn in the Eaton Fire?
The share of inspected structures destroyed fell from 48% in the last 100 m inside the line to 3% in the first 100 m outside, and stayed at a few per cent beyond.
Why must the download area be larger than the buffer?
Footprints outside the downloaded area do not exist for the analysis, so outer rings come out too small without any error.