
Fire Return Interval and Fire Rotation Explained
On this page
Problem statement
"This forest burns every 25 years" and "this landscape has a 70-year fire cycle" can both be computed from the same fire history, for the same place. They answer different questions. The fire return interval is the time between successive fires at one spot. The fire rotation is the time it takes to burn an area equal to the whole landscape once. Time since fire is how long a spot has gone unburned. Mixing them up, or computing an interval only where two fires happened, gives numbers that sound precise and mean something else.
This page computes all three on a 250 m grid from CAL FIRE's perimeter history (1950–2025) for the foothills around the 2024 Park Fire. It shows why the average interval comes out much shorter than the rotation.
Quick answer
Rasterise each year's perimeters onto a grid. Fire rotation is the length of the period divided by the fraction of the landscape burned, counting reburns each time:
cell_years = STACK.sum()                       # every cell burned, each time it burned
rotation = len(YEARS_ALL) / (cell_years / N_CELLS)
print(f"{N_CELLS:,} cells of 250 m; {len(YEARS)} fire years 1950–2025 burned the equivalent of {cell_years / N_CELLS:.2f} landscapes")
print(f"fire rotation 1950–2025: {rotation:.0f} years")
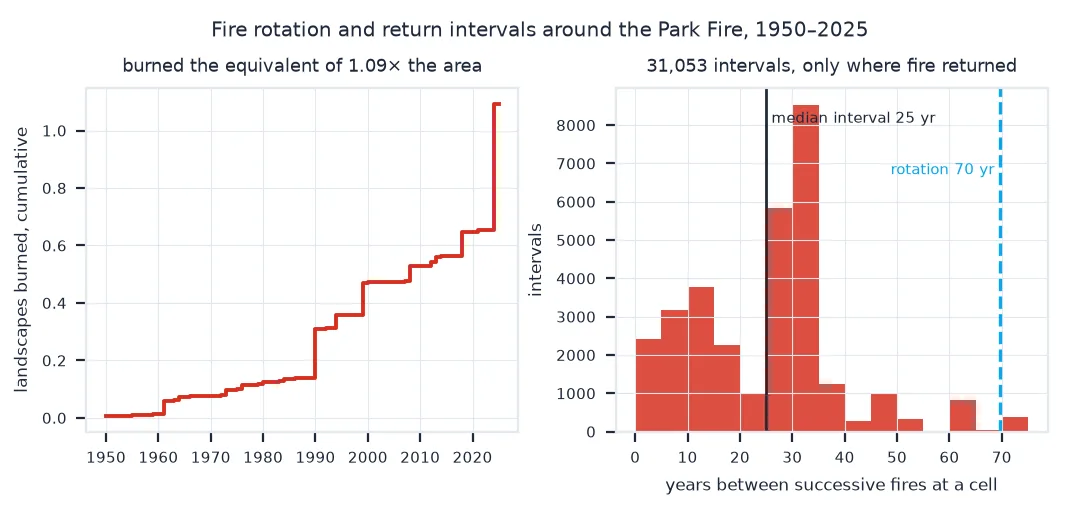
63,644 cells of 250 m; 56 fire years 1950–2025 burned the equivalent of 1.09 landscapes
fire rotation 1950–2025: 70 years
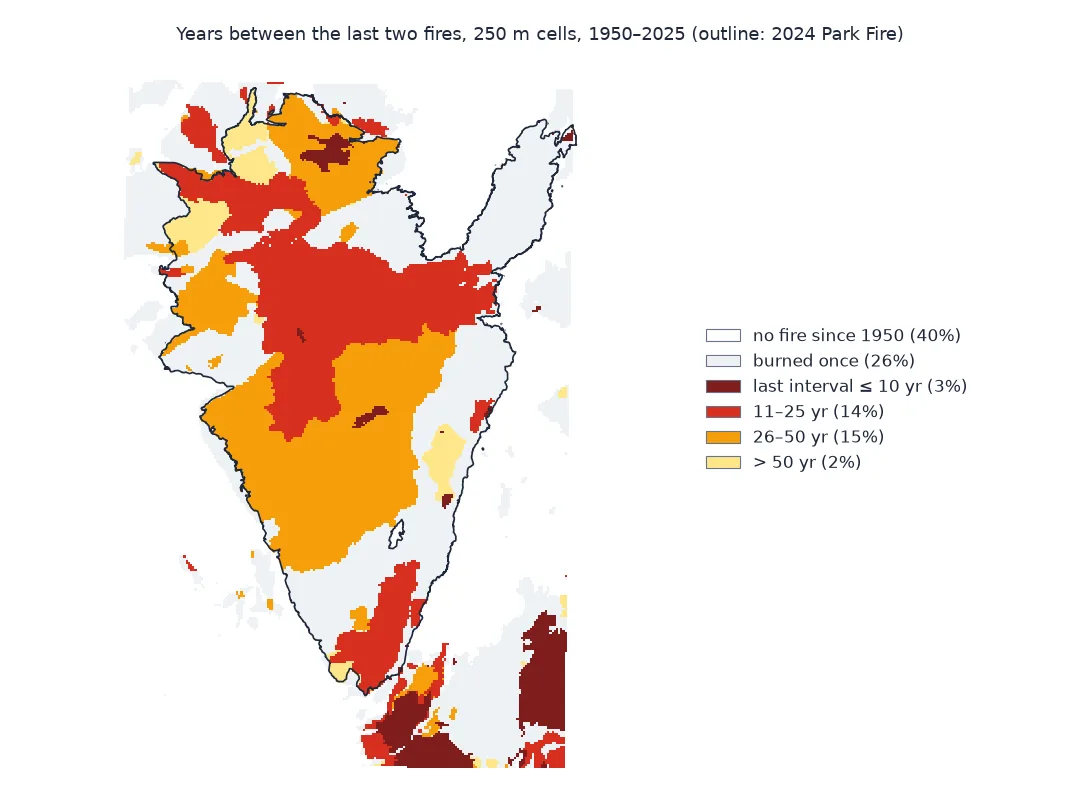
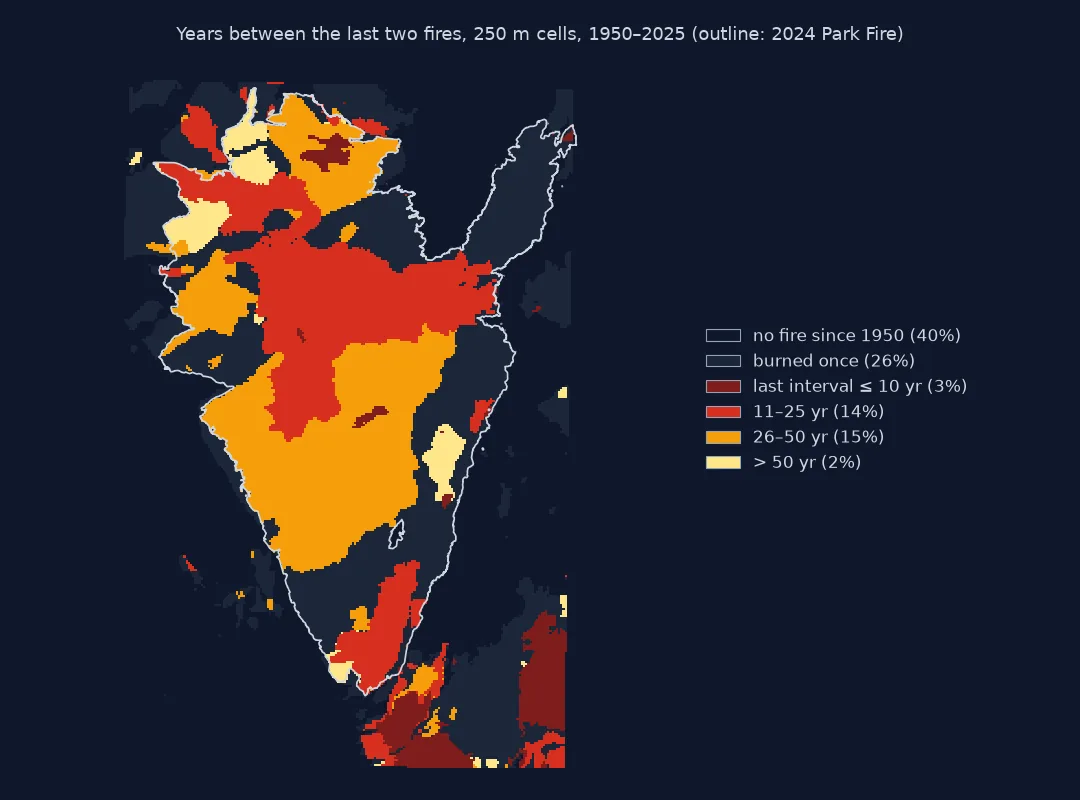
Count burns per cell, intervals where there are any, compare periods
1. Count how often each cell burned
times = STACK.sum(axis=0)[INBOX]
print("cells by number of fires since 1950:", {k: f"{v:.0%}" for k, v in enumerate(np.bincount(times) / N_CELLS)})
cells by number of fires since 1950: {0: '40%', 1: '26%', 2: '23%', 3: '9%', 4: '2%', 5: '0%', 6: '0%'}
Two cells in five have no recorded fire since 1950 and so contribute no interval at all.
2. Compute intervals where there are any
The return interval at a cell is the gap between successive fires there. It exists only where at least two fires were recorded:
gaps = []
for j, i in zip(*np.nonzero((STACK.sum(axis=0) >= 2) & INBOX)):
    gaps += np.diff(YEARS[STACK[:, j, i]]).tolist()
gaps = np.array(gaps)
print(f"{len(gaps):,} intervals from cells burned at least twice: median {np.median(gaps):.0f} years, "
      f"mean {gaps.mean():.1f}; {(gaps <= 10).mean():.0%} were 10 years or less")
31,053 intervals from cells burned at least twice: median 25 years, mean 24.7; 24% were 10 years or less
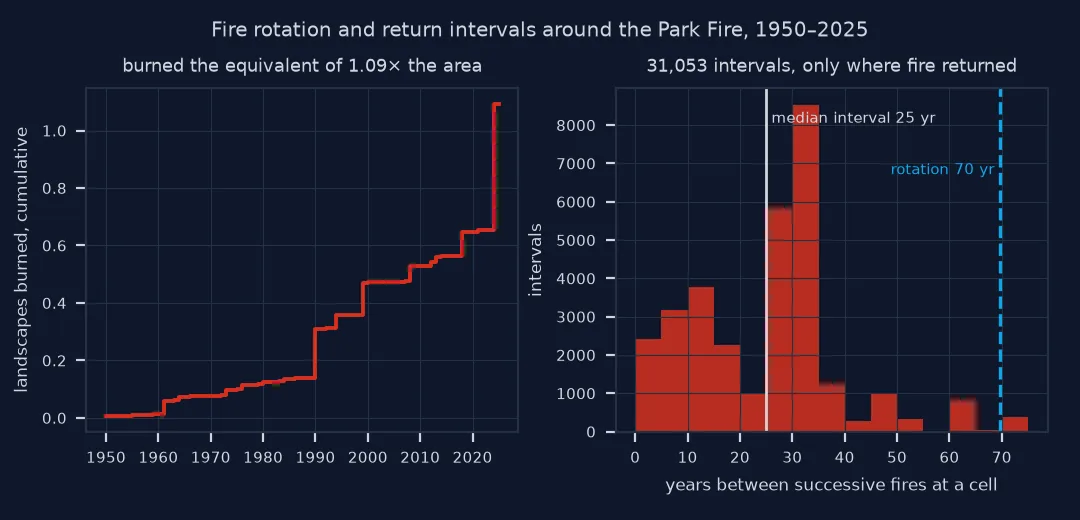
The median interval, 25 years, is about a third of the rotation. Nothing is wrong with either number; the interval is measured only where fire came back within the record, so it is biased short. A cell that burned once in 76 years, or not at all, has no interval to add.
3. Compare periods
A rotation over the whole record hides change. Compute it for two halves:
for lo, hi in ((1950, 1987), (1988, 2025)):
    sel = (YEARS >= lo) & (YEARS <= hi)
    print(f"{lo}–{hi}: rotation {(hi - lo + 1) / (STACK[sel].sum() / N_CELLS):.0f} years")
1950–1987: rotation 276 years
1988–2025: rotation 40 years
Time since the last fire
The data used on this page
CAL FIRE's historic fire perimeter database (California_Historic_Fire_Perimeters) for a box of 0.6° by 0.7° (121.5–122.1° W, 39.7–40.4° N) around the Park Fire, the same extract as on the reburn page, rasterised to 250 m cells in California Albers (EPSG:3310).
from pathlib import Path

import geopandas as gpd
import numpy as np
import requests
from rasterio import features
from rasterio.transform import from_origin
from shapely.geometry import box

Path("data").mkdir(exist_ok=True)
LAYER = "https://services1.arcgis.com/jUJYIo9tSA7EHvfZ/arcgis/rest/services/California_Historic_Fire_Perimeters/FeatureServer/0/query"
F = Path("data/park_area_history.geojson")
if not F.exists():
    F.write_bytes(requests.get(LAYER, params={"geometry": "-122.1,39.7,-121.5,40.4", "geometryType": "esriGeometryEnvelope", "inSR": 4326,
                                              "spatialRel": "esriSpatialRelIntersects", "outFields": "YEAR_,FIRE_NAME,GIS_ACRES,CAUSE",
                                              "outSR": 4326, "f": "geojson"}, timeout=300).content)
hist = gpd.read_file(F).to_crs(3310)
hist["geometry"] = hist.geometry.make_valid()
hist = hist[hist.YEAR_ >= 1950]
AOI = gpd.GeoSeries([box(-122.1, 39.7, -121.5, 40.4)], crs=4326).to_crs(3310).iloc[0]
x0, y0, x1, y1 = AOI.bounds
RES = 250
TRANSFORM = from_origin(x0, y1, RES, RES)
SHAPE = (int((y1 - y0) / RES), int((x1 - x0) / RES))
INBOX = features.rasterize([(AOI, 1)], out_shape=SHAPE, transform=TRANSFORM).astype(bool)
N_CELLS = int(INBOX.sum())
YEARS = np.array(sorted(hist.YEAR_.astype(int).unique()))
YEARS_ALL = range(1950, 2026)
STACK = np.zeros((len(YEARS), *SHAPE), bool)                     # one layer per fire year: did the cell burn?
for k, y in enumerate(YEARS):
    shapes = [(g, 1) for g in hist[hist.YEAR_ == y].geometry if not g.is_empty]
    STACK[k] = features.rasterize(shapes, out_shape=SHAPE, transform=TRANSFORM).astype(bool) & INBOX
print(f"{len(hist)} perimeters, {len(YEARS)} fire years; grid {SHAPE[1]} x {SHAPE[0]} cells")
152 perimeters, 56 fire years; grid 210 x 314 cells
Example 1: time since the last fire
last = YEARS[len(YEARS) - 1 - np.argmax(STACK[::-1], axis=0)]
burned = (STACK.sum(axis=0) > 0) & INBOX
tsf = 2025 - last[burned]
print(f"burned since 1950: {burned.sum() / N_CELLS:.0%} of cells; time since last fire: median {np.median(tsf):.0f} years")
print(f"share of the landscape burned in 2024 alone: {STACK[YEARS == 2024].sum() / N_CELLS:.0%}")
burned since 1950: 60% of cells; time since last fire: median 1 years
share of the landscape burned in 2024 alone: 44%
Three angles on a fire regime
The three measures describe a fire regime from different angles. Fire rotation is a landscape property: how long to burn the equivalent of the whole area, however the burning is distributed. A return interval is a point property: how long between fires at one place. Time since fire is a state: how much fuel has had time to build up. In a landscape where every spot burns at the same rate, the mean return interval equals the rotation. Real landscapes are patchy: some places burn again and again while others escape, so the measures diverge.
Record length makes the divergence worse. Intervals longer than the record cannot be observed, and places that burned once give none, so averaging the observed intervals over-represents the places that burn often. Ecologists handle this with survival analysis, treating the time since the last fire as an interval that has not ended yet. Fire rotation needs no such correction, but depends on how complete the perimeter record is. Here the 1950–1987 rotation of almost three centuries partly reflects fewer fires and partly fires that were never mapped.
Grid resolution, edges and severity
- Grid resolution: 250 m cells make thin slivers between perimeters vanish or merge; check that results hold at 100 m.
- Edge effects: fires crossing the box edge count only inside it; the rotation is for this box, not for the fires.
- Same-year overlaps: two perimeters in one year over one cell count once here, because each year is one layer.
- Severity: a perimeter is burned or not; a low-severity underburn and a stand-replacing fire count the same.
- Historical regimes: LANDFIRE's fire regime groups estimate pre-settlement return intervals for comparison with the recent record.
Internal links
- How to map fire history and reburns — the same perimeters, as polygons
- How to calculate wildfire season statistics — burned area through time for the whole state
FAQ
What is a fire return interval?
The time between successive fires at the same place. Averaged over places it describes how often fire returns.
What is fire rotation?
The time needed to burn an area equal to the whole study area, computed as the length of the period divided by the fraction of the area burned (counting reburns each time).
Why is the mean fire interval shorter than the fire rotation?
Intervals exist only where fire returned within the record. Places that burned once or never contribute nothing, so the average over-represents frequently burned places.
How do I calculate fire return intervals in Python?
Rasterise the perimeters for each year onto a grid, then for each cell take the differences between the years in which it burned.