
Wildfire Mapping Explained: Perimeters, Detections, Smoke and Damage
On this page
Problem statement
A wildfire produces several kinds of map data, each made by different people and instruments for a different purpose. Satellites flag hot pixels within minutes. Analysts outline smoke once a day. Incident teams map the perimeter as the fire grows, and a final one after it is out. Inspectors record damaged buildings afterwards. Each answers its own question at its own resolution and delay, and most mistakes in wildfire mapping come from asking one of them another's question: burned area from hot pixels, exposure from smoke, losses from a perimeter.
This page follows one fire, the 2024 Park Fire in Northern California, through all four kinds of data, measures what each says about it, and assembles them into one GeoPackage.
Quick answer
Load each source for the same fire and put the headline numbers side by side:
print(f"perimeter:  {PERIM_ROW.GIS_ACRES:,.0f} acres ({PERIM.area / 1e6:,.0f} km²), alarm {ALARM:%d %b %Y}, contained {CONTAINED:%d %b %Y}")
print(f"detections: {len(PARK_PTS):,} HMS fire points within 1 km over 24–27 July, from {PARK_PTS.source.nunique()} sources")
print(f"smoke:      {SMOKE_KM2:,.0f} km² under HMS smoke on 26 July, {SMOKE_KM2 / (PERIM.area / 1e6):,.0f} times the fire's final area")
print(f"damage:     {(DINS.DAMAGE.str.startswith('Destroyed')).sum():,} structures destroyed of {len(DINS):,} inspected")
perimeter: 429,603 acres (1,739 km²), alarm 24 Jul 2024, contained 07 Sep 2024
detections: 23,769 HMS fire points within 1 km over 24–27 July, from 7 sources
smoke: 24,331,013 km² under HMS smoke on 26 July, 13,995 times the fire's final area
damage: 713 structures destroyed of 2,102 inspected
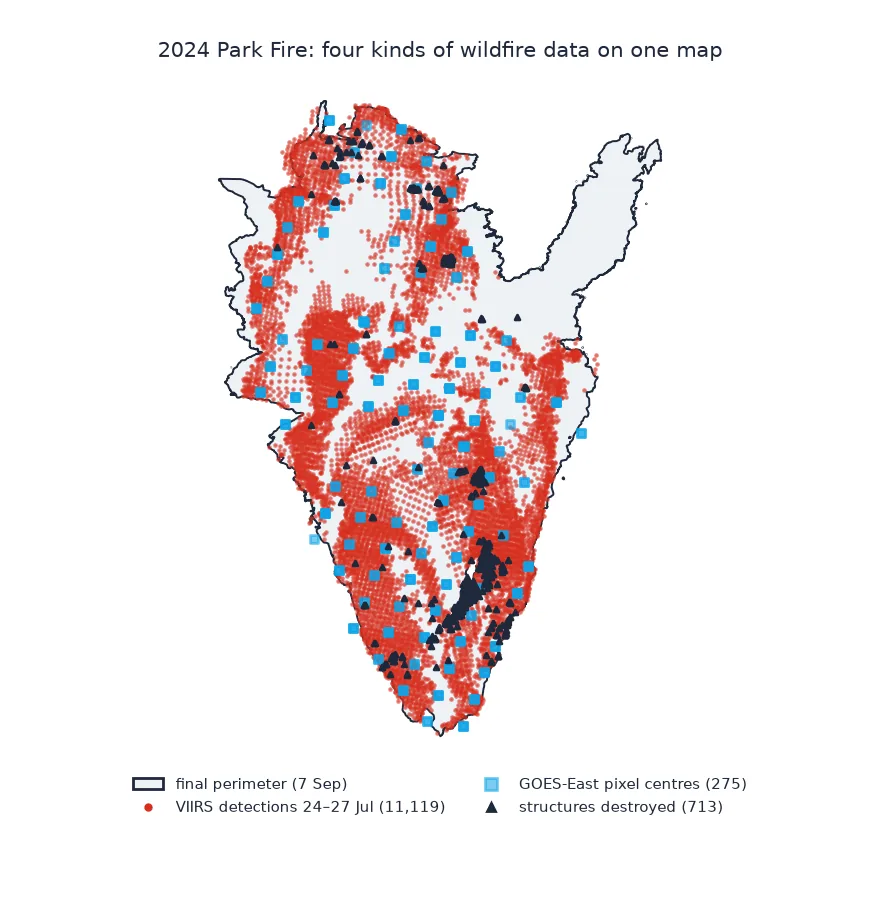
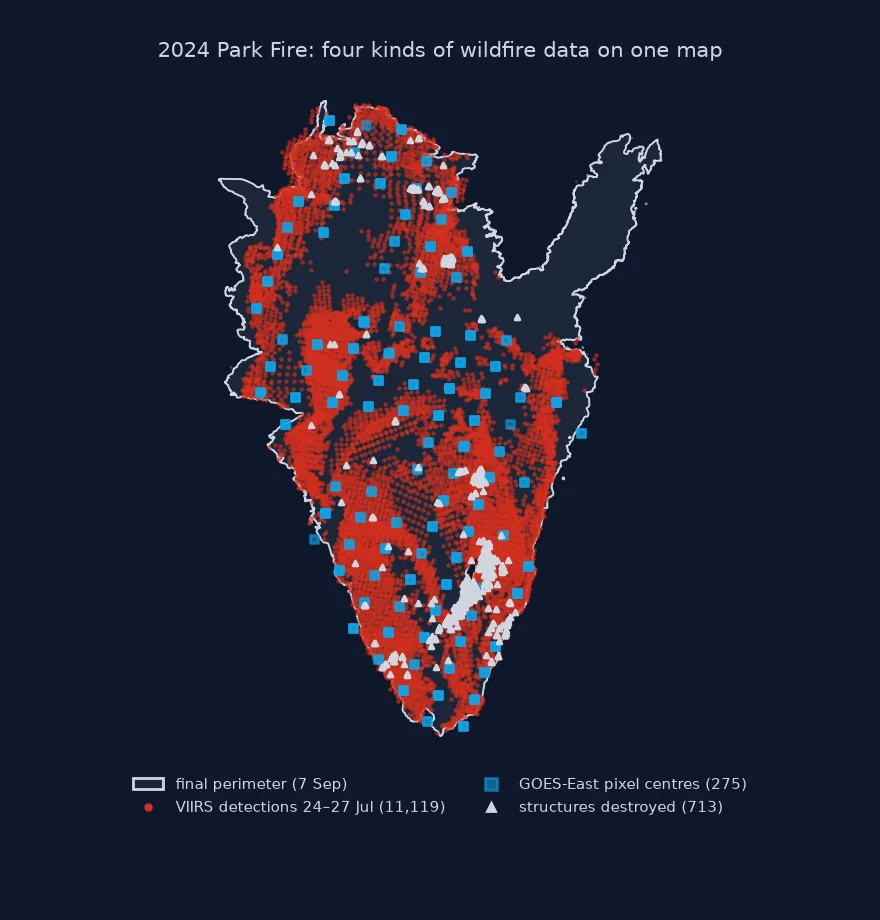
Perimeters, detections, smoke and damage
1. Perimeters: where it burned
A perimeter is the outline of the burned area, mapped during the fire from infrared flights and ground crews and finalised afterwards. It is the only source here that measures area, and it arrives last:
days = (CONTAINED - ALARM).days
print(f"alarm to containment: {days} days; the final perimeter describes the fire as it was at the end")
print(f"the perimeter has {len(PERIM.geoms) if PERIM.geom_type == 'MultiPolygon' else 1} part(s) and "
      f"{sum(len(p.interiors) for p in getattr(PERIM, 'geoms', [PERIM]))} unburned island(s)")
alarm to containment: 45 days; the final perimeter describes the fire as it was at the end
the perimeter has 63 part(s) and 7 unburned island(s)
The final outline is not one polygon: it has 63 separate parts, the main burn and spot fires beyond it, and 7 unburned islands.
2. Active fire detections: when and where it was burning
Satellite detections are pixels flagged as containing fire at the moment of a scan. They are fast and frequent, and coarse:
first = PARK_PTS.groupby("source").time.min().sort_values()
print((first.dt.tz_convert("America/Los_Angeles") - ALARM_LOCAL).dt.total_seconds().div(3600).round(1)
      .rename("hours after the alarm date's midnight").to_string())
print("distinct locations per source:", PARK_PTS.groupby("source")[["Lon", "Lat"]].apply(lambda d: len(d.drop_duplicates())).to_dict())
source
NOAA 20 VIIRS 15.0
GOES-EAST FDC 15.5
GOES-EAST ANALYSIS 19.2
NOAA 21 VIIRS 26.5
GOES-WEST ANALYSIS 32.7
NOAA 20 ANALYSIS 37.0
NOAA 21 ANALYSIS 37.8
distinct locations per source: {'GOES-EAST ANALYSIS': 248, 'GOES-EAST FDC': 275, 'GOES-WEST ANALYSIS': 263, 'NOAA 20 ANALYSIS': 214, 'NOAA 20 VIIRS': 4861, 'NOAA 21 ANALYSIS': 163, 'NOAA 21 VIIRS': 6258}
VIIRS on NOAA-20 and GOES-East first saw the fire within half an hour of each other, around 3 pm local time. VIIRS reported far more distinct locations (4,861 and 6,258 for the two VIIRS satellites, 275 for GOES-East), because each of its pixels covers a much smaller piece of ground.
3. Smoke: where its effects reached
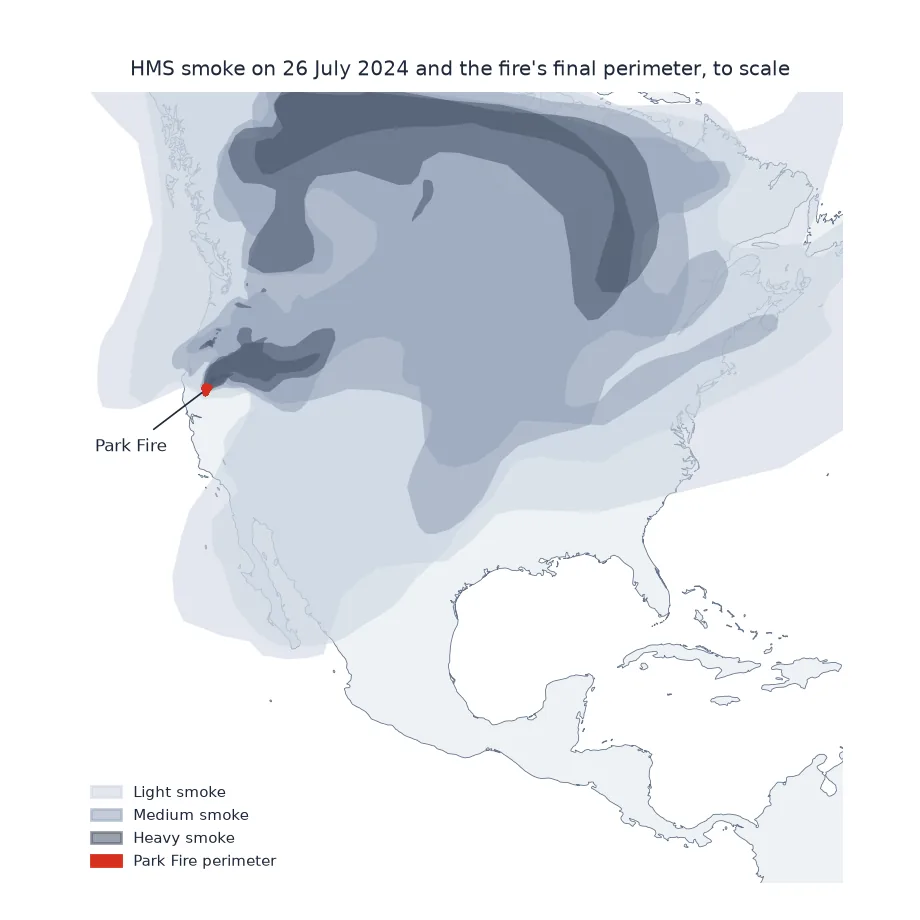
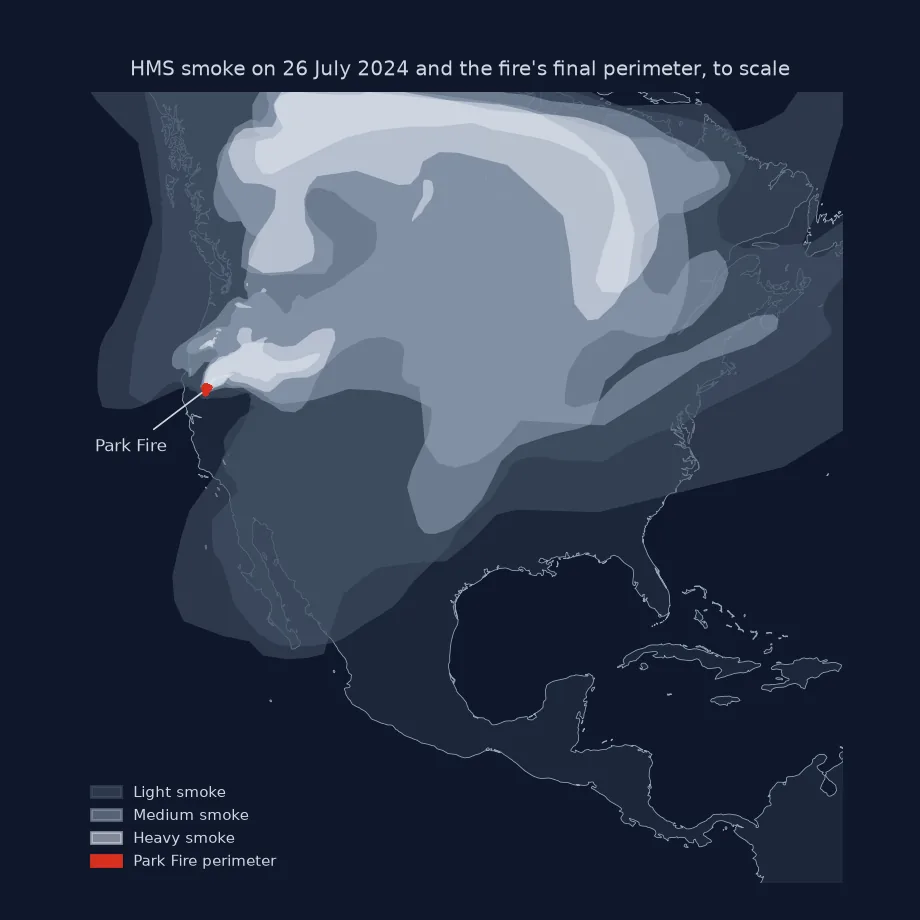
HMS smoke polygons outline smoke seen from space, from every fire burning at the time, not only this one. They describe the air column, not air quality at the ground:
heavy = smoke[smoke.Density == "Heavy"].geometry.make_valid().union_all().area / 1e6
print(f"HMS smoke on 26 July: {len(smoke)} polygons, {SMOKE_KM2:,.0f} km² under any smoke, {heavy:,.0f} km² under heavy smoke")
print(f"heavy smoke alone covered {heavy / (PERIM.area / 1e6):,.0f} times the Park Fire's final burned area")
HMS smoke on 26 July: 25 polygons, 24,331,013 km² under any smoke, 3,208,848 km² under heavy smoke
heavy smoke alone covered 1,846 times the Park Fire's final burned area
4. Damage: what it destroyed
Damage inspection points are structures visited after the fire, each with a damage class. They are the only source that measures losses:
inside = DINS.within(PERIM)
print(pd.crosstab(DINS.DAMAGE, inside.map({True: "inside perimeter", False: "outside"}).rename("where")).to_string())
where inside perimeter outside
DAMAGE
Affected (1-9%) 30 5
Destroyed (>50%) 713 0
Inaccessible 9 1
Major (26-50%) 10 0
Minor (10-25%) 11 1
No Damage 731 591
Every destroyed structure lies inside the perimeter, but so do 731 undamaged ones. A perimeter shows what the fire reached; the inspections show what it destroyed.
One GeoPackage for the whole Park Fire
The data used on this page
For the 2024 Park Fire: the perimeter from CAL FIRE's historic fire perimeter layer; NOAA Hazard Mapping System fire points (files dated 24–27 July) and smoke polygons (26 July); and CAL FIRE's Damage Inspection (DINS) public view. Areas are in California Albers (EPSG:3310) and CONUS Albers (EPSG:5070).
from pathlib import Path

import geopandas as gpd
import numpy as np
import pandas as pd
import requests

Path("data").mkdir(exist_ok=True)
SERVICES = "https://services1.arcgis.com/jUJYIo9tSA7EHvfZ/arcgis/rest/services/"
per = gpd.read_file(requests.get(SERVICES + "California_Historic_Fire_Perimeters/FeatureServer/0/query",
                                 params={"where": "FIRE_NAME = 'PARK' AND YEAR_ = 2024", "outFields": "FIRE_NAME,GIS_ACRES,ALARM_DATE,CONT_DATE",
                                         "outSR": 4326, "f": "geojson"}, timeout=120).text)
PERIM_ROW = per.iloc[0]
PERIM = per.to_crs(3310).geometry.make_valid().union_all()
ALARM = pd.to_datetime(PERIM_ROW.ALARM_DATE, unit="ms")
CONTAINED = pd.to_datetime(PERIM_ROW.CONT_DATE, unit="ms")
ALARM_LOCAL = pd.Timestamp(ALARM.date(), tz="America/Los_Angeles")

HMS = "https://satepsanone.nesdis.noaa.gov/pub/FIRE/web/HMS/"
frames = []
for d in pd.date_range("2024-07-24", "2024-07-27"):
    f = Path(f"data/hms_fire{d:%Y%m%d}.txt")
    if not f.exists():
        f.write_bytes(requests.get(f"{HMS}Fire_Points/Text/{d:%Y/%m}/{f.name}", timeout=120).content)
    t = pd.read_csv(f, skipinitialspace=True)
    t.columns = t.columns.str.strip()
    frames.append(t)
hms = pd.concat(frames, ignore_index=True)
hms["source"] = hms.Satellite.str.strip() + " " + hms.Method.str.strip()
hms["time"] = pd.to_datetime(hms.YearDay.astype(str) + hms.Time.astype(str).str.zfill(4), format="%Y%j%H%M", utc=True)
pts = gpd.GeoDataFrame(hms, geometry=gpd.points_from_xy(hms.Lon, hms.Lat), crs=4326).to_crs(3310)
PARK_PTS = pts[pts.within(PERIM.buffer(1000))].drop_duplicates(["Lon", "Lat", "time", "source"])

sm = Path("data/hms_smoke20240726.zip")
if not sm.exists():
    sm.write_bytes(requests.get(f"{HMS}Smoke_Polygons/Shapefile/2024/07/{sm.name}", timeout=120).content)
smoke = gpd.read_file(sm).to_crs(5070)
SMOKE = smoke.geometry.make_valid().union_all()
SMOKE_KM2 = SMOKE.area / 1e6

rows, offset = [], 0
while True:
    page = requests.get(SERVICES + "DINS_2024_Park_Public_View/FeatureServer/0/query",
                        params={"where": "1=1", "outFields": "DAMAGE", "outSR": 4326, "resultOffset": offset, "resultRecordCount": 2000, "f": "json"},
                        timeout=120).json()
    rows += [dict(f["attributes"], x=f["geometry"]["x"], y=f["geometry"]["y"]) for f in page["features"]]
    offset += len(page["features"])
    if not page.get("exceededTransferLimit"):
        break
dins = pd.DataFrame(rows)
DINS = gpd.GeoDataFrame(dins, geometry=gpd.points_from_xy(dins.x, dins.y), crs=4326).to_crs(3310)

print(f"perimeter, {len(hms):,} HMS fire points, {len(smoke)} smoke polygons, {len(DINS):,} inspections loaded")
perimeter, 147,627 HMS fire points, 25 smoke polygons, 2,102 inspections loaded
Example 1: one GeoPackage for the whole fire
out = "data/park_fire_2024.gpkg"
gpd.GeoDataFrame({"name": ["Park"], "acres": [PERIM_ROW.GIS_ACRES]}, geometry=[PERIM], crs=3310).to_file(out, layer="perimeter")
PARK_PTS.assign(time=PARK_PTS.time.dt.strftime("%Y-%m-%dT%H:%MZ"))[["source", "time", "FRP", "geometry"]].to_file(out, layer="detections")
DINS[["DAMAGE", "geometry"]].to_file(out, layer="damage")
gpd.GeoDataFrame(geometry=[SMOKE], crs=5070).to_crs(3310).to_file(out, layer="smoke_20240726")
import pyogrio
print(pyogrio.list_layers(out)[:, 0].tolist())
['perimeter', 'detections', 'damage', 'smoke_20240726']
Four answers to four questions
The Park Fire's own numbers show why the four sources cannot stand in for one another. The perimeter says 1,739 km², and it is a picture of the fire after 45 days, with 63 parts and 7 unburned islands; nothing in it says when any of that ground burned. The detections say when, 23,769 times — but most of those are the same pixels counted scan after scan, and the seven satellite sources disagree about how many distinct places were burning by a factor of more than thirty. The smoke layer covered 13,995 times the fire's area on a single day, because it outlines every fire's smoke over the continent and says nothing about air at the ground. And the inspections say what was lost: 713 structures destroyed, all inside the perimeter, next to 731 inside it that were undamaged.
So the useful habit is to state, for every number on a fire map, which layer it came from — and never to read area from hot pixels, exposure from smoke, or losses from a perimeter. The guides in this cluster take each source in turn.
Identifiers, simultaneous fires and time zones
- Identifiers: IRWIN IDs link CAL FIRE perimeters and national incident records; detections and smoke carry no fire identity at all.
- Several fires at once: detections and smoke from neighbouring fires mix in; select by distance to the perimeter and say so.
- Time zones: detections are in UTC, and HMS files do not follow UTC days; perimeter dates are milliseconds since 1970.
- Projections: measure area in an equal-area CRS (EPSG:3310 in California), never with
Shape__Area. - Other fire data: burn severity from Sentinel-2 or Landsat (dNBR) and fire weather complete the picture; see the links below.
Internal links
- How to download CAL FIRE wildfire perimeters — perimeters in detail
- Active fire detection from satellites explained — how detections are made
- How to map burn severity with dNBR — severity inside the perimeter
FAQ
What data is used to map wildfires?
Fire perimeters, satellite active fire detections (GOES, VIIRS, MODIS), smoke outlines (HMS), burn severity from imagery, and damage inspections, each answering a different question.
Which wildfire data is available fastest?
Geostationary satellite detections, within minutes of a scan. Perimeters and damage records take hours to weeks.
Can satellite fire detections replace perimeters?
No. Detections are pixel-sized and repeated; they show where and when a fire burned, not its area.
How do I combine wildfire data sources in Python?
Load each in GeoPandas, project to one CRS, select by distance to the fire, and write them as layers of one GeoPackage.