
How to Analyse Airport Taxi Trips: JFK Flat Fares and LaGuardia
On this page
Problem statement
Airport trips are a small share of New York's yellow-taxi rides but a large share of the money, and they follow different rules: a flat fare between JFK and Manhattan, a metered fare from LaGuardia, an airport fee on pickups, and a rate code that records which applied. Analysed like any other trip, JFK fares show up as a wall of identical $70 values and LaGuardia as an ordinary metered zone. This guide separates the airports in the 2025 records, checks the flat fare, measures what LaGuardia trips cost, and shows when and where airport passengers travel.
Quick answer
Select trips by zone — JFK is 132, LaGuardia 138, Newark 1 — and use RatecodeID = 2 to find JFK flat fares. Leave out payment-type-0 rows, which have no rate code.
AIR = {132: "JFK", 138: "LaGuardia", 1: "Newark"}
a = con.sql("""select PULocationID as z, count(*) as pickups, median(fare_amount) as fare, median(trip_distance) as miles,
               avg((RatecodeID = 2)::int) as jfk_flat from trips
               where PULocationID in (132, 138, 1) and payment_type <> 0 group by 1 order by pickups desc""").df()
a["airport"] = a.z.map(AIR)
tot = con.sql("select count(*) from trips where payment_type <> 0").fetchone()[0]
a["share_of_all"] = a.pickups / tot
print(a[["airport", "pickups", "share_of_all", "fare", "miles", "jfk_flat"]].round(3).to_string(index=False))
airport pickups share_of_all fare miles jfk_flat
JFK 2056119 0.055 70.0 16.98 0.468
LaGuardia 1283352 0.035 42.2 9.33 0.007
Newark 6038 0.000 100.0 0.00 0.005
JFK supplied 2,056,119 pickups in 2025, 5.5% of all trips with a payment type, and LaGuardia 1,283,352 (3.5%). The median JFK pickup paid $70.00 for 16.98 miles, because 46.8% of them used the flat fare; LaGuardia's median was $42.20 for 9.33 miles. Newark pickups are rare (6,038) and odd — a median metered distance of 0.00 miles — because New York yellow cabs rarely pick up in New Jersey.
Separating the airport trips
1. Identify airport trips
t = con.sql("""select count(*) filter (where PULocationID = 132 or DOLocationID = 132) as jfk,
                      count(*) filter (where PULocationID = 138 or DOLocationID = 138) as lga,
                      count(*) filter (where Airport_fee > 0) as airport_fee,
                      count(*) filter (where Airport_fee > 0 and PULocationID not in (132, 138)) as fee_elsewhere
               from trips where payment_type <> 0""").df().iloc[0]
print(t.to_dict())
{'jfk': 2361182, 'lga': 1674139, 'airport_fee': 3195245, 'fee_elsewhere': 113550}
Counting trips to or from each airport gives 2,361,182 for JFK and 1,674,139 for LaGuardia. The airport fee appears on 3,195,245 trips, and on 113,550 that did not start at JFK or LaGuardia — the fee field alone is not an airport flag.
2. The JFK flat fare
f = con.sql("""select fare_amount, count(*) as n from trips
               where RatecodeID = 2 and payment_type <> 0 group by 1 order by 2 desc limit 4""").df()
print(f.to_string(index=False))
jm = con.sql("""select RatecodeID = 2 as flat, count(*) as n, median(fare_amount) as fare
                from trips where PULocationID = 132 and DOLocationID in (select LocationID from lookup_df where Borough = 'Manhattan')
                and payment_type <> 0 group by 1 order by 1""").df()
print("JFK to Manhattan:", jm.round(2).to_dict("records"))
fare_amount n
70.00 1245068
-70.00 51434
0.00 1122
73.25 66
JFK to Manhattan: [{'flat': False, 'n': 53503, 'fare': 85.0}, {'flat': True, 'n': 943456, 'fare': 70.0}]
The flat-fare rows are almost all exactly $70.00 (1,245,068 trips); 51,434 are −$70.00, reversals. Of the trips from JFK to Manhattan, 943,456 used the flat fare; the 53,503 that did not, recorded under other rate codes, had a median fare of $85.00.
3. LaGuardia is metered
lg = con.sql("""select trip_distance, fare_amount, epoch(tpep_dropoff_datetime - tpep_pickup_datetime) / 60 as minutes
                from trips where PULocationID = 138 and DOLocationID in (select LocationID from lookup_df where Borough = 'Manhattan')
                and payment_type = 1 and fare_amount > 0 and trip_distance > 0""").df()
print(f"LaGuardia to Manhattan, card trips: {len(lg):,}; fare median ${lg.fare_amount.median():.2f}, "
      f"10th-90th percentile ${lg.fare_amount.quantile(0.1):.2f}-${lg.fare_amount.quantile(0.9):.2f}")
print(f"rank correlation of fare with minutes {lg.fare_amount.corr(lg.minutes, method='spearman'):.2f}, with miles {lg.fare_amount.corr(lg.trip_distance, method='spearman'):.2f}")
LaGuardia to Manhattan, card trips: 814,155; fare median $42.90, 10th-90th percentile $34.50-$59.00
rank correlation of fare with minutes 0.75, with miles 0.63
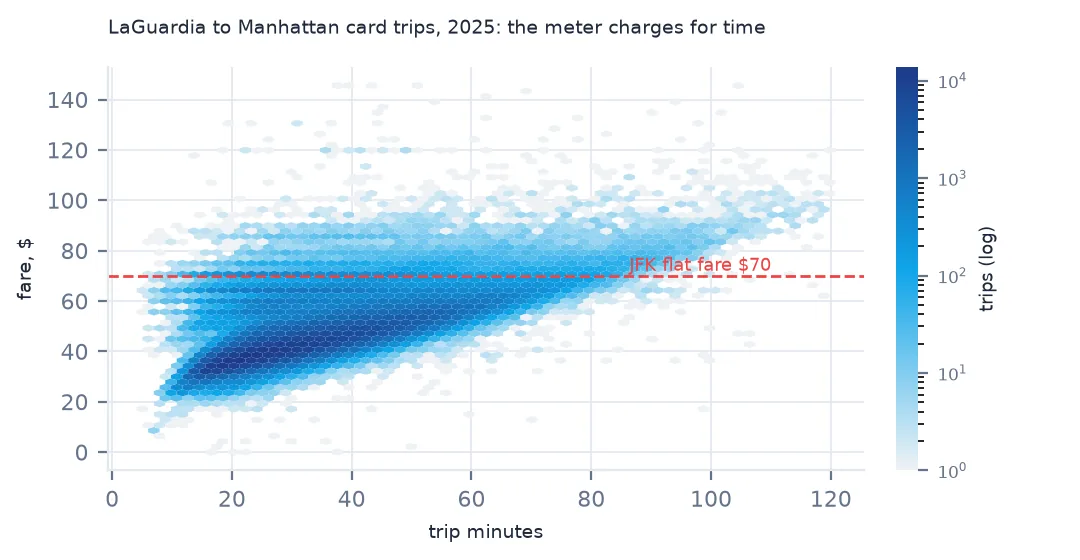
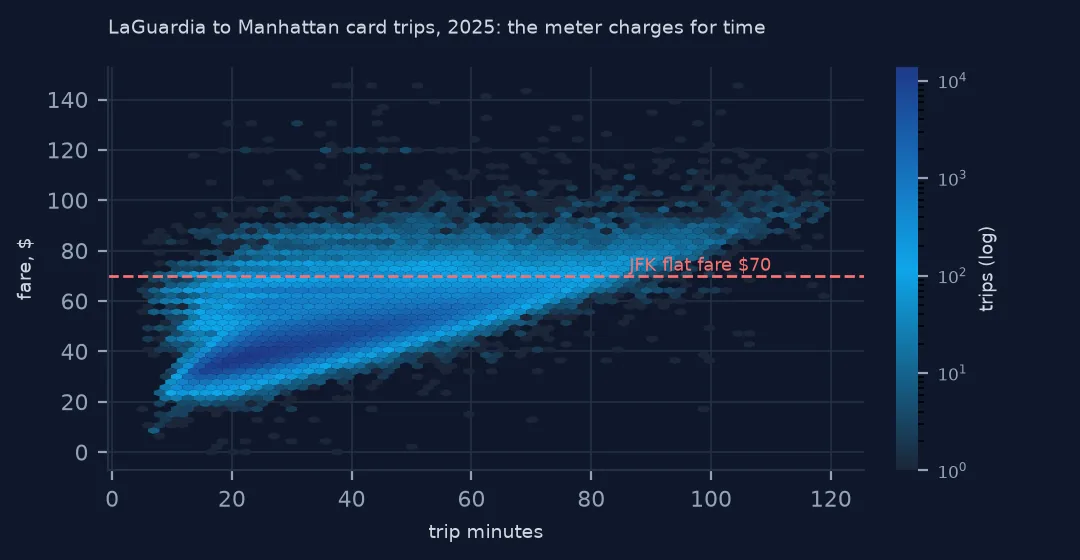
LaGuardia has no flat fare. Its 814,155 card trips to Manhattan had a median fare of $42.90, with the 10th to 90th percentile between $34.50 and $59.00. The fare follows time more closely than distance (rank correlation 0.75 against 0.63), because the meter charges for slow traffic as well as miles, and the bridges and the FDR Drive are where the time goes.
4. When airport pickups happen
h = con.sql("""select PULocationID as z, hour(tpep_pickup_datetime) as h, count(*) as n from trips
               where PULocationID in (132, 138) and payment_type <> 0 group by 1, 2""").df().pivot(index="h", columns="z", values="n")
share = h / h.sum()
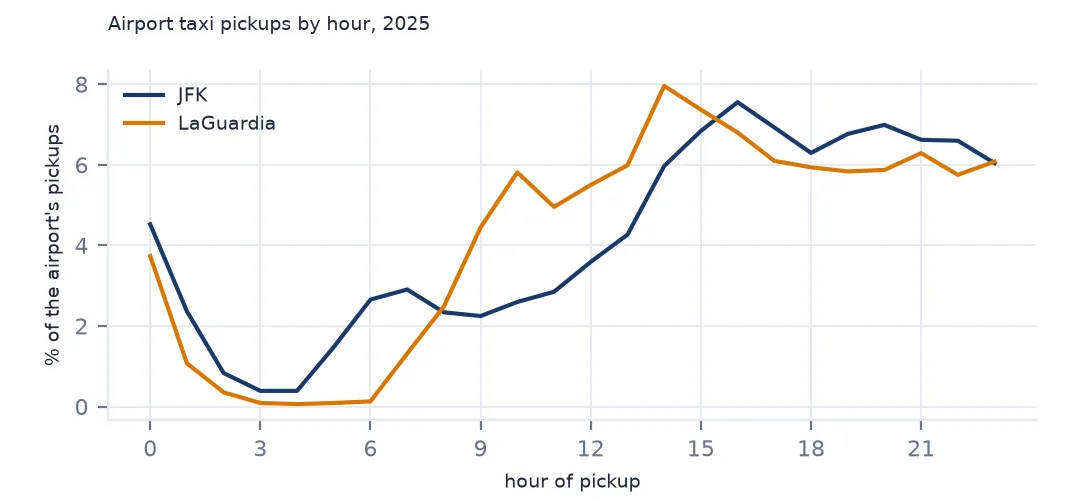
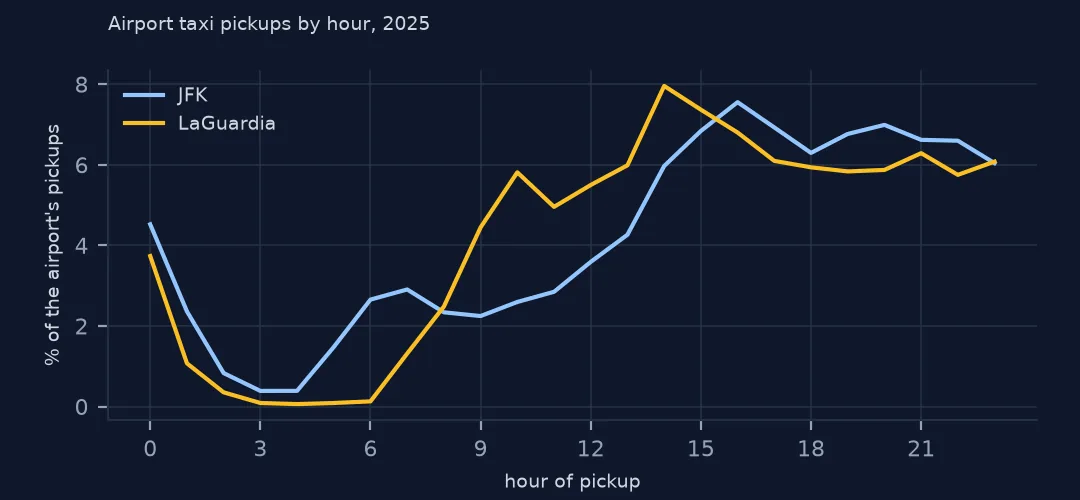
print(f"JFK peak hour {share[132].idxmax()}:00 ({share[132].max():.1%} of its pickups); LaGuardia peak {share[138].idxmax()}:00 ({share[138].max():.1%})")
print(f"pickups between 01:00 and 05:00: JFK {share[132].loc[1:4].sum():.1%}, LaGuardia {share[138].loc[1:4].sum():.1%}")
JFK peak hour 16:00 (7.6% of its pickups); LaGuardia peak 14:00 (8.0%)
pickups between 01:00 and 05:00: JFK 4.0%, LaGuardia 1.6%
Pickups follow flight arrivals: JFK peaks at 16:00 (7.6% of its daily pickups) and LaGuardia at 14:00 (8.0%). JFK, with overnight international arrivals, has 4.0% of its pickups between 01:00 and 05:00; LaGuardia, with few overnight flights, has 1.6%.
Where airport passengers go, and what they tip
The data used on this page
The NYC Taxi & Limousine Commission's yellow-taxi trip records for 2025 and its taxi zones. JFK is zone 132, LaGuardia 138 and Newark 1; the TLC fare rules set a flat fare between JFK and Manhattan and an airport fee on pickups at LaGuardia and JFK.
from pathlib import Path

import duckdb
import geopandas as gpd
import numpy as np
import pandas as pd
import requests

Path("data").mkdir(exist_ok=True)
TLC = "https://d37ci6vzurychx.cloudfront.net/trip-data/"
FILES = [f"yellow_tripdata_2025-{m:02d}.parquet" for m in range(1, 13)]
for name in FILES:
    if not Path(f"data/{name}").exists():
        with requests.get(TLC + name, stream=True, timeout=600) as r:      # 50-80 MB a month
            r.raise_for_status()
            with open(f"data/{name}", "wb") as f:
                for chunk in r.iter_content(1 << 20):
                    f.write(chunk)
# zones and lookup as the TLC served them on 15 October 2026 (it reissues them; the live copies are
# https://d37ci6vzurychx.cloudfront.net/misc/taxi_zones.zip and .../misc/taxi_zone_lookup.csv)
for name in ["nyc-taxi-zones-2026-10-15.zip", "nyc-taxi-zone-lookup-2026-10-15.csv"]:
    if not Path(f"data/{name}").exists():
        Path(f"data/{name}").write_bytes(requests.get(f"https://data.spatialworkflow.io/{name}", timeout=300).content)
zones = gpd.read_file("zip://data/nyc-taxi-zones-2026-10-15.zip!taxi_zones/taxi_zones.shp")    # EPSG:2263, feet
lookup = pd.read_csv("data/nyc-taxi-zone-lookup-2026-10-15.csv")

con = duckdb.connect()
con.sql("create view trips as select * from read_parquet('data/yellow_tripdata_2025-*.parquet', union_by_name = true)")
con.register("lookup_df", lookup)
print(f"{con.sql('select count(*) from trips').fetchone()[0]:,} rows in trips; {len(zones)} zone polygons, {len(lookup)} lookup rows")
48,722,602 rows in trips; 263 zone polygons, 265 lookup rows
Example 1: where airport passengers go
dest = con.sql("""select PULocationID as z, DOLocationID as d, count(*) as n from trips
                  where PULocationID in (132, 138) and payment_type <> 0 and DOLocationID < 264 group by 1, 2""").df()
dest = dest.merge(lookup.rename(columns={"LocationID": "d"}), on="d")
print(dest.groupby(["z", "Borough"]).n.sum().unstack().div(dest.groupby("z").n.sum(), axis=0).round(3).to_string())
Borough Bronx Brooklyn EWR Manhattan Queens Staten Island
z
132 0.019 0.183 0.001 0.509 0.286 0.002
138 0.018 0.124 0.001 0.718 0.138 0.000
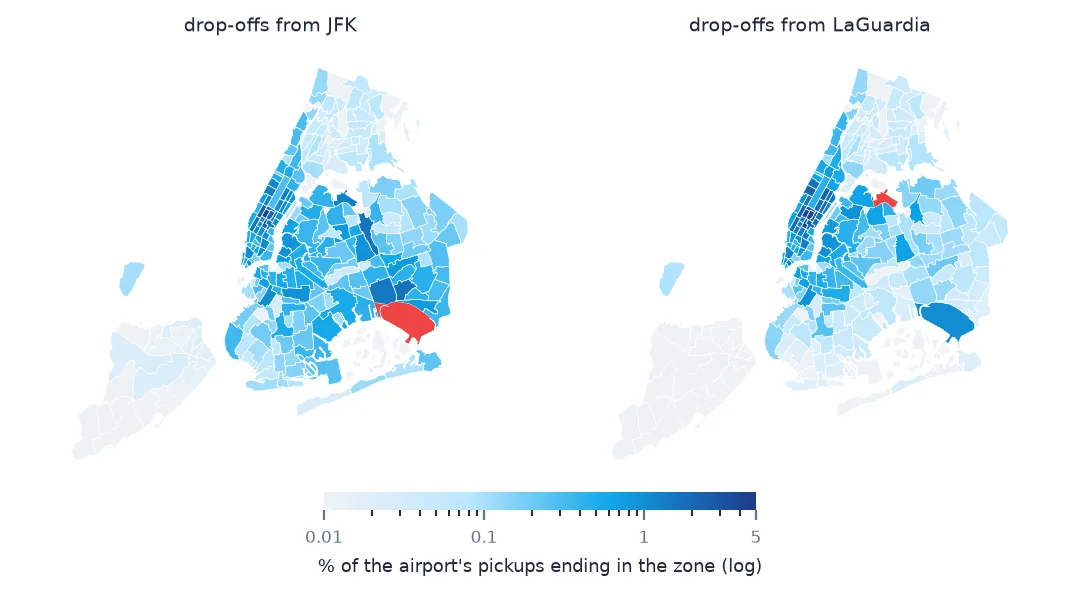
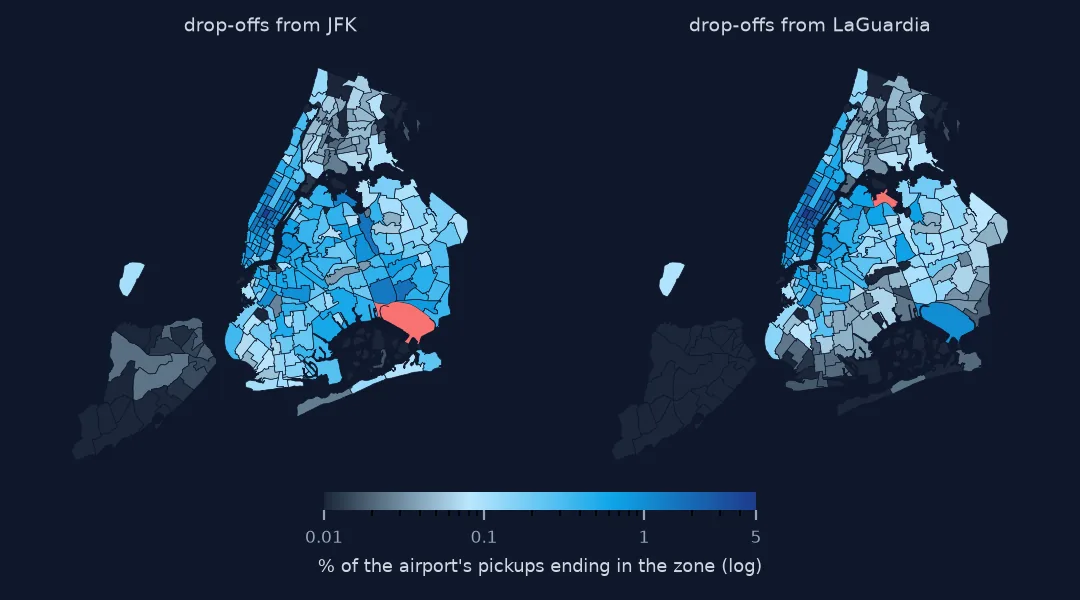
71.8% of LaGuardia pickups go to Manhattan, against 50.9% of JFK pickups; JFK sends more to Queens (28.6%) and Brooklyn (18.3%), which lie between it and Manhattan.
Example 2: tips on airport trips
tp = con.sql("""select PULocationID in (132, 138) as airport, avg(tip_amount / nullif(fare_amount, 0)) as tip_rate
                from trips where payment_type = 1 and fare_amount > 0 and tip_amount >= 0 group by 1 order by 1""").df()
print("card tip as a share of fare:", tp.set_index("airport").tip_rate.round(3).to_dict())
card tip as a share of fare: {False: 0.268, True: 0.234}
Card tips on airport pickups average 23.4% of the fare, against 26.8% elsewhere: on a large fare, passengers tip a smaller share.
Why airports need their own treatment
Airports are where the taxi market's rules change. The JFK flat fare exists so that visitors know the price before they get in, and it makes the fare independent of distance and time — so any model of fare against distance must leave rate code 2 out or treat it separately. LaGuardia is metered, so its fares show the cost of traffic on the way into Manhattan. The airport fee, charged on pickups at both, tells you where a trip began more reliably than its absence tells you anything.
Airport pickups are also where yellow cabs still dominate: the taxi rank is next to the terminal, while ride-hail pickups are walked to separate areas. That makes the airports a distinct part of the yellow-cab business, and a distinct part of its data.
Pitfalls in airport trip data
- Flat-fare reversals. −$70.00 rows are reversals; count trips with
fare_amount > 0. - Zone 132 is the whole airport. Terminals are not distinguished, and the zone includes surrounding land.
- Payment type 0. Flex-fare trips have no rate code, so they never count as flat fares; leaving them out keeps the flat-fare share honest.
- The fare rules change. The JFK flat fare rose to $70 at the end of 2022; check the TLC's fare page for the period you analyse.
Internal links
- How to measure airport congestion from taxi-out times — the other kind of airport taxi
- Taxi trip records explained — rate codes and the airport fee
- How to find the busiest taxi routes between NYC zones — all zone pairs
FAQ
How much is a taxi from JFK to Manhattan?
In the 2025 records, the flat fare is $70.00 before surcharges, tolls and tip, used on 943,456 of the JFK-to-Manhattan trips.
How much is a taxi from LaGuardia to Manhattan?
It is metered: a median fare of $42.90 on card trips in 2025, with the 10th to 90th percentile from $34.50 to $59.00.