
How Old Are America's Dams? Completion Years by Decade and State
On this page
Problem statement
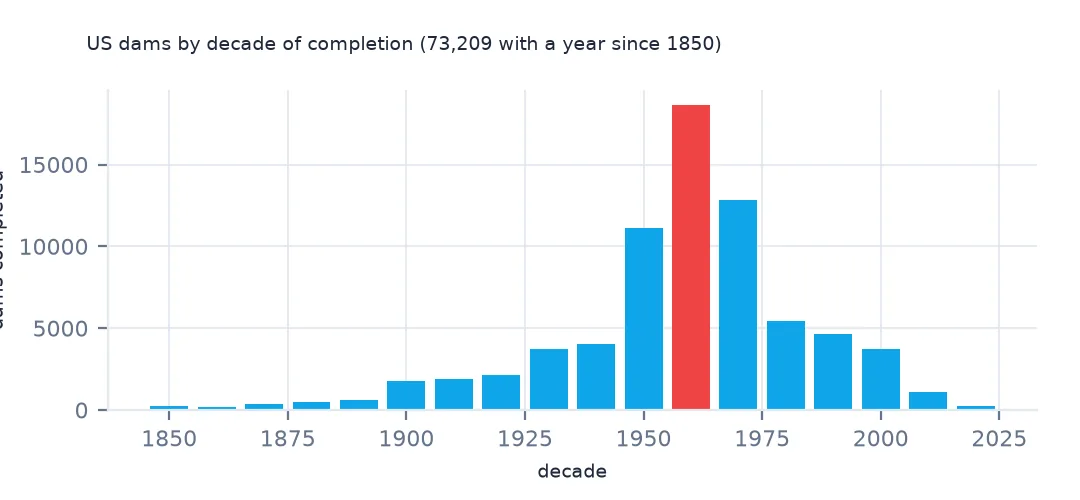
Most American dams were built in a burst after the Second World War: farm ponds and small flood-control dams by the tens of thousands, many of them funded by federal soil-conservation programmes, alongside the large federal dams of the West. The National Inventory of Dams records the year each dam was completed, so the age of the fleet can be counted by decade and by state. A fifth of the dams have no year, and the years that are recorded cluster on round numbers, so the counts need care at both ends. This page measures how old the dams are and when they were built.
Quick answer
Take yearCompleted above 0, count by decade, and compute ages from 2026:
y = nid.yearCompleted.where(nid.yearCompleted > 0)
decade = (y // 10 * 10).astype("Int64")
print(decade.value_counts().sort_index().loc[1900:].to_string())
print(f"with a year: {y.notna().sum():,} of {len(nid):,}; median age in 2026: {2026 - y.median():.0f} years; built before 1970: {(y < 1970).mean():.1%}")
yearCompleted
1900 1800
1910 1891
1920 2134
1930 3745
1940 4018
1950 11119
1960 18622
1970 12842
1980 5454
1990 4665
2000 3706
2010 1077
2020 243
with a year: 73,708 of 92,626; median age in 2026: 61 years; built before 1970: 49.4%
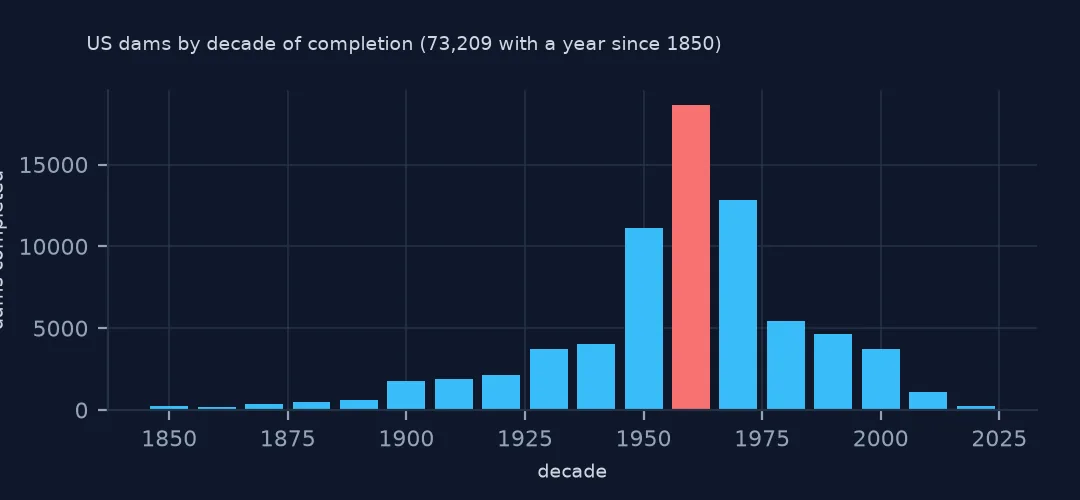
73,708 dams have a completion year, and the median one was finished in 1965, 61 years ago. The 1960s alone built 18,622 of them, and the 1950s and 1970s another 24,000 between them. Since 2010 only 1,320 dams with a year have been added. 49.4% of the dams with a year were built before 1970.
Counting by decade
1. Dams without a year
print(nid[y.isna()].publicHazardId.value_counts(normalize=True).round(3).to_string())
print(nid[y.notna()].publicHazardId.value_counts(normalize=True).round(3).to_string())
publicHazardId
Low 0.545
Undetermined 0.184
Significant 0.137
High 0.133
publicHazardId
Low 0.678
High 0.196
Significant 0.119
Undetermined 0.008
The dams without a year are not a random sample. 18.4% of them have an undetermined hazard class, against 0.8% of dams with a year, and only 13.3% are high hazard against 19.6%. They are mostly small, little-documented private dams, so the age figures describe the better-recorded part of the fleet.
2. The 1960s peak by purpose
t = pd.crosstab(decade, nid.primaryPurposeId).loc[1930:2020]
print(t[["Recreation", "Flood Risk Reduction", "Fire Protection, Stock, Or Small Fish Pond", "Irrigation", "Hydroelectric"]].to_string())
primaryPurposeId Recreation Flood Risk Reduction Fire Protection, Stock, Or Small Fish Pond Irrigation Hydroelectric
yearCompleted
1930 1546 140 534 395 162
1940 1386 238 833 491 119
1950 3651 1516 2213 1228 168
1960 5117 4838 2827 1199 166
1970 3292 2911 1900 1101 69
1980 1012 1571 562 443 105
1990 740 1262 659 214 40
2000 569 1098 400 229 4
2010 165 280 37 98 0
2020 20 48 1 13 1
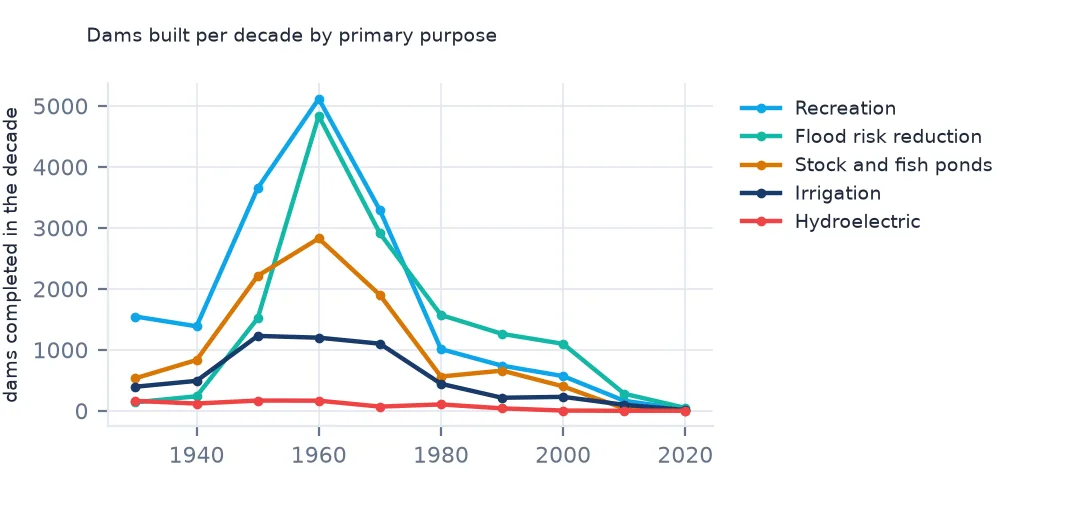
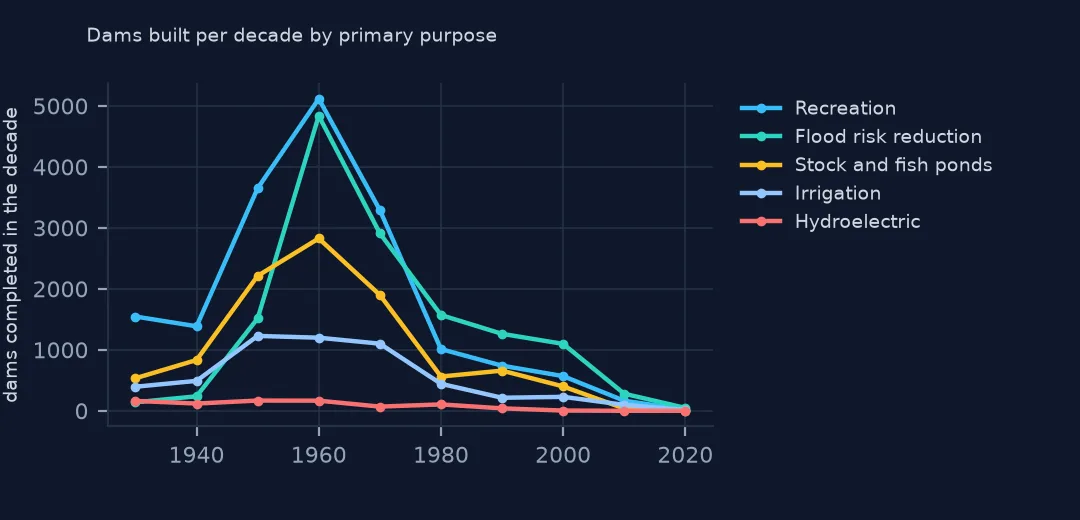
The 1960s peak is broad, but its leaders are recreation dams (5,117) and flood-control dams (4,838). Stock and fish ponds peaked at the same time, while hydroelectric dams were built at a steady 160 or so a decade from the 1930s to the 1960s and then almost stopped. Since 2000, flood risk reduction has been the main reason dams are built.
3. Round years
print(y.mod(10).value_counts().sort_index().astype(int).to_string())yearCompleted
0.0 13102
1.0 5729
2.0 6334
3.0 6118
4.0 6691
5.0 8771
6.0 6629
7.0 6713
8.0 7192
9.0 6429
Years ending in 0 are twice as common as any other digit, 13,102 against 5,700 to 7,200, and years ending in 5 hold 8,771. Many years are estimates rounded to five or ten. That is why this page counts by decade: a dam estimated at 1960 lands in the 1960s whether it was built in 1958 or 1962, so the decade bars are much less affected than single years.
Age by state and by size
The data used on this page
The US Army Corps of Engineers' National Inventory of Dams (NID), the whole inventory as a GeoPackage from its API, downloaded on 19 October 2026 and saved on this site, because the inventory is updated as states and agencies send revisions. Heights are in feet, storage in acre-feet and areas in acres, as the NID gives them.
from pathlib import Path
import zipfile

import geopandas as gpd
import numpy as np
import pandas as pd
import requests

Path("data").mkdir(exist_ok=True)
# US Army Corps of Engineers, National Inventory of Dams: the whole inventory as a GeoPackage, and the Census
# Bureau's 2024 cartographic boundary counties. Saved 19 October 2026, because the inventory is updated continuously.
# Live: https://nid.sec.usace.army.mil/api/nation/gpkg
ARCHIVE = "usace-nid-2026-10-19.zip"
if not Path(f"data/{ARCHIVE}").exists():
    Path(f"data/{ARCHIVE}").write_bytes(requests.get(f"https://data.spatialworkflow.io/{ARCHIVE}", timeout=900).content)
Z = zipfile.ZipFile(f"data/{ARCHIVE}")
if not Path("data/nid.gpkg").exists():
    Z.extract("nid.gpkg", "data")
NUMERIC = ["damHeight", "hydraulicHeight", "structuralHeight", "nidHeight", "damLength", "volume", "yearCompleted",
           "nidStorage", "maxStorage", "normalStorage", "surfaceArea", "drainageArea", "maxDischarge"]
nid = gpd.read_file("data/nid.gpkg")
nid[NUMERIC] = nid[NUMERIC].apply(pd.to_numeric, errors="coerce")       # the GeoPackage stores them as text
print(f"National Inventory of Dams: {len(nid):,} rows, {nid.nidId.nunique():,} NID ids")
National Inventory of Dams: 92,626 rows, 91,840 NID ids
Example 1: the oldest and youngest states
age = (2026 - y).groupby(nid.state).median()
n = y.groupby(nid.state).count()
age = age[n >= 200].sort_values()
print(age.head(4).to_string(), "\n...", age.tail(4).to_string(), sep="\n")
state
Nevada 36.0
Iowa 48.0
Missouri 52.0
Maryland 53.0
...
state
New Hampshire 96.0
Massachusetts 109.0
Maine 111.0
Connecticut 123.0
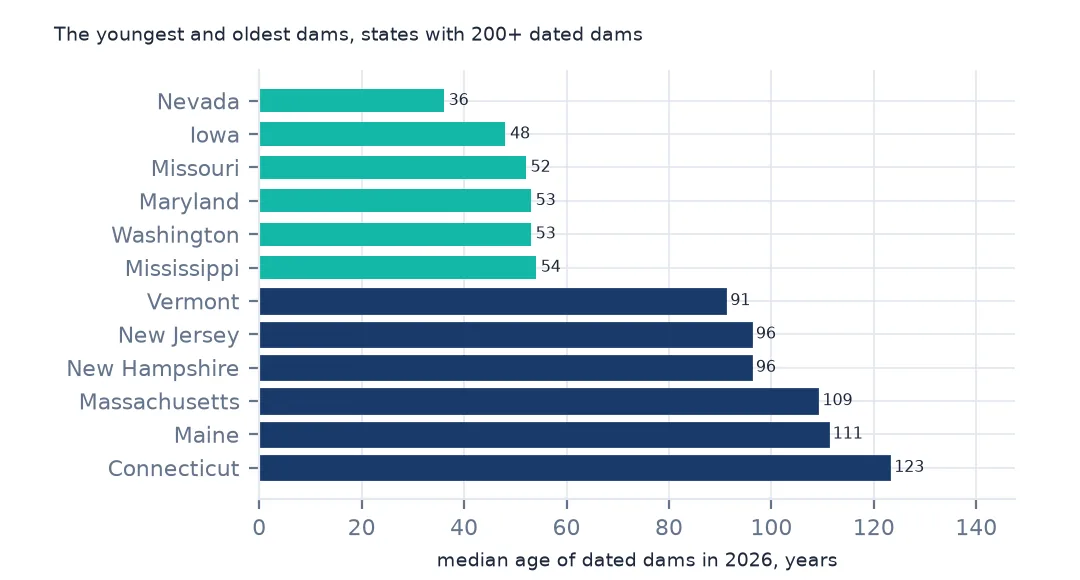
Among states with at least 200 dated dams, Nevada's are the youngest, with a median age of 36 years, then Iowa, Missouri and Maryland. New England's are the oldest by far: Connecticut's median dam is 123 years old, Maine's 111 and Massachusetts's 109, so half of Connecticut's dated dams were finished before 1904.
Example 2: big dams and small dams
print((2026 - y).groupby(nid.nidHeightId).median().to_string())nidHeightId
25-50 feet 59.0
51-100 feet 59.0
Greater than 100 feet 64.0
Less than 25 feet 66.0
Undetermined 32.0
Size makes little difference: the median dam under 25 feet is 66 years old, and those of 25-50 and 51-100 feet are 59. Dams over 100 feet have a median age of 64, from the era of the great federal projects.
Internal links
- Round completion years — the clusters on years ending in 0 and 5
- High-hazard dams in poor condition — age against condition
- Dams by purpose and owner — who built them, and why
- Reading the inventory — the columns