
Dam Completion Years Pile Up on Round Numbers
On this page
Problem statement
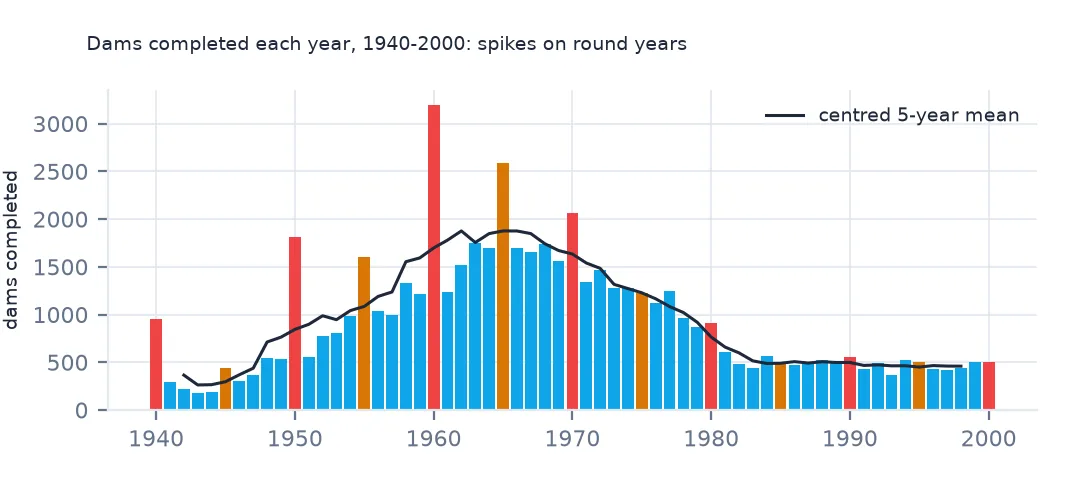
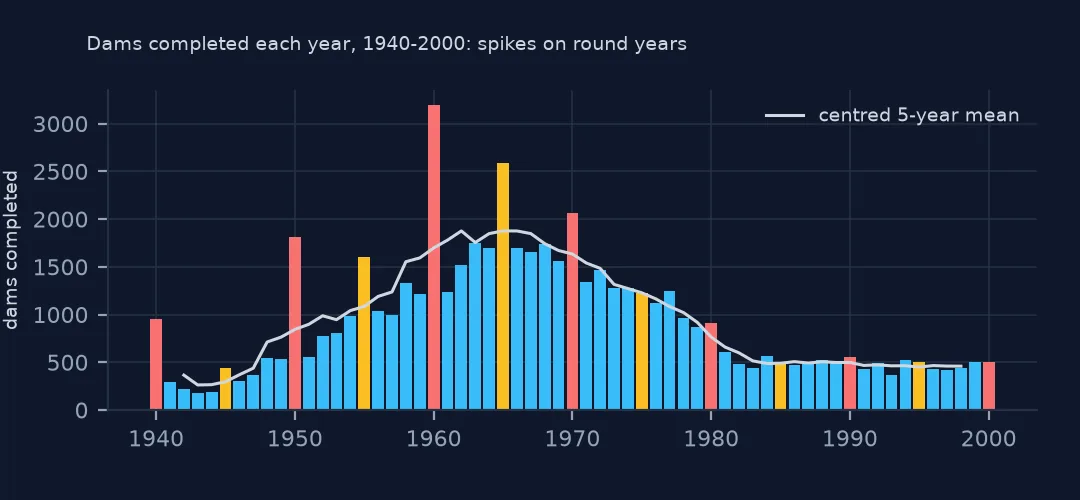
Count dams in the National Inventory of Dams by the year they were completed and the chart has spikes: 1960 holds twice as many dams as 1959 or 1961, and years ending in 5 stand out too. Dam-building did not happen on a decimal rhythm. Where nobody recorded when a small dam was finished, someone estimated it, and estimates round to the nearest five or ten years. Read year by year, the spikes look like booms and the years between like slumps. This page measures how strong the rounding is, where it comes from, and how to count around it.
Quick answer
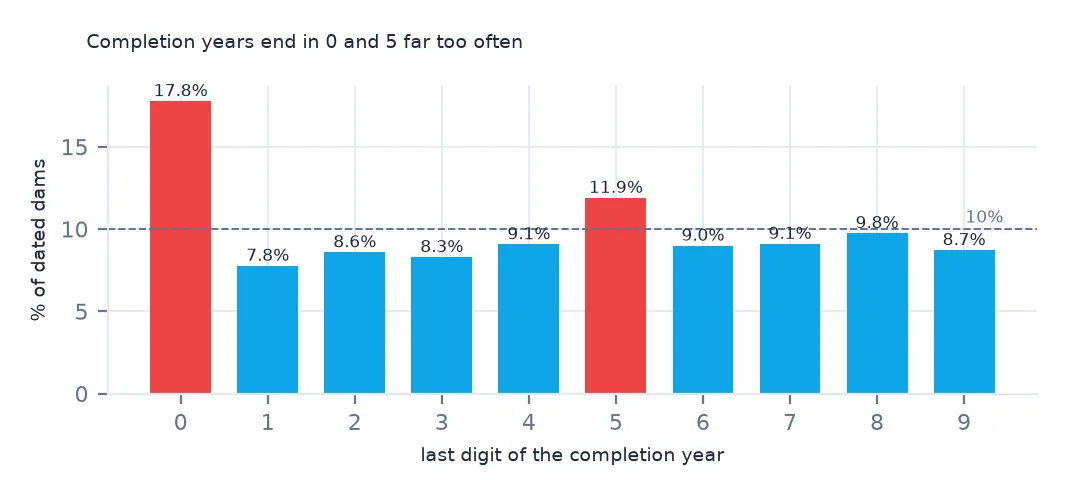
Compare how many years end in each digit; with no rounding each would hold about a tenth:
y = nid.yearCompleted.where(nid.yearCompleted > 0).dropna().astype(int)
d = y.mod(10).value_counts(normalize=True).sort_index()
print(d.round(3).to_string())
print(f"years ending in 0: {d[0]:.1%}; in 5: {d[5]:.1%}; expected about 10% each")
yearCompleted
0 0.178
1 0.078
2 0.086
3 0.083
4 0.091
5 0.119
6 0.090
7 0.091
8 0.098
9 0.087
years ending in 0: 17.8%; in 5: 11.9%; expected about 10% each
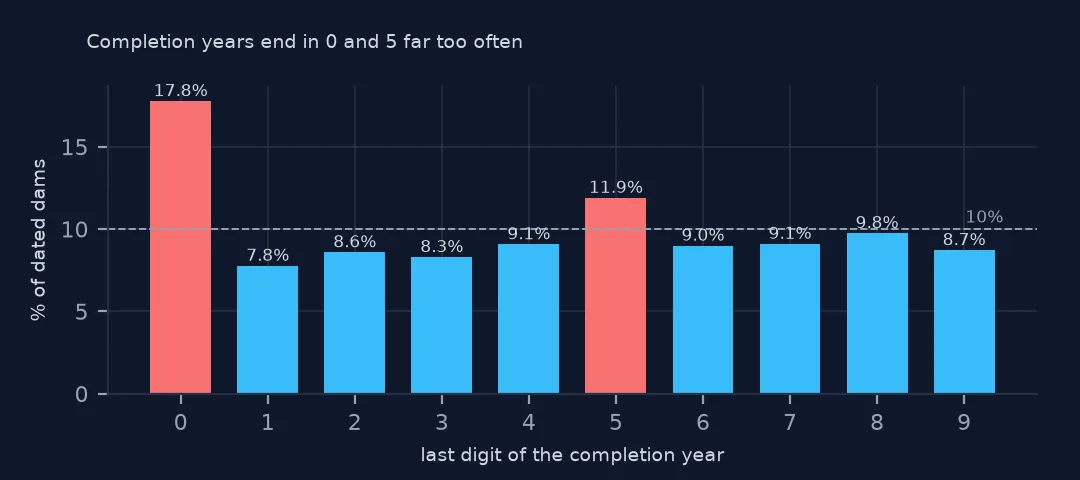
17.8% of completion years end in 0 and 11.9% in 5, while the other digits hold 7.8% to 9.8%. The distribution of real building years has no reason to favour any final digit, so the excess is rounding.
How much is estimated
1. The excess
others = d.drop([0, 5]).mean()
excess = int(round((d[0] - others) * len(y) + (d[5] - others) * len(y)))
print(f"average share of the other digits: {others:.3f}; dams in excess on 0 and 5: {excess:,} ({excess / len(y):.1%} of dams with a year)")
average share of the other digits: 0.088; dams in excess on 0 and 5: 8,914 (12.1% of dams with a year)
Against the 8.8% average of the other digits, about 8,914 dams sit on a year ending in 0 or 5 that would otherwise be spread over the years around it. That is an estimate of how many years were rounded, 12.1% of the dated dams, and a lower bound, since some rounded years land on 0 or 5 by chance.
2. Which dams
round_year = y.mod(5) == 0
sub = nid.loc[y.index]
print(sub.groupby(round_year).nidHeight.median().rename({True: "year ends in 0 or 5", False: "other years"}).to_string())
print(sub.groupby("primaryOwnerTypeId").apply(lambda g: (g.yearCompleted % 10 == 0).mean()).round(3).sort_values().to_string())
yearCompleted
other years 26.0
year ends in 0 or 5 23.0
primaryOwnerTypeId
Public Utility 0.113
Federal 0.134
Local Government 0.138
State 0.171
Private 0.198
Not Listed 0.237
Tribal Government 0.333
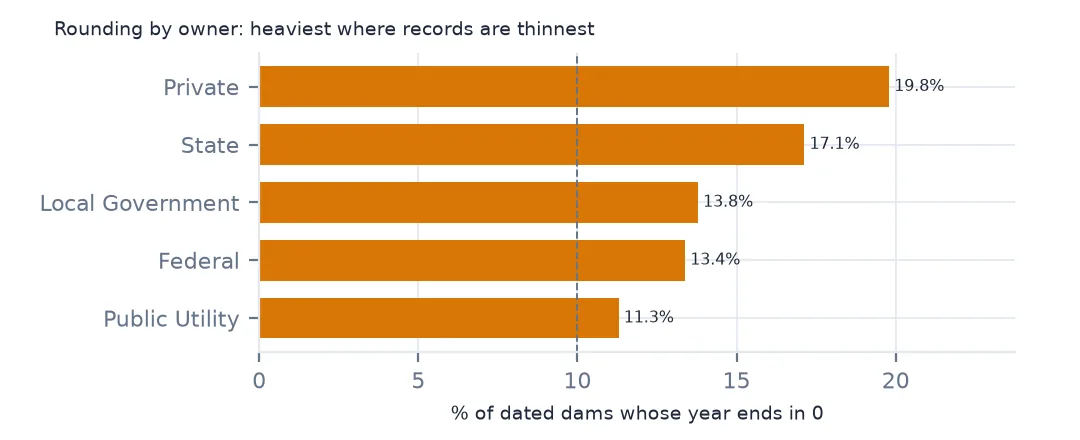
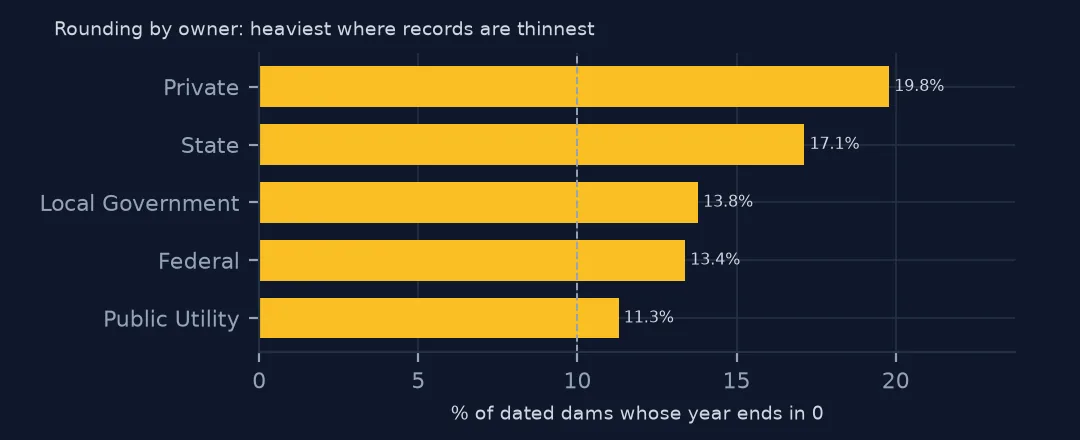
Dams with round years are a little smaller, a median of 23 feet against 26. Private dams have the most years ending in 0, 19.8%, and public utilities and federal agencies, whose dams come with construction records, the fewest, 11.3% and 13.4%. The Tribal figure rests on very few dams. Rounding is heaviest where records are thinnest.
3. By state
st = sub.groupby("state").yearCompleted.agg(n="size", share0=lambda s: (s % 10 == 0).mean())
print(st[st.n >= 1000].sort_values("share0", ascending=False).head(5).round(3).to_string())
n share0
state
Oklahoma 4767 0.288
Montana 2934 0.264
South Carolina 2070 0.262
Georgia 3605 0.248
Nebraska 2984 0.240
Among states with at least 1,000 dated dams, Oklahoma has the most years ending in 0, 28.8%, nearly three times the expected tenth, followed by Montana, South Carolina, Georgia and Nebraska. These states have many small private dams whose years were estimated when they were first inventoried.
Counting around it
The data used on this page
The US Army Corps of Engineers' National Inventory of Dams (NID), the whole inventory as a GeoPackage from its API, downloaded on 19 October 2026 and saved on this site, because the inventory is updated as states and agencies send revisions. Heights are in feet, storage in acre-feet and areas in acres, as the NID gives them.
from pathlib import Path
import zipfile

import geopandas as gpd
import numpy as np
import pandas as pd
import requests

Path("data").mkdir(exist_ok=True)
# US Army Corps of Engineers, National Inventory of Dams: the whole inventory as a GeoPackage, and the Census
# Bureau's 2024 cartographic boundary counties. Saved 19 October 2026, because the inventory is updated continuously.
# Live: https://nid.sec.usace.army.mil/api/nation/gpkg
ARCHIVE = "usace-nid-2026-10-19.zip"
if not Path(f"data/{ARCHIVE}").exists():
    Path(f"data/{ARCHIVE}").write_bytes(requests.get(f"https://data.spatialworkflow.io/{ARCHIVE}", timeout=900).content)
Z = zipfile.ZipFile(f"data/{ARCHIVE}")
if not Path("data/nid.gpkg").exists():
    Z.extract("nid.gpkg", "data")
NUMERIC = ["damHeight", "hydraulicHeight", "structuralHeight", "nidHeight", "damLength", "volume", "yearCompleted",
           "nidStorage", "maxStorage", "normalStorage", "surfaceArea", "drainageArea", "maxDischarge"]
nid = gpd.read_file("data/nid.gpkg")
nid[NUMERIC] = nid[NUMERIC].apply(pd.to_numeric, errors="coerce")       # the GeoPackage stores them as text
print(f"National Inventory of Dams: {len(nid):,} rows, {nid.nidId.nunique():,} NID ids")
National Inventory of Dams: 92,626 rows, 91,840 NID ids
Example 1: decades instead of years
print(y.groupby(y // 10 * 10).size().loc[1940:1990].to_string())yearCompleted
1940 4018
1950 11119
1960 18622
1970 12842
1980 5454
1990 4665
The 1960s remain the busiest decade, and the decades show a smooth rise and fall that single years can't.
Grouped into decades the rounding stays inside each bar: a dam estimated at 1960 belongs to the 1950s or 1960s either way. Decades starting on the round year (1955-1964) would split each spike instead, so use the plain calendar decade.
Example 2: smoothing a yearly series
s = y.value_counts().sort_index().loc[1940:2000]
print(pd.DataFrame({"raw": s, "five_year_mean": s.rolling(5, center=True).mean().round(0)}).loc[1958:1962].to_string())
raw five_year_mean
yearCompleted
1958 1333 1554.0
1959 1214 1593.0
1960 3193 1697.0
1961 1233 1780.0
1962 1514 1876.0
Year by year, 1960 has 3,193 dams against 1,214 in 1959 and 1,233 in 1961. A centred five-year mean spreads the spike across its neighbours. That is still an assumption about where the rounded dams belong, but it is closer to the truth than a single peak year.
Internal links
- Dam age — counts by decade
- Numbers stored as text — making the year a number first
- Reading the inventory — the columns
- Earthquake counts that rise over time — another record shaped by how it was kept