
Dam Hazard Potential Explained: Why a High-Hazard Dam Is Not an Unsafe Dam
On this page
Problem statement
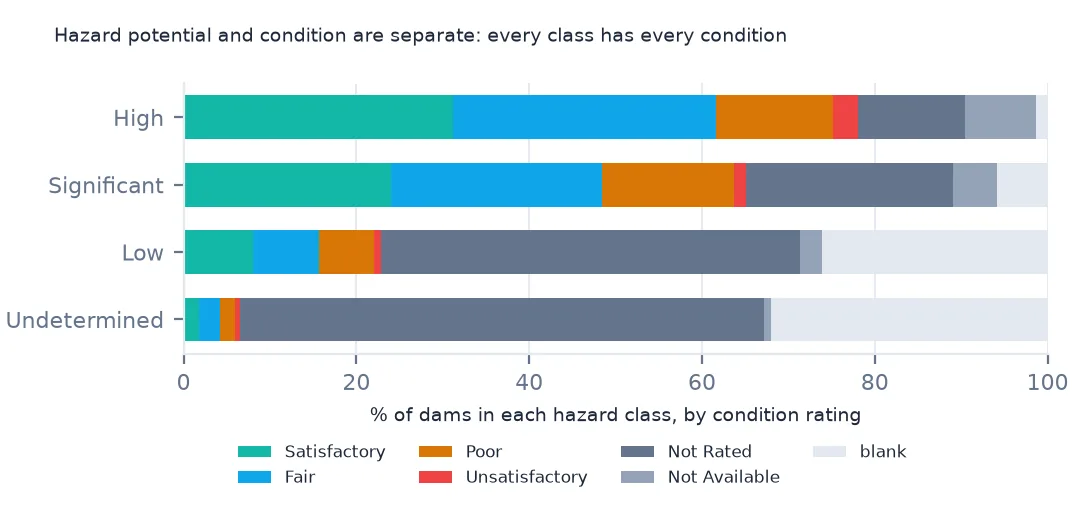
"Thousands of high-hazard dams" makes a frightening headline, and it is usually a misreading. In the National Inventory of Dams, hazard potential says what would happen downstream if a dam failed: high where people would probably die, significant where the losses would be economic or environmental, low where little beyond the owner's land would suffer. It says nothing about how likely the dam is to fail. That is the condition assessment, a separate field from an inspection, and it is missing or "not rated" for most dams. This page separates the two in the inventory and shows how they combine.
Quick answer
Cross-tabulate hazard potential against condition; the two answer different questions:
cond = nid.conditionAssessId.fillna("blank")
order = ["Satisfactory", "Fair", "Poor", "Unsatisfactory", "Not Rated", "Not Available", "blank"]
print(pd.crosstab(nid.publicHazardId, cond)[order].to_string())
conditionAssessId Satisfactory Fair Poor Unsatisfactory Not Rated Not Available blank
publicHazardId
High 5302 5158 2294 504 2084 1398 233
Low 4816 4662 3815 446 29284 1521 15715
Significant 2718 2780 1727 162 2711 586 661
Undetermined 74 95 72 22 2458 30 1298
Hazard and condition vary independently. Of the 16,973 high-hazard dams, 5,302 are rated satisfactory and 5,158 fair, while 2,294 are poor and 504 unsatisfactory. Among low-hazard dams, ratings are rare: 29,284 are "Not Rated" and 15,715 blank. A high-hazard dam in satisfactory condition is the normal case, not an alarming one.
Consequence, likelihood and the plan
1. Hazard potential is about who lives downstream
print(nid.publicHazardId.value_counts().to_string())
print(nid.groupby("publicHazardId").nidHeight.median().to_string())
publicHazardId
Low 60259
High 16973
Significant 11345
Undetermined 4049
publicHazardId
High 32.0
Low 23.0
Significant 21.0
Undetermined 20.0
60,259 dams are low hazard, 16,973 high, 11,345 significant and 4,049 undetermined. High-hazard dams are taller on average, a median of 32 feet against 23 for low hazard, but height is not what decides the class. A 20-foot dam above a town is high hazard, and a 100-foot dam in an empty canyon can be low. The class follows from mapping where the water would go, and it changes when people build downstream.
2. Condition is about the dam
rated = nid.conditionAssessId.isin(["Satisfactory", "Fair", "Poor", "Unsatisfactory"])
print(f"dams with a condition rating: {rated.sum():,} ({rated.mean():.1%}); high-hazard dams rated: {rated[nid.publicHazardId == 'High'].mean():.1%}")
dams with a condition rating: 34,647 (37.4%); high-hazard dams rated: 78.1%
Only 37.4% of dams have a condition rating, and 78.1% of high-hazard dams. States assess the dams that matter most first, and many low-hazard dams are never formally rated.
3. The emergency action plan
print(pd.crosstab(nid.publicHazardId, nid.eapId.fillna("blank")).to_string())eapId No Not Required Yes blank
publicHazardId
High 2399 1362 13200 12
Low 5668 52807 1750 34
Significant 3718 2718 4862 47
Undetermined 2968 944 137 0
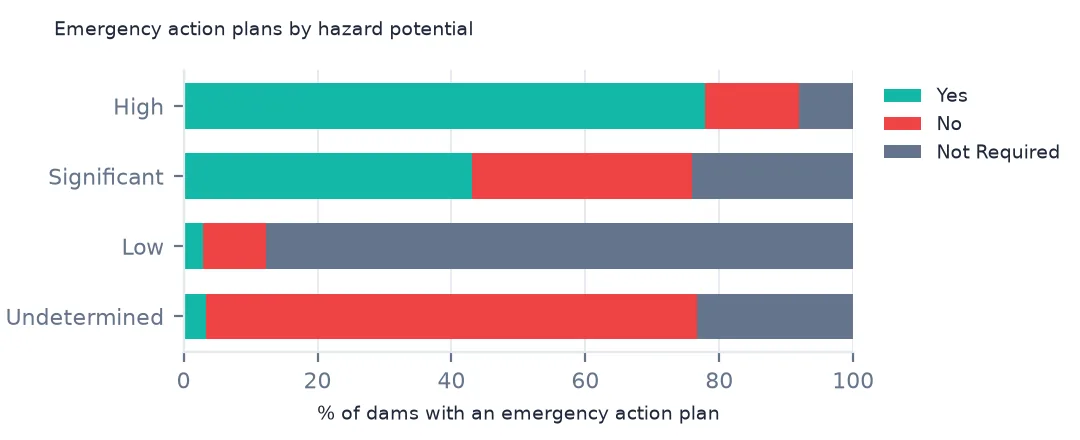
An emergency action plan says who to warn and how if a dam starts to fail. 13,200 high-hazard dams have one, while 2,399 do not, and 1,362 are recorded as not requiring one. For low-hazard dams it is mostly "Not Required".
How hazard enters the inventory
The data used on this page
The US Army Corps of Engineers' National Inventory of Dams (NID), the whole inventory as a GeoPackage from its API, downloaded on 19 October 2026 and saved on this site, because the inventory is updated as states and agencies send revisions. Heights are in feet, storage in acre-feet and areas in acres, as the NID gives them.
from pathlib import Path
import zipfile

import geopandas as gpd
import numpy as np
import pandas as pd
import requests

Path("data").mkdir(exist_ok=True)
# US Army Corps of Engineers, National Inventory of Dams: the whole inventory as a GeoPackage, and the Census
# Bureau's 2024 cartographic boundary counties. Saved 19 October 2026, because the inventory is updated continuously.
# Live: https://nid.sec.usace.army.mil/api/nation/gpkg
ARCHIVE = "usace-nid-2026-10-19.zip"
if not Path(f"data/{ARCHIVE}").exists():
    Path(f"data/{ARCHIVE}").write_bytes(requests.get(f"https://data.spatialworkflow.io/{ARCHIVE}", timeout=900).content)
Z = zipfile.ZipFile(f"data/{ARCHIVE}")
if not Path("data/nid.gpkg").exists():
    Z.extract("nid.gpkg", "data")
NUMERIC = ["damHeight", "hydraulicHeight", "structuralHeight", "nidHeight", "damLength", "volume", "yearCompleted",
           "nidStorage", "maxStorage", "normalStorage", "surfaceArea", "drainageArea", "maxDischarge"]
nid = gpd.read_file("data/nid.gpkg")
nid[NUMERIC] = nid[NUMERIC].apply(pd.to_numeric, errors="coerce")       # the GeoPackage stores them as text
print(f"National Inventory of Dams: {len(nid):,} rows, {nid.nidId.nunique():,} NID ids")
National Inventory of Dams: 92,626 rows, 91,840 NID ids
Example 1: why small low-hazard dams are missing
low = nid[nid.publicHazardId == "Low"]
print(f"low-hazard dams under 6 ft and under 50 acre-feet: {((low.nidHeight < 6) & (low.nidStorage < 50)).sum()}; of {len(low):,}")
print(f"low-hazard share by height class: {low.nidHeightId.value_counts(normalize=True).round(3).to_dict()}")
low-hazard dams under 6 ft and under 50 acre-feet: 6; of 60,259
low-hazard share by height class: {'Less than 25 feet': 0.54, '25-50 feet': 0.437, '51-100 feet': 0.022, 'Greater than 100 feet': 0.001, 'Undetermined': 0.0}
Only 6 of the 60,259 low-hazard dams are below both 6 feet and 50 acre-feet, so the inventory's thresholds hold. Tens of thousands of smaller farm ponds exist and are simply not in it. A count of "dams" from the NID is a count of dams above these thresholds, plus every dam whose failure would matter.
Example 2: hazard by owner type
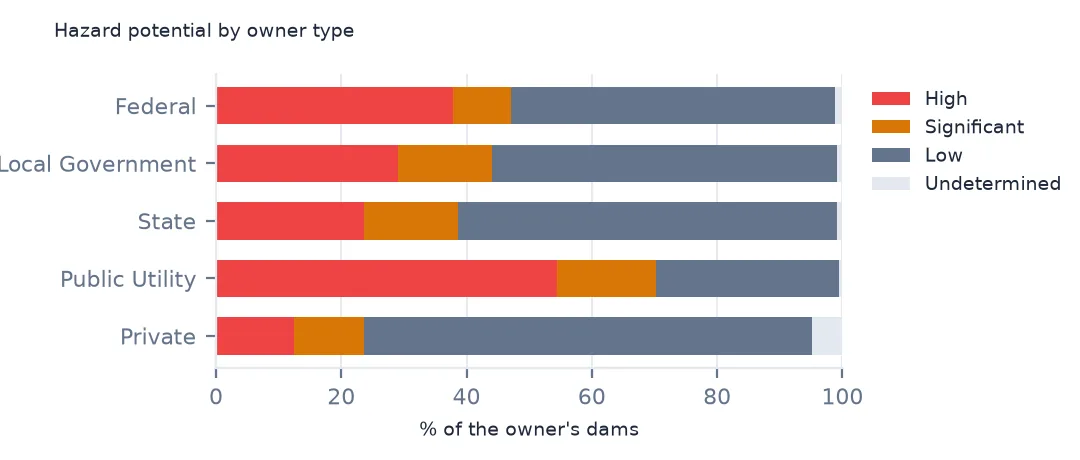
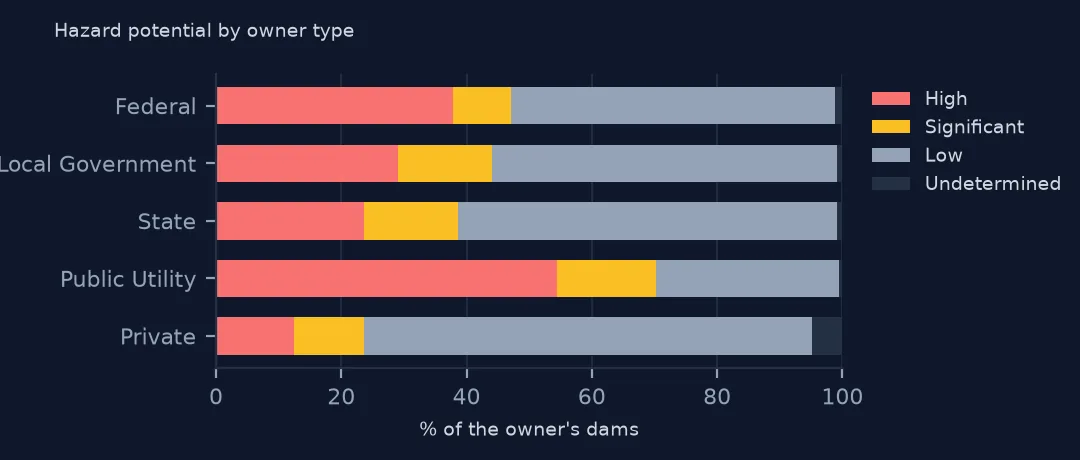
print(pd.crosstab(nid.primaryOwnerTypeId, nid.publicHazardId, normalize="index").round(3).loc[["Private", "Local Government", "State", "Federal"]].to_string())publicHazardId High Low Significant Undetermined
primaryOwnerTypeId
Private 0.124 0.715 0.112 0.049
Local Government 0.291 0.551 0.151 0.008
State 0.237 0.606 0.149 0.008
Federal 0.379 0.517 0.092 0.012
Private owners hold most dams, and only 12.4% of theirs are high hazard. Federal dams are larger and often above cities, and 37.9% of them are high hazard. Local governments' dams, many of them water-supply reservoirs near towns, are 29.1% high hazard.
Getting the dam data without code
- Look first: the National Inventory of Dams website has a map of every dam. A dam's own page lists its owner, purpose, size, hazard potential and, where the state publishes it, its condition and inspection date.
- Download: the website's download page offers the whole inventory as a spreadsheet or a GIS file. The same files come from the NID's API: the GeoPackage these pages use is at
https://nid.sec.usace.army.mil/api/nation/gpkg. A GeoPackage opens in QGIS by dragging it onto the map. - What is included: high and significant hazard dams always, and low-hazard dams that exceed 25 feet in height with 15 acre-feet of storage, or 6 feet with 50 acre-feet. Smaller farm ponds and private dams are left out.
- Condition: condition assessments appear only where the regulating state or agency releases them, so most dams show none.
- How current it is: the inventory is updated continuously as states and federal agencies send revisions, and each row has its own
dataUpdateddate. These pages read a copy downloaded on 19 October 2026, saved at data.spatialworkflow.io. - Credit: US Army Corps of Engineers, National Inventory of Dams, with the date you downloaded it. It is a federal dataset, free to reuse.
Internal links
- High-hazard dams in poor condition — the two fields combined, by state
- Reading the inventory — the columns and their units
- Dams by county — where the high-hazard dams are
- Hazard and risk explained — the same distinction for natural hazards