
How to Read the National Inventory of Dams in Python
On this page
Problem statement
The US Army Corps of Engineers keeps the National Inventory of Dams, the federal list of more than ninety thousand dams that are tall enough, hold enough water or would do enough harm if they failed to be tracked. Each row has the dam's location, owner, purpose, height, length, reservoir storage, the year it was finished, its hazard potential and, for many, a condition assessment and an emergency plan. The whole inventory downloads as one GeoPackage from the NID's API. Read as it comes, every measurement is text, several dams share one ID, and the units are American. This page reads the inventory and shows what is in it.
Quick answer
Read the GeoPackage with GeoPandas and convert the measurement columns to numbers; the setup below does it:
print(nid[["nidId", "name", "state", "county", "primaryPurposeId", "nidHeight", "nidStorage", "yearCompleted", "publicHazardId"]].head(3).to_string(index=False))
print(f"{len(nid):,} rows; {len(nid.columns)} columns; CRS {nid.crs.to_epsg()}")
nidId name state county primaryPurposeId nidHeight nidStorage yearCompleted publicHazardId
OK20998 Dod Usa 4 Oklahoma Muskogee Recreation 15 50.0 1940.0 Low
OK20994 Dod Usa 2 Oklahoma Muskogee Recreation 18 50.0 1939.0 Low
KY00728 Aichi Forge Usa Dam Kentucky Scott Other 15 86.8 1974.0 Low
92,626 rows; 98 columns; CRS 4269
The inventory has 92,626 rows and 98 columns in NAD83 (EPSG:4269). The first rows are small Oklahoma recreation dams owned by the Defence Department, 15 and 18 feet high, holding 50 acre-feet each, finished in 1939 and 1940. Most of the 98 columns are coded categories with names ending in Id, which in this file hold readable labels such as "Recreation" or "Low", not numeric codes.
Rows, ids and units
1. One row per structure
print(nid.isAssociatedStructureId.value_counts().to_string())
print(f"NID ids used by more than one row: {nid.nidId.duplicated(keep=False).groupby(nid.nidId).any().sum()}")
isAssociatedStructureId
No 91616
Yes 1010
NID ids used by more than one row: 437
A row is a structure, not a dam project. 1,010 rows are associated structures, such as saddle dikes, spillway dams and levees, that share the NID id of a main dam. 437 ids are used by more than one row. Count dams with nidId.nunique() or after dropping the associated structures, never with len().
2. Which height and which storage
h = nid[["damHeight", "hydraulicHeight", "structuralHeight"]]
print(f"nidHeight equals the largest of the three heights: {(nid.nidHeight == h.max(axis=1)).mean():.1%}")
print(f"nidStorage equals the larger of max and normal storage: {(nid.nidStorage == nid[['maxStorage', 'normalStorage']].max(axis=1)).mean():.1%}")
print(nid[["nidHeight", "nidStorage", "surfaceArea", "drainageArea"]].describe().loc[["50%", "max"]].round(1).to_string())
nidHeight equals the largest of the three heights: 99.5%
nidStorage equals the larger of max and normal storage: 99.4%
nidHeight nidStorage surfaceArea drainageArea
50% 24.0 132.0 12.0 1.3
max 789.0 277540000.0 20255000.0 8300000.0
The inventory has three heights: the dam's height, the hydraulic height (the depth of water it holds) and the structural height. nidHeight is the largest of them for 99.5% of rows. Likewise, nidStorage is the larger of maximum and normal storage for 99.4%. The median dam is 24 feet high and holds 132 acre-feet, a farm-scale dam. The maximum storage, 277.5 million acre-feet, is not a reservoir at all, as the storage pages show. Areas are in acres and drainage areas in square miles.
3. How fresh each row is
print(nid.dataUpdated.dt.year.value_counts().sort_index().tail(4).to_string())
print(f"inspected 2021-2026: {nid.inspectionDate.dt.year.between(2021, 2026).mean():.1%}; no inspection date: {nid.inspectionDate.isna().mean():.1%}")
print("inspection dates in the future:", nid.loc[nid.inspectionDate.dt.year > 2026, ["nidId", "inspectionDate"]].to_dict("records"))
dataUpdated
2023 349
2024 2037
2025 4993
2026 68087
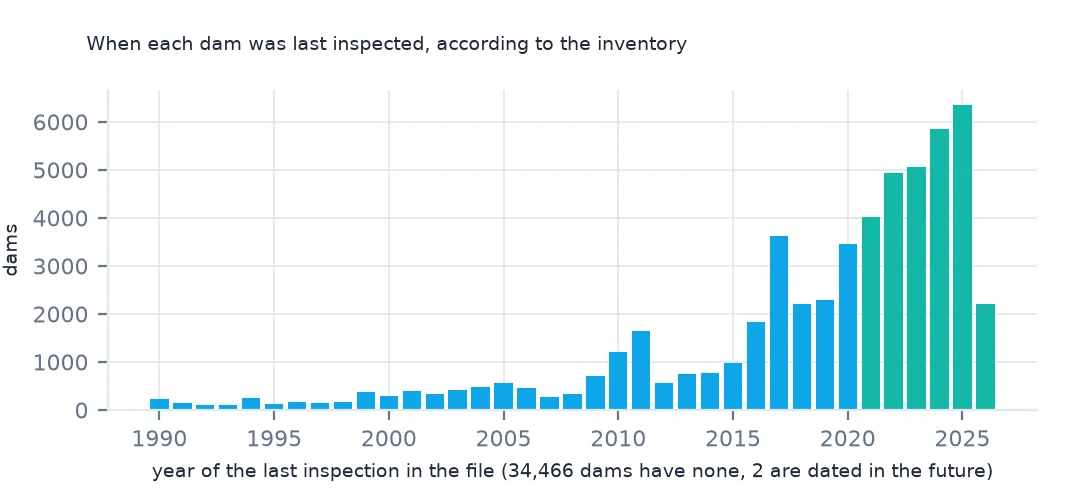
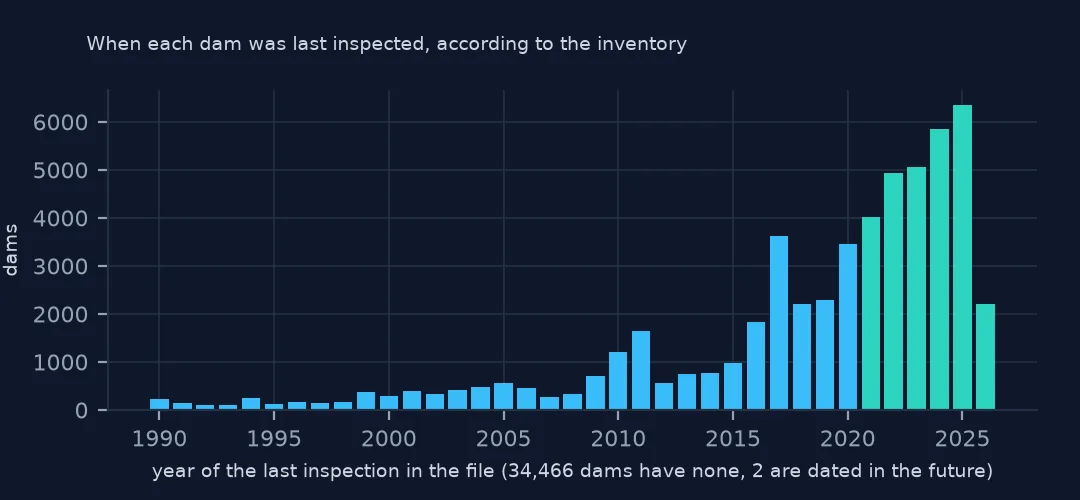
inspected 2021-2026: 30.7%; no inspection date: 37.2%
inspection dates in the future: [{'nidId': 'KS02157', 'inspectionDate': Timestamp('2041-07-16 00:00:00')}, {'nidId': 'IL00855', 'inspectionDate': Timestamp('5023-05-25 00:00:00')}]
68,087 rows were last updated in 2026, so most of the file is recent. Inspections are another matter: only 30.7% of dams have an inspection dated 2021 to 2026, and 37.2% have none, mostly low-hazard dams whose states don't publish one. Two inspection dates are in the future, 2041 and 5023, typing errors that would break any "years since inspection" calculation unless they are caught.
States and a map
The data used on this page
The US Army Corps of Engineers' National Inventory of Dams (NID), the whole inventory as a GeoPackage from its API, downloaded on 19 October 2026 and saved on this site, because the inventory is updated as states and agencies send revisions. Heights are in feet, storage in acre-feet and areas in acres, as the NID gives them.
from pathlib import Path
import zipfile

import geopandas as gpd
import numpy as np
import pandas as pd
import requests

Path("data").mkdir(exist_ok=True)
# US Army Corps of Engineers, National Inventory of Dams: the whole inventory as a GeoPackage, and the Census
# Bureau's 2024 cartographic boundary counties. Saved 19 October 2026, because the inventory is updated continuously.
# Live: https://nid.sec.usace.army.mil/api/nation/gpkg
ARCHIVE = "usace-nid-2026-10-19.zip"
if not Path(f"data/{ARCHIVE}").exists():
    Path(f"data/{ARCHIVE}").write_bytes(requests.get(f"https://data.spatialworkflow.io/{ARCHIVE}", timeout=900).content)
Z = zipfile.ZipFile(f"data/{ARCHIVE}")
if not Path("data/nid.gpkg").exists():
    Z.extract("nid.gpkg", "data")
NUMERIC = ["damHeight", "hydraulicHeight", "structuralHeight", "nidHeight", "damLength", "volume", "yearCompleted",
           "nidStorage", "maxStorage", "normalStorage", "surfaceArea", "drainageArea", "maxDischarge"]
nid = gpd.read_file("data/nid.gpkg")
nid[NUMERIC] = nid[NUMERIC].apply(pd.to_numeric, errors="coerce")       # the GeoPackage stores them as text
print(f"National Inventory of Dams: {len(nid):,} rows, {nid.nidId.nunique():,} NID ids")
National Inventory of Dams: 92,626 rows, 91,840 NID ids
Example 1: dams by state
print(nid.state.value_counts().head(6).to_string())
print(f"states and territories: {nid.state.nunique()}")
state
Texas 7421
Kansas 6477
Mississippi 6092
Georgia 5388
Missouri 5385
Oklahoma 5008
states and territories: 52
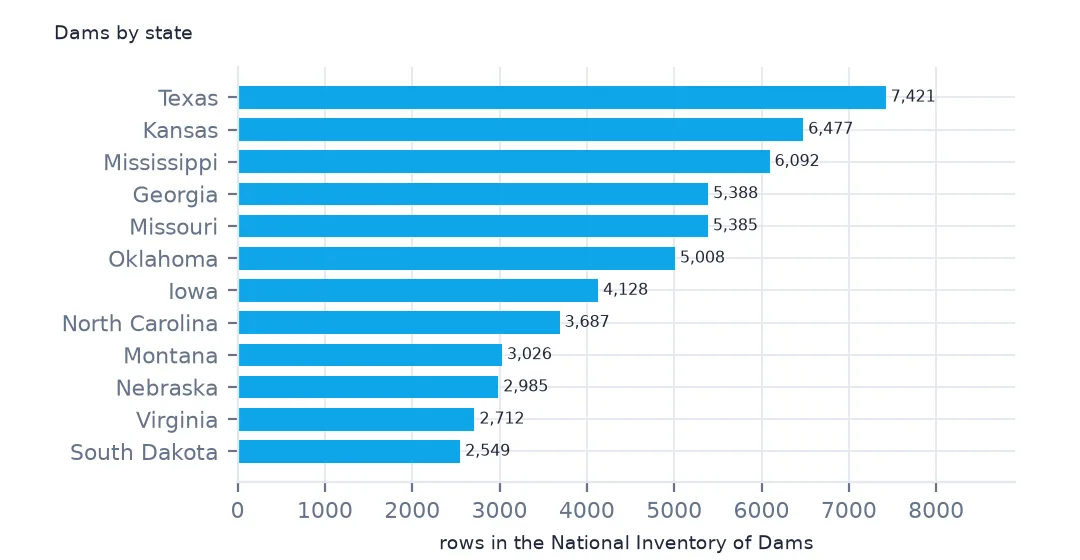
Texas has the most dams, 7,421, then Kansas, Mississippi, Georgia, Missouri and Oklahoma, each with 5,000 to 6,500. Most of them are small earthen dams on farms and ranches. The state column holds full names, and 52 values include Puerto Rico and Guam.
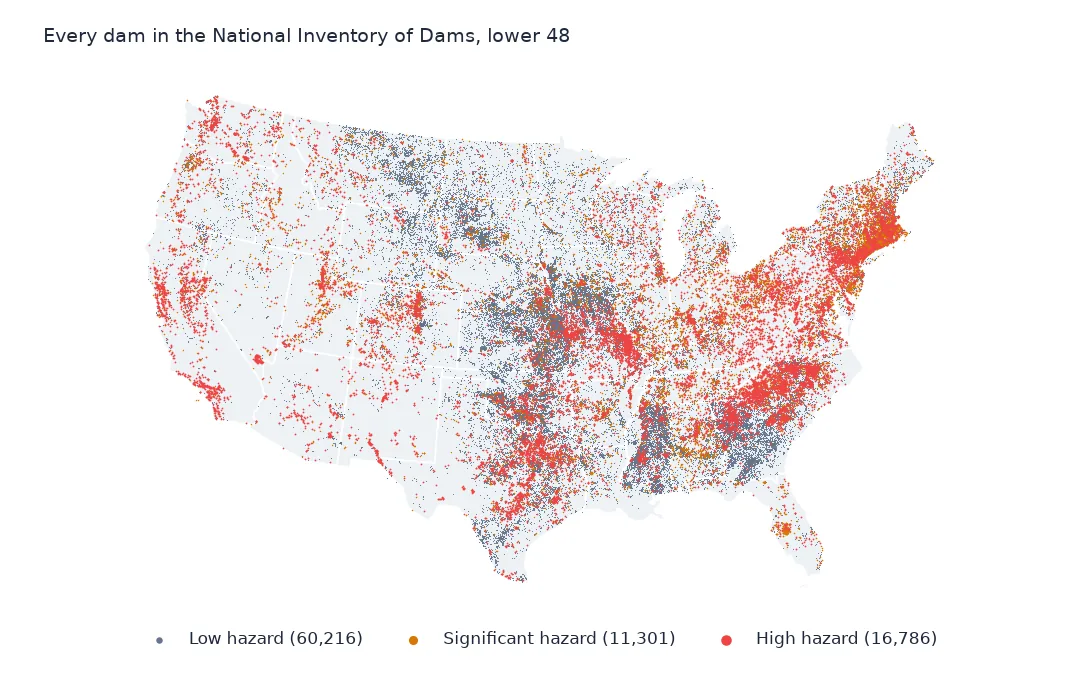
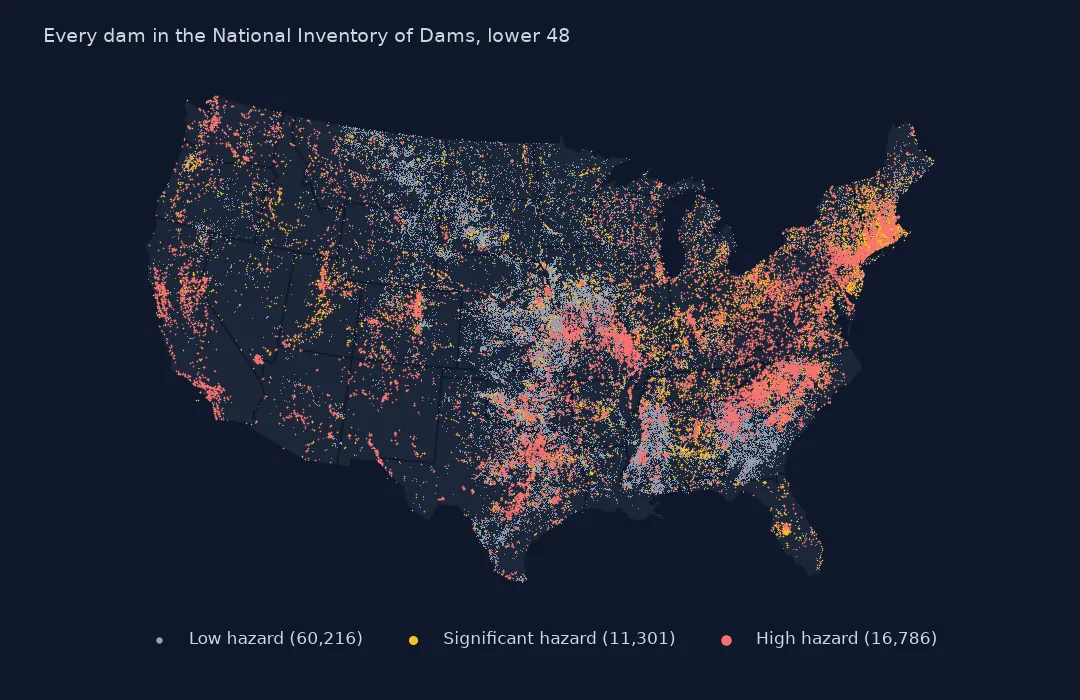
Example 2: every dam on a map
null_island = (nid.geometry.x == 0) & (nid.geometry.y == 0)
print("at longitude 0, latitude 0:", nid.loc[null_island, ["nidId", "name", "state"]].to_dict("records"))
lower48 = nid[~nid.state.isin(["Alaska", "Hawaii", "Puerto Rico", "Guam"]) & ~null_island].to_crs(5070)
ax = lower48.plot(markersize=0.2, figsize=(11, 7))
ax.set_axis_off()
print(f"dams drawn: {len(lower48):,}; without coordinates: {nid.geometry.is_empty.sum()}")
at longitude 0, latitude 0: [{'nidId': 'WI01242', 'name': 'Milwaukee County Grounds', 'state': 'Wisconsin'}, {'nidId': 'WI20048', 'name': 'Little Turtle Sub-Impoundment', 'state': 'Wisconsin'}]
dams drawn: 92,352; without coordinates: 0
Every row has coordinates, but two Wisconsin dams are at longitude 0, latitude 0, in the Gulf of Guinea, where a missing position was written as zero. Left in, they stretch the map's extent across the Atlantic. The 92,352 dams drawn in the lower 48 crowd the plains from Texas to the Dakotas and the Southeast, where farm ponds and small flood-control dams are densest.
Internal links
- Hazard potential explained — what "high hazard" means, and getting the data without code
- Numbers stored as text — why the setup converts columns
- Storage counted many times — rows that share a reservoir
- Dams by county — the inventory mapped