
dNBR shows burn severity outside the fire perimeter
On this page
Problem statement
The dNBR map looks right inside the fire and wrong everywhere else: orchards west of the perimeter classified as moderate severity, grassland glowing low-severity for kilometres, a reservoir speckled with high values. Nothing burned there.
dNBR does not measure burning. It measures the change in the normalised burn ratio between two images, and anything that dries out, gets harvested, gets cut or changes water level between them moves that ratio in the same direction as fire. The size of the problem depends almost entirely on which pre-fire image was chosen: around the 2024 Park Fire, a May pre-image puts 6.6 km² of unburned land above the moderate-severity threshold, and a July one puts 0.9 km² there.
Quick answer
Compute the offset in unburned land and look at it before believing anything:
import numpy as np, pystac_client, planetary_computer, rasterio, geopandas as gpd
from rasterio.enums import Resampling
from rasterio.features import geometry_mask
from rasterio.transform import from_origin
from rasterio.vrt import WarpedVRT
from rasterio.warp import transform_bounds

BBOX = [-121.95, 39.72, -121.60, 39.98]          # straddles the fire's western edge
CRS, RES = "EPSG:32610", 20
left, bottom, right, top = transform_bounds(4326, CRS, *BBOX)
GRID = {"crs": CRS, "transform": from_origin(left, top, RES, RES),
        "width": int((right - left) // RES), "height": int((top - bottom) // RES)}
cat = pystac_client.Client.open("https://planetarycomputer.microsoft.com/api/stac/v1",
                                modifier=planetary_computer.sign_inplace)

def mosaic(day, asset):
    """One band, one acquisition, both tiles the window spans, on a fixed grid."""
    out = np.full((GRID["height"], GRID["width"]), np.nan, "float32")
    for it in cat.search(collections=["sentinel-2-l2a"], bbox=BBOX,
                         datetime=f"{day}/{day}").items():
        if "R113" not in it.id:                   # one relative orbit: one date, one sun angle
            continue
        with rasterio.open(it.assets[asset].href) as src, WarpedVRT(
                src, crs=CRS, transform=GRID["transform"], width=GRID["width"],
                height=GRID["height"], resampling=Resampling.bilinear, nodata=0) as vrt:
            a = vrt.read(1).astype("float32")
        a[a == 0] = np.nan
        m = np.isnan(out) & np.isfinite(a)
        out[m] = a[m]
    return out

def nbr(day):
    nir, swir = mosaic(day, "B08"), mosaic(day, "B12")
    return (nir - swir) / (nir + swir)

may, july, post = nbr("2024-05-13"), nbr("2024-07-02"), nbr("2024-09-10")

fire = gpd.read_file("park_perimeter.geojson")
fire = fire[fire.poly_GISAcres > 1000].to_crs(CRS)
burned = geometry_mask([fire.union_all()], out_shape=(GRID["height"], GRID["width"]),
                       transform=GRID["transform"], invert=True)

dnbr = (july - post) * 1000
print(f"window {dnbr.shape}, {burned.mean():.0%} of it inside the perimeter")
print(f"unburned: median dNBR {np.nanmedian(dnbr[~burned]):.0f}, "
      f"{np.nanmean(dnbr[~burned] >= 270):.1%} above the moderate threshold")
print(f"burned:   median dNBR {np.nanmedian(dnbr[burned]):.0f}, "
      f"{np.nanmean(dnbr[burned] >= 270):.1%} above it")
window (1463, 1516), 40% of it inside the perimeter
unburned: median dNBR 11, 0.2% above the moderate threshold
burned: median dNBR 292, 54.1% above it
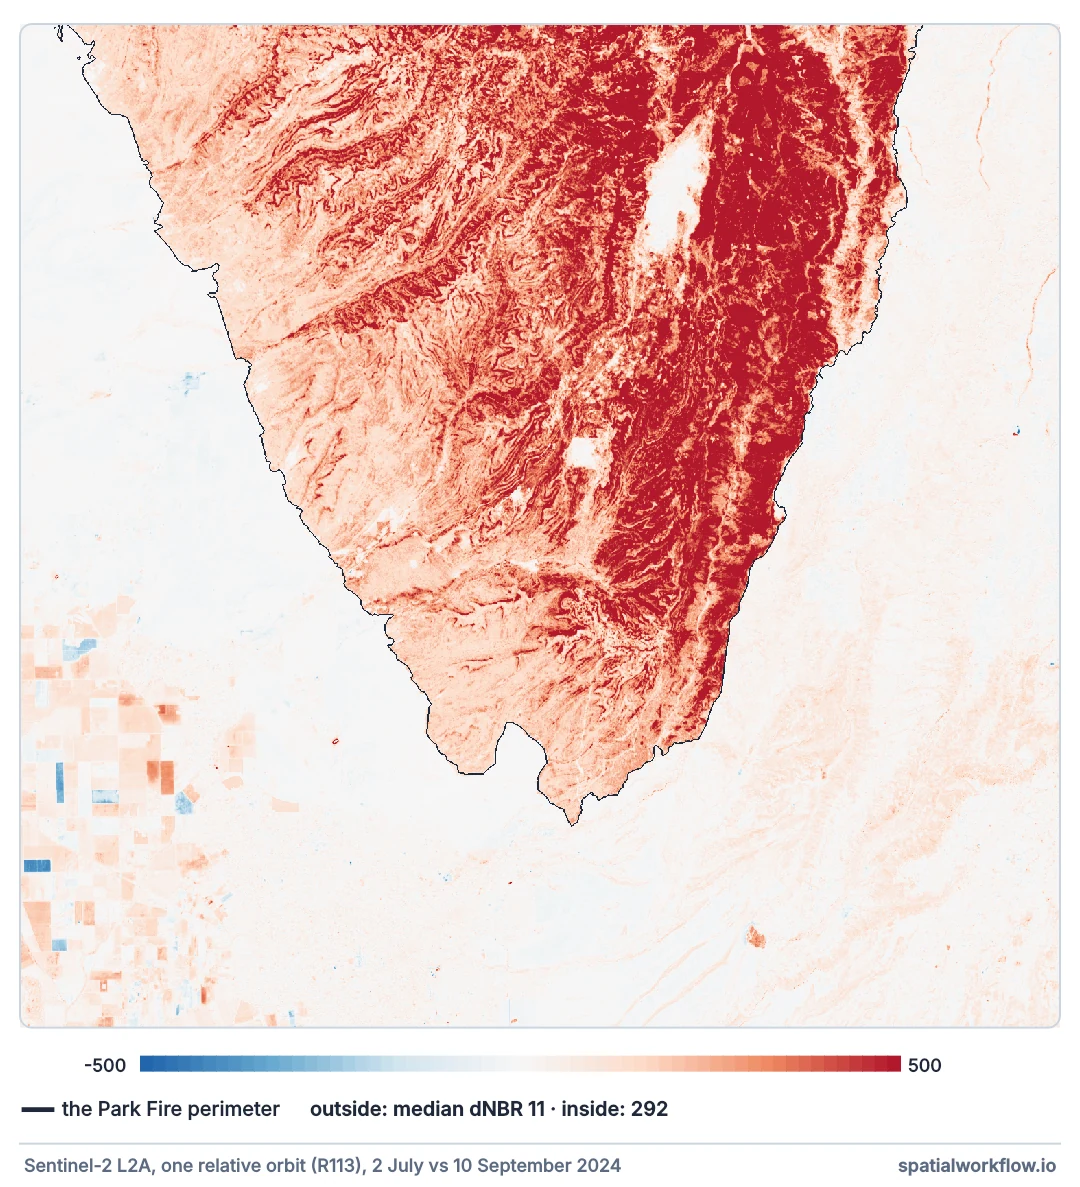
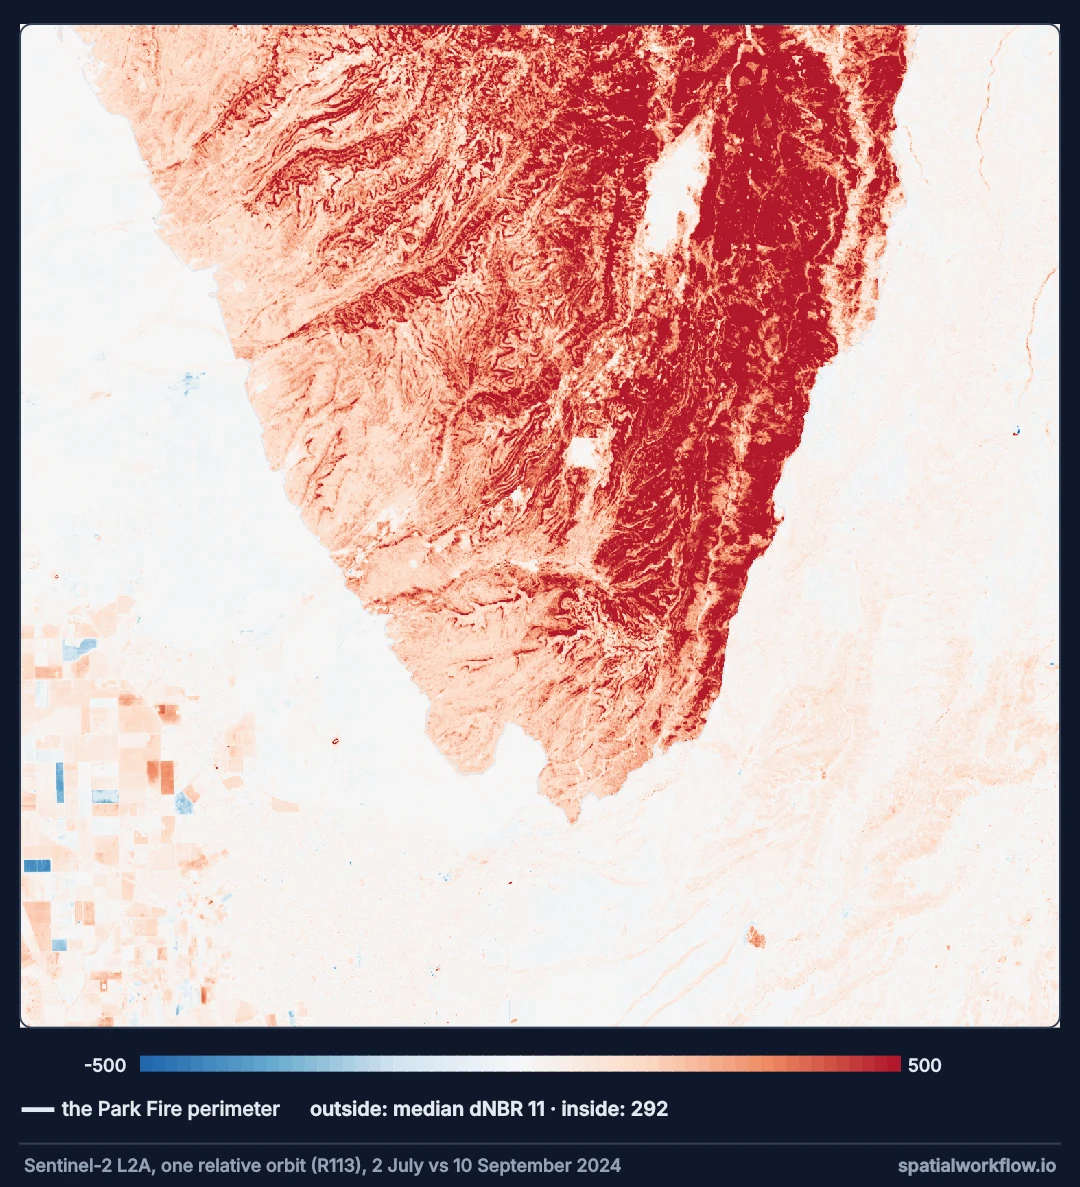
A few tenths of a percent outside is noise. Percentage points outside mean the pair is measuring something other than fire.
A close pre-image, the same season, an offset from unburned ground
1. Pick the pre-image as close to the fire as possible
Not the clearest scene of the year — the last clear scene before ignition. Every week between the pre-image and the fire is a week of phenology folded into the result.
2. Keep the season if you cannot keep the date
Where the post-fire scene must be from the following spring, use the previous spring as the pre-image. An anniversary pair cancels most of the seasonal signal; a May-to-September pair adds it.
3. Measure the offset in unburned ground
The median dNBR in nearby unburned land is the offset. Report it. Published severity products, including MTBS, subtract it.
4. Mask to the perimeter, with a buffer
The perimeter is the answer to "where did it burn". Anything outside it plus a buffer is not severity, whatever its value.
5. Drop the surfaces where the index is meaningless
Water, snow and bare rock have no vegetation to burn, and the ratio is unstable where NIR and SWIR are both small. Exclude them by land cover rather than by threshold.
6. Check cloud and shadow in both scenes
A cloud in the post-image and its shadow both produce large apparent change. Use the scene classification band, not a cloud-cover percentage.
What the pre-image date costs
The data used on this page
The 2024 Park Fire perimeter from the WFIGS interagency fire perimeters service (park_perimeter.geojson). The Sentinel-2 scenes and the WorldCover map are read from the Microsoft Planetary Computer in the code itself.
import os

import geopandas as gpd
import requests

WFIGS = ("https://services3.arcgis.com/T4QMspbfLg3qTGWY/arcgis/rest/services/"
         "WFIGS_Interagency_Perimeters/FeatureServer/0/query")
if not os.path.exists("park_perimeter.geojson"):
    reply = requests.get(WFIGS, params={"where": "poly_IncidentName='PARK' AND attr_POOState='US-CA'",
                                        "outFields": "*", "f": "geojson", "outSR": 4326}, timeout=300)
    reply.raise_for_status()
    open("park_perimeter.geojson", "w").write(reply.text)
fire = gpd.read_file("park_perimeter.geojson")
print(len(fire), "PARK perimeters;", int((fire.poly_GISAcres > 1000).sum()), "over 1,000 acres")
3 PARK perimeters; 1 over 1,000 acres
Example 1 — how much the pre-image date costs
for name, pre in [("May pre-image", may), ("July pre-image", july)]:
    d = (pre - post) * 1000
    u, b = d[~burned], d[burned]
    print(f"{name}:")
    print(f"   unburned  median {np.nanmedian(u):5.0f}   >=100 {np.nanmean(u >= 100):6.1%}"
          f"   >=270 {np.nanmean(u >= 270):6.1%}   = {np.nansum(u >= 270) * RES * RES / 1e6:5.1f} km²")
    print(f"   burned    median {np.nanmedian(b):5.0f}   >=100 {np.nanmean(b >= 100):6.1%}"
          f"   >=270 {np.nanmean(b >= 270):6.1%}")
May pre-image:
unburned median 33 >=100 20.8% >=270 1.3% = 6.6 km²
burned median 336 >=100 96.1% >=270 63.8%
July pre-image:
unburned median 11 >=100 5.0% >=270 0.2% = 0.9 km²
burned median 292 >=100 96.0% >=270 54.1%
The burned figures barely move — a fire is a large signal. The unburned figures move by a factor of seven, and they are the ones a reader will take for damage.
Example 2 — which land covers produce the false severity
wc_item = next(cat.search(collections=["esa-worldcover"], bbox=BBOX).items())
with rasterio.open(wc_item.assets["map"].href) as src, WarpedVRT(
        src, crs=CRS, transform=GRID["transform"], width=GRID["width"],
        height=GRID["height"], resampling=Resampling.nearest) as vrt:
    wc = vrt.read(1)

d_may = (may - post) * 1000
false_total = int(np.nansum(d_may[~burned] >= 270))
print(f"unburned pixels called moderate+ with the May pre-image: {false_total:,}")
for code, name in [(10, "tree cover"), (30, "grassland"), (40, "cropland"),
                   (50, "built-up"), (80, "water")]:
    sel = ~burned & (wc == code)
    fp = np.nansum(d_may[sel] >= 270)
    print(f"  {name:11} {sel.sum():7,} px   median dNBR May {np.nanmedian(d_may[sel]):4.0f}"
          f"  July {np.nanmedian((july - post)[sel] * 1000):4.0f}"
          f"   >=270 {fp / sel.sum():5.1%}  = {fp / false_total:5.1%} of the false area")
unburned pixels called moderate+ with the May pre-image: 16,597
tree cover 707,371 px median dNBR May 40 July 27 >=270 0.9% = 37.9% of the false area
grassland 453,268 px median dNBR May 31 July -2 >=270 0.8% = 22.6% of the false area
cropland 75,670 px median dNBR May 17 July 0 >=270 8.5% = 38.8% of the false area
built-up 78,872 px median dNBR May 16 July 12 >=270 0.1% = 0.4% of the false area
water 1,370 px median dNBR May -51 July 8 >=270 3.6% = 0.3% of the false area
Cropland is 5% of the unburned window and 39% of its false severity: orchards and rice harvested between May and September, read as a burn. Grassland's median moves from about zero with the July pair to a clear positive with the May one — that is the annual grasses curing, which happens across the whole state every June and has nothing to do with this fire.
Example 3 — offset, mask and exclusion together
from shapely.geometry import box as _box

offset = float(np.nanmedian(d_may[~burned]))
veg = ~np.isin(wc, [50, 60, 70, 80])                          # drop built, bare, snow, water
buffered = geometry_mask([fire.union_all().buffer(500)], out_shape=wc.shape,
                         transform=GRID["transform"], invert=True)

steps = [("raw dNBR", d_may),
         ("- offset", d_may - offset),
         ("- offset, vegetated only", np.where(veg, d_may - offset, np.nan)),
         ("+ perimeter buffer", np.where(veg & buffered, d_may - offset, np.nan))]
print(f"offset from unburned land: {offset:.0f} dNBR")
for name, a in steps:
    print(f"  {name:26} unburned moderate+ "
          f"{np.nansum(a[~burned] >= 270) * RES * RES / 1e6:5.2f} km²   "
          f"burned moderate+ {np.nansum(a[burned] >= 270) * RES * RES / 1e6:6.1f} km²")
offset from unburned land: 33 dNBR
raw dNBR unburned moderate+ 6.64 km² burned moderate+ 227.9 km²
- offset unburned moderate+ 4.59 km² burned moderate+ 201.7 km²
- offset, vegetated only unburned moderate+ 4.56 km² burned moderate+ 201.7 km²
+ perimeter buffer unburned moderate+ 0.01 km² burned moderate+ 201.7 km²
The index cannot tell drying from burning
Why the index cannot tell drying from burning
The normalised burn ratio contrasts near infrared, which falls when leaves are lost, with shortwave infrared, which rises when moisture is lost. Fire does both at once, which is why the index works. So does a harvest, so does a hay cut, and so does a Californian grassland in June. The index has no way to distinguish a cause; it measures a state change that fire happens to produce strongly.
Why an offset correction is standard practice
Even a perfect image pair has a non-zero median in unburned ground, from sun angle, atmospheric correction and a few weeks of growth. Subtracting the unburned median removes the part of the signal that is common to burned and unburned land alike, which is why severity products publish an offset alongside the map. It does not fix a bad pair — after subtraction the May pair still has more unburned area above threshold than the July pair had before it.
Why the perimeter is not a cheat
Masking to the perimeter can feel like hiding the problem, but severity is defined inside a fire: it is a classification of how much a burned area burned. Outside the perimeter the quantity has no meaning, so showing it is not extra information, it is noise with a legend. Keep the unmasked array to measure the offset and to audit the map; publish the masked one.
Negative dNBR, sensors and regional thresholds
- Negative dNBR outside a fire usually means regrowth or irrigation between the two dates, and is a good sign the pair is seasonal.
- RdNBR divides by the pre-fire condition and amplifies noise where pre-fire NBR is near zero — exclude those pixels before using it.
- Different sensors for the two dates (Landsat pre, Sentinel-2 post) introduce a band-response offset on top of the seasonal one.
- Clouds in the pre-image create false negative dNBR, which hides severity rather than inventing it.
- Immediate assessment (weeks after the fire) and extended assessment (the following growing season) are different products; do not mix their thresholds.
- Thresholds are regional: the 270 and 440 breaks come from western US conifer forest and should be re-derived elsewhere.
Internal links
- Burn severity explained — what dNBR measures and what it does not
- How to map burn severity with dNBR in Python — the full workflow
- How to work with fire perimeter data in Python — the perimeter used to mask
- How to detect change between two satellite images in Python — the same problem in general form
- How to calculate NDVI from Sentinel-2 in Python — the sibling index
- Cloud masking explained: QA bands, scene classification and what they miss — the other false-change source
FAQ
Why does dNBR show change where nothing burned?
Because it measures vegetation and moisture change, not fire. Harvest, curing grass, irrigation and water level all move it the same way.
How do I choose the pre-fire image?
The last clear scene before ignition, or the same season a year earlier if the post-fire scene is from a later season.
What is the dNBR offset?
The median dNBR in unburned land near the fire, subtracted from the map to remove the change common to both.
Should I mask to the perimeter?
Yes for publication. Keep the unmasked array to measure the offset and check for problems.
Why is water noisy in dNBR?
Near infrared and shortwave infrared are both very low over water, so the ratio is dominated by noise and by water level.
Do published severity products have this problem?
They manage it with offsets, perimeters and manual review — MTBS maps are checked by an analyst before release.