
Exposure counts are double-counted or missed
On this page
Problem statement
Exposure totals that come from summing per-zone counts are almost always wrong, and wrong in a direction that flatters the analysis: bigger. Flood scenarios nest inside each other, so adding the 1-in-10, the 1-in-100 and the 1-in-500 counts the same buildings three times. Fire perimeters from different years overlap where the ground reburned — across 61 large California fires since 2020, by 784 km². A census block that touches two hazard zones is counted once in each.
The opposite error is quieter. Units whose centroid falls just outside every zone drop out of every count, and nothing in the output says so.
Quick answer
Never sum across zones. Reduce the zones to one geometry, or assign each exposure unit to exactly one class, and let the totals fall out of that:
import numpy as np, rasterio
from rasterio.enums import Resampling
from rasterio.vrt import WarpedVRT
from rasterio.windows import from_bounds
from rasterio.warp import transform_bounds
import pystac_client, planetary_computer

BBOX = [-0.46, 39.25, -0.33, 39.45]                  # south of Valencia
with rasterio.open("flood/floodmap_EFAS_RP100_C.tif") as src:
    win = from_bounds(*transform_bounds(4326, src.crs, *BBOX), src.transform)
    GRID = {"crs": src.crs, "transform": src.window_transform(win),
            "width": int(win.width), "height": int(win.height)}

def on_grid(href, resampling=Resampling.bilinear):
    with rasterio.open(href) as src, WarpedVRT(
            src, crs=GRID["crs"], transform=GRID["transform"], width=GRID["width"],
            height=GRID["height"], resampling=resampling) as vrt:
        return vrt.read(1, masked=True).filled(0)     # nodata is dry, and dry is 0

wet = {rp: on_grid(f"flood/floodmap_EFAS_RP{rp}_C.tif") > 0
       for rp in ("010", "100", "500")}

cat = pystac_client.Client.open("https://planetarycomputer.microsoft.com/api/stac/v1",
                                modifier=planetary_computer.sign_inplace)
wc = on_grid(next(cat.search(collections=["esa-worldcover"], bbox=BBOX).items())
             .assets["map"].href, Resampling.nearest)
built = wc == 50                                     # one hectare per cell

per_scenario = {rp: int((m & built).sum()) for rp, m in wet.items()}
print("built-up hectares wet, per scenario:", per_scenario)
print(f"  summed across scenarios: {sum(per_scenario.values()):,} ha  <- wrong")
print(f"  union of the scenarios:  {int((np.logical_or.reduce(list(wet.values())) & built).sum()):,} ha")
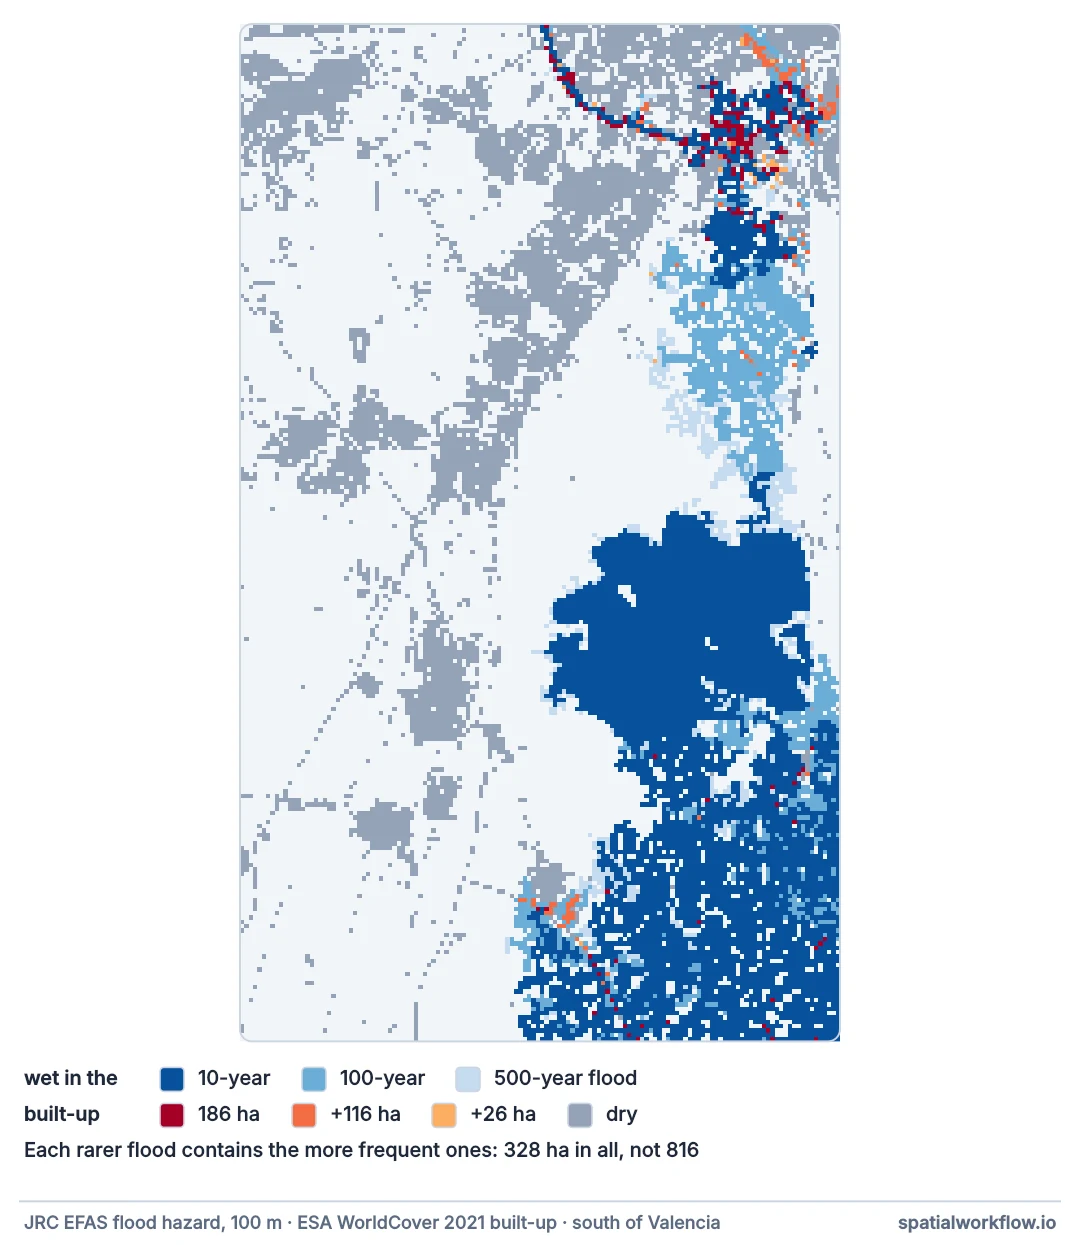
built-up hectares wet, per scenario: {'010': 186, '100': 302, '500': 328}
summed across scenarios: 816 ha <- wrong
union of the scenarios: 328 ha
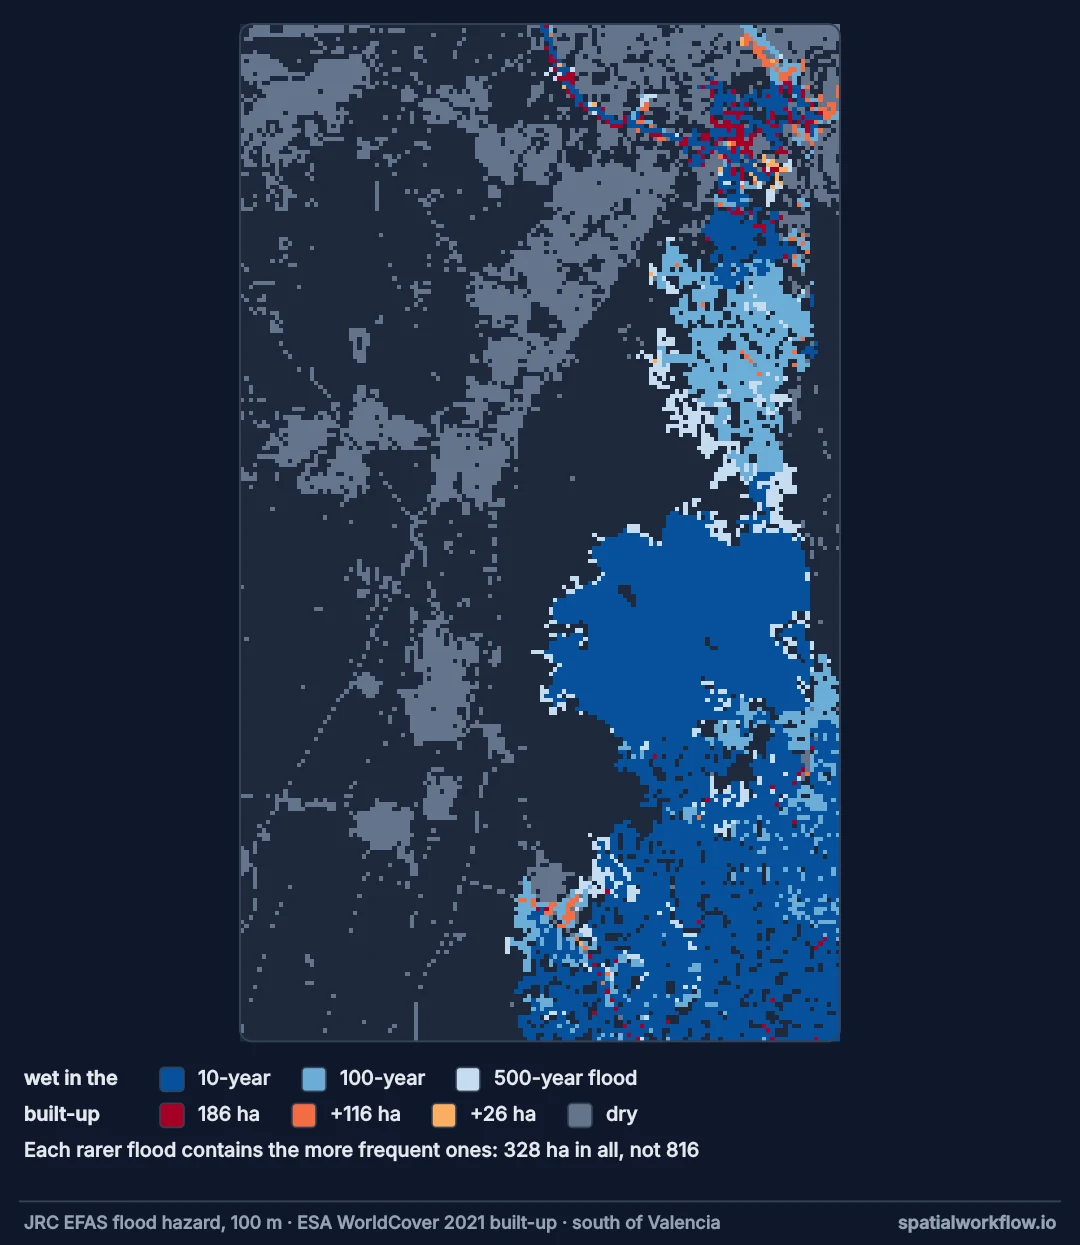
The scenarios are nested: everything wet at 1-in-10 is wet at 1-in-500. The sum counts the same hectares up to three times, and the union is simply the rarest scenario.
Nested, overlapping or disjoint, then dissolve and band
1. Ask whether the zones are nested, overlapping or disjoint
Scenarios of one hazard nest. Events of one hazard type overlap. Zones from different hazards overlap arbitrarily. Only disjoint zones can be summed, and almost nothing is disjoint.
2. Dissolve before you intersect
gdf.union_all() (or a dissolve on the grouping column) turns many polygons into the geometry you actually mean. Do it before the spatial join, not after.
3. Turn nested scenarios into exclusive bands
The 1-in-100 band is what is wet at 1-in-100 and dry at 1-in-10. Bands sum correctly, nested scenarios do not — and bands are what an expected-damage integration needs anyway.
4. Assign each exposure unit once
Give every block, building or cell a single class — the worst hazard it experiences is the usual rule — then count by class. Grouping a unit-level table cannot double-count.
5. Check the units that fall outside everything
Count what was not assigned, and look at whether those units touch a zone. A centroid rule silently drops every unit that straddles a boundary.
6. Report the reconciliation
Per-zone counts, the unique total, and the difference. The difference is the overlap, and a reader who sees it can tell what the number means.
Exclusive bands and overlapping footprints
The data used on this page
The European Flood Awareness System's pan-European flood hazard maps from the JRC (data catalogue): water depth in metres on a 100 m grid for the 1-in-10, 1-in-100, 1-in-500-year floods, one zipped GeoTIFF per return period, saved under flood/.
import os
import zipfile

import requests

EFAS = "https://jeodpp.jrc.ec.europa.eu/ftp/jrc-opendata/FLOODS/EuropeanMaps/floodMap_RP{}.zip"
os.makedirs("flood", exist_ok=True)
for rp in ("010", "100", "500"):
    tif = f"floodmap_EFAS_RP{rp}_C.tif"
    if not os.path.exists(f"flood/{tif}"):                      # about 180 MB per return period
        with requests.get(EFAS.format(rp), stream=True, timeout=600) as r:
            r.raise_for_status()
            with open("efas.zip", "wb") as f:
                for chunk in r.iter_content(1 << 20):
                    f.write(chunk)
        zipfile.ZipFile("efas.zip").extract(tif, "flood")
        os.remove("efas.zip")
print(sorted(os.listdir("flood")))
['floodmap_EFAS_RP010_C.tif', 'floodmap_EFAS_RP100_C.tif', 'floodmap_EFAS_RP500_C.tif']
The 2020 Census blocks of California with their POP20 counts, from the TIGER/Line block file for the state (blocks_ca.parquet).
import geopandas as gpd

TIGER = "https://www2.census.gov/geo/tiger/TIGER2020/TABBLOCK20/tl_2020_06_tabblock20.zip"
if not os.path.exists("blocks_ca.parquet"):                           # about 380 MB, once
    with requests.get(TIGER, stream=True, timeout=600) as r:
        r.raise_for_status()
        with open("blocks_ca.zip", "wb") as f:
            for chunk in r.iter_content(1 << 20):
                f.write(chunk)
    gpd.read_file("blocks_ca.zip", columns=["GEOID20", "POP20"]).to_parquet("blocks_ca.parquet")
    os.remove("blocks_ca.zip")
print(f"{len(gpd.read_parquet('blocks_ca.parquet')):,} blocks")
519,723 blocks
Example 1 — exclusive bands from nested scenarios
bands = {"1-in-10": wet["010"],
         "1-in-10 to 1-in-100": wet["100"] & ~wet["010"],
         "1-in-100 to 1-in-500": wet["500"] & ~wet["100"]}
total = 0
for name, m in bands.items():
    ha = int((m & built).sum())
    total += ha
    print(f"{name:22} {ha:6,} built-up hectares")
print(f"{'sum of bands':22} {total:6,}   union of scenarios "
      f"{int((np.logical_or.reduce(list(wet.values())) & built).sum()):,}")
1-in-10 186 built-up hectares
1-in-10 to 1-in-100 116 built-up hectares
1-in-100 to 1-in-500 26 built-up hectares
sum of bands 328 union of scenarios 328
Bands sum to the union exactly, because every wet cell is in one band and no cell is in two.
Example 2 — overlapping footprints from separate events
import json, urllib.parse, urllib.request
import geopandas as gpd, pandas as pd

SERVICE = ("https://services3.arcgis.com/T4QMspbfLg3qTGWY/arcgis/rest/services/"
           "WFIGS_Interagency_Perimeters/FeatureServer/0/query")
url = SERVICE + "?" + urllib.parse.urlencode(
    {"where": "attr_POOState='US-CA' AND poly_GISAcres>20000",
     "outFields": "poly_IncidentName,poly_GISAcres,attr_FireDiscoveryDateTime",
     "f": "geojson", "outSR": 4326})
req = urllib.request.Request(url, headers={"User-Agent": "example/1.0"})
fires = gpd.GeoDataFrame.from_features(
    json.loads(urllib.request.urlopen(req, timeout=240).read())["features"], crs=4326)
fires = fires[fires.geometry.notna()].to_crs(3310)
fires["year"] = pd.to_datetime(fires.attr_FireDiscoveryDateTime, unit="ms", utc=True).dt.year

summed = fires.area.sum() / 1e6
union = fires.union_all().area / 1e6
print(f"{len(fires)} California fires over 20,000 acres, {fires.year.min()}–{fires.year.max()}")
print(f"  sum of perimeter areas {summed:9,.0f} km²")
print(f"  area burned at least once {union:6,.0f} km²")
print(f"  counted twice or more     {summed - union:6,.0f} km² ({(summed - union) / summed:.1%})")
61 California fires over 20,000 acres, 2020–2026
sum of perimeter areas 27,692 km²
area burned at least once 26,908 km²
counted twice or more 784 km² (2.8%)
"Total area burned" is a sum over fires, and it is not the area that burned. For a multi-year total the gap is reburn; for one fire with several mapped perimeters it is the fire's own history.
Example 3 — exposure units inside more than one zone
blocks = gpd.read_parquet("blocks_ca.parquet").to_crs(3310)
hit = gpd.sjoin(blocks[["POP20", "geometry"]], fires[["poly_IncidentName", "geometry"]],
                predicate="intersects")

per_fire = hit.groupby("poly_IncidentName").POP20.sum()
unique_blocks = hit.index.unique()
counts = hit.groupby(level=0).size()

print(f"{len(per_fire)} fires touch these blocks")
print(f"  summed over fires        {per_fire.sum():7,} residents")
print(f"  unique blocks            {int(blocks.loc[unique_blocks].POP20.sum()):7,} residents "
      f"in {len(unique_blocks):,} blocks")
print(f"  blocks inside two fires  {int((counts > 1).sum()):7,} blocks, "
      f"{int(blocks.loc[counts[counts > 1].index].POP20.sum()):,} residents")

worst = hit.groupby(level=0).poly_IncidentName.first()     # one class per block
print(f"  assigned one fire each   {int(blocks.loc[worst.index].POP20.sum()):7,} residents")
60 fires touch these blocks
summed over fires 85,864 residents
unique blocks 85,073 residents in 6,856 blocks
blocks inside two fires 288 blocks, 708 residents
assigned one fire each 85,073 residents
The unit-level assignment and the unique total agree, as they must. The summed figure is larger, and nothing about it announces that it is a sum.
Why the error is always upward
Why the error is always upward
Every mistake in this family adds a unit to more than one bucket. There is no symmetric mistake that removes one, so a total built by summing per-zone counts is biased high — which is why published exposure figures that disagree usually disagree in one direction.
Why nested scenarios are the most common case
Hazard maps are published per return period, one file per scenario, and they look like separate layers. They are not: they are contours of one surface. Any operation that treats them as independent — summing damages, summing exposed area, averaging them — misreads what the files are.
Why the missed units are harder to catch
Double counting shows up when a total exceeds the population of the study area. An undercount looks like a plausible number. The only defence is to count the residual explicitly: how many units, and how much exposure, were assigned to no zone, and how many of those touch a zone without qualifying under the rule.
Different hazards, multipart perimeters and rasters
- Different hazards: a house exposed to flood and to fire is one house. Report per hazard and a union, never a sum.
- Multi-part perimeters for one incident are one zone; dissolve by incident id, not by feature.
- Self-intersecting or invalid geometry makes
union_all()fail or lie; runmake_validfirst. - Raster overlap has the same problem: adding two hazard masks gives cells with value 2.
- Expected annual damage already integrates over scenarios, so it must never be summed across them.
- Time: the same building flooded twice in a decade is two events and one building; say which you are counting.
Internal links
- How to count buildings and people exposed to a hazard zone — apportionment rules
- Hazard, exposure and vulnerability explained — where exposure sits
- How to combine hazard, exposure and vulnerability into a risk score — integrating over scenarios properly
- Flood hazard maps explained — why the scenarios nest
- How to work with fire perimeter data in Python — perimeters and their duplicates
- How to dissolve polygons by attribute in GeoPandas — the operation that prevents most of this
FAQ
Why is my exposure total higher than the population of the area?
Because per-zone counts were summed and the zones overlap. Dissolve them or assign each unit once.
Can I add flood scenarios together?
No. They are nested contours of one surface; use exclusive bands, or integrate over probability.
How do I turn scenarios into bands?
The 1-in-100 band is wet at 1-in-100 and dry at 1-in-10. Bands are disjoint and can be summed.
What if a block is in two hazard zones?
Assign it to one — usually the most severe — and report the overlap separately.
How do I find units that were missed?
Count what was assigned to no zone, and check how many of those intersect a zone under a looser rule.
Is a spatial join enough?
A join produces one row per pair, so its row count is not an exposure count. Group back to the unit before summing.