
How to Calculate Wildfire Season Statistics in Python
On this page
Problem statement
"The worst fire season on record", "fires are getting bigger", "the season is getting longer": claims like these come from a few lines of pandas on a fire history table, and the same table can support or undermine each of them depending on how it is summarised. Annual burned area is dominated by a handful of fires. Counts of fires depend on what was recorded. Dates are missing for many older fires. Statistics that ignore this measure the database, not the fires.
This page computes season statistics for California from CAL FIRE's historic perimeter database, every recorded fire from 1950 to 2025, and checks each one against the way the data was collected.
Quick answer
Read the attribute table (no geometry needed), then group by year:
annual = fires.groupby("YEAR_").agg(fires=("GIS_ACRES", "size"), acres=("GIS_ACRES", "sum"))
print(annual.nlargest(5, "acres").to_string(formatters={"acres": "{:,.0f}".format}))
print(f"median year 1950–2025: {annual.acres.median():,.0f} acres; 2024: {annual.loc[2024, 'acres']:,.0f}")
fires acres
YEAR_
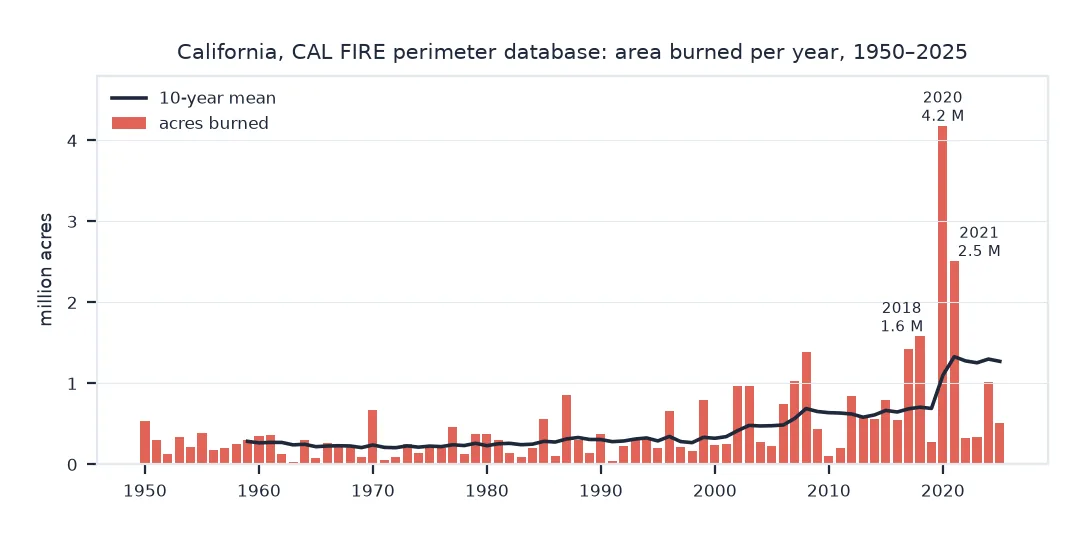
2020 504 4,182,276
2021 388 2,512,594
2018 416 1,583,620
2017 611 1,425,474
2008 439 1,382,710
median year 1950–2025: 299,637 acres; 2024: 1,011,222
Decade averages, counts that mislead, concentration
1. Average by decade, per year
A decade total is misleading when the last decade is unfinished. Divide by the number of years present:
dec = fires.assign(decade=fires.YEAR_ // 10 * 10).groupby("decade").agg(
    years=("YEAR_", "nunique"), acres=("GIS_ACRES", "sum"), fires=("GIS_ACRES", "size"), large=("GIS_ACRES", lambda s: (s >= 300).sum()))
per_year = dec[["acres", "fires", "large"]].div(dec.years, axis=0).round(0).astype(int)
print(per_year.rename(columns={"acres": "acres/yr", "fires": "fires/yr", "large": "300+ acres/yr"}).to_string())
acres/yr fires/yr 300+ acres/yr
decade
1950 284498 182 108
1960 207506 128 65
1970 260629 188 74
1980 307890 221 92
1990 334884 199 82
2000 652878 290 89
2010 690733 343 70
2020 1480113 426 74
2. Do not read fire counts as a trend
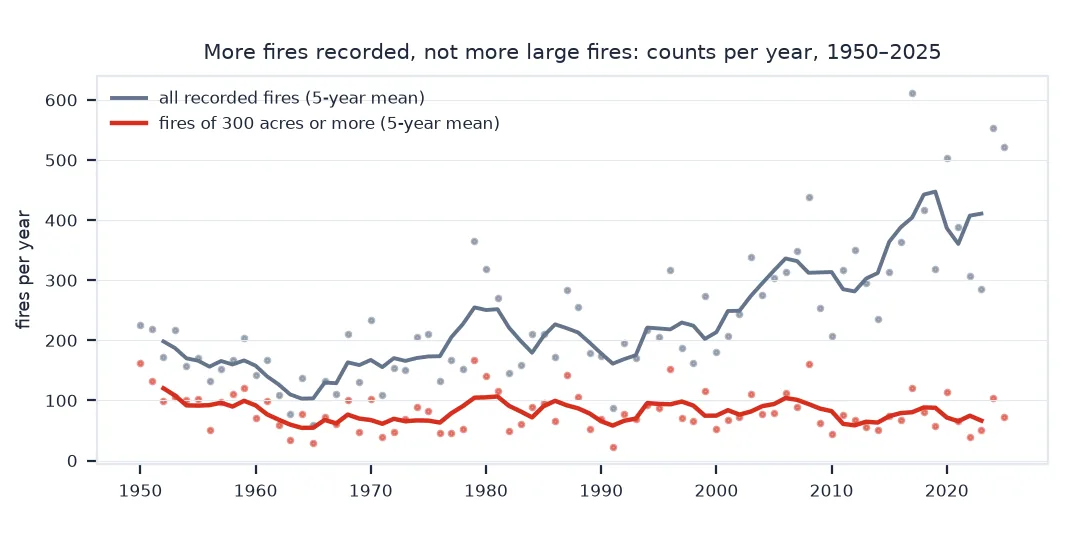
The number of recorded fires per year more than doubled, but the number of fires of 300 acres or more did not change much. Small fires were recorded more often over time, and the median size shows it:
med = fires.groupby(fires.YEAR_ // 10 * 10).GIS_ACRES.median()
print("median fire size by decade (acres):", ", ".join(f"{d}s {v:,.0f}" for d, v in med.items()))
median fire size by decade (acres): 1950s 412, 1960s 321, 1970s 153, 1980s 207, 1990s 182, 2000s 85, 2010s 32, 2020s 26
Compare counts only above a size that has been recorded consistently, and say which threshold you used.
3. Measure how concentrated each year is
A season's total is mostly a few fires. The share of each year's area burned by its five largest fires:
def top5_share(acres):
    return acres.nlargest(5).sum() / acres.sum()

share = fires.groupby("YEAR_").GIS_ACRES.apply(top5_share)
print(f"five largest fires' share of the year's area: median {share.median():.0%}; 2020 {share[2020]:.0%}; 2024 {share[2024]:.0%}")
print(f"the largest single fire of 2020: {fires[fires.YEAR_ == 2020].nlargest(1, 'GIS_ACRES').FIRE_NAME.iloc[0]}")
five largest fires' share of the year's area: median 50%; 2020 58%; 2024 62%
the largest single fire of 2020: AUGUST COMPLEX
4. Check the season's timing, and the missing dates
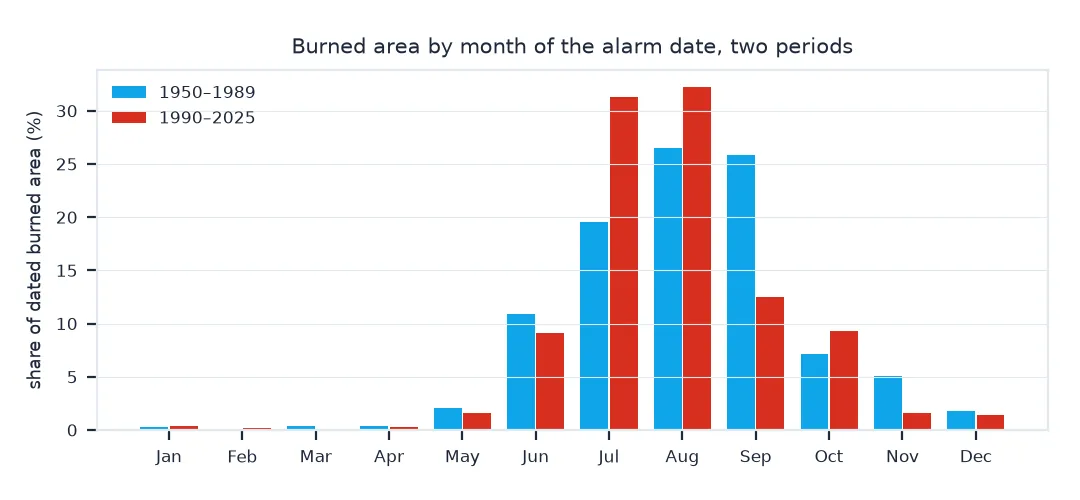
Burned area by the month the fire was reported, for two periods. Older fires often lack an alarm date, so count those first:
fires["alarm"] = pd.to_datetime(fires.ALARM_DATE, unit="ms", errors="coerce")
print("fires without an alarm date:", fires.alarm.isna().groupby(fires.YEAR_ // 10 * 10).mean().map("{:.0%}".format).to_dict())
for lo, hi in ((1950, 1989), (1990, 2025)):
    sub = fires[fires.YEAR_.between(lo, hi)]
    by_month = sub.groupby(sub.alarm.dt.month).GIS_ACRES.sum() / sub.GIS_ACRES[sub.alarm.notna()].sum()
    print(f"{lo}–{hi}: Jul–Aug {by_month.loc[7:8].sum():.0%}, Sep {by_month.loc[9]:.0%}, Oct–Nov {by_month.loc[10:11].sum():.0%} of dated area")
fires without an alarm date: {1950: '20%', 1960: '24%', 1970: '18%', 1980: '13%', 1990: '14%', 2000: '1%', 2010: '0%', 2020: '0%'}
1950–1989: Jul–Aug 46%, Sep 26%, Oct–Nov 12% of dated area
1990–2025: Jul–Aug 64%, Sep 12%, Oct–Nov 11% of dated area
July and August now carry almost two thirds of the dated burned area, up from under half, while September's share halved. A fifth of the older fires have no date at all, so the earlier shares rest on fewer fires.
What starts fires, by count and by area
The data used on this page
The attribute table of CAL FIRE's historic fire perimeter database (California_Historic_Fire_Perimeters, release firep25_1), every perimeter from 1950 to 2025, read from its public ArcGIS feature service without geometry, 2,000 records a request. Cause codes come from the layer's coded-value domain.
import pandas as pd
import requests

LAYER = "https://services1.arcgis.com/jUJYIo9tSA7EHvfZ/arcgis/rest/services/California_Historic_Fire_Perimeters/FeatureServer/0"
META = requests.get(LAYER, params={"f": "json"}, timeout=60).json()
CAUSE = {c["code"]: c["name"] for f in META["fields"] if f["name"] == "CAUSE" for c in f["domain"]["codedValues"]}
rows, offset = [], 0
while True:
    page = requests.get(LAYER + "/query", params={"where": "YEAR_ >= 1950", "outFields": "YEAR_,FIRE_NAME,GIS_ACRES,CAUSE,ALARM_DATE",
                                                  "returnGeometry": "false", "resultOffset": offset, "resultRecordCount": 2000, "f": "json"}, timeout=120).json()
    rows += [f["attributes"] for f in page["features"]]
    offset += len(page["features"])
    if not page.get("exceededTransferLimit"):
        break
fires = pd.DataFrame(rows).astype({"YEAR_": int})
print(f"{len(fires):,} fires {fires.YEAR_.min()}–{fires.YEAR_.max()}, {fires.GIS_ACRES.sum():,.0f} acres; {len(CAUSE)} cause codes")
18,064 fires 1950–2025, 36,270,862 acres; 19 cause codes
Example 1: what starts the fires, by count and by area
recent = fires[fires.YEAR_ >= 2000].assign(cause=lambda d: d.CAUSE.map(CAUSE).fillna("Unknown / Unidentified"))
group = recent.cause.where(recent.cause.isin(["Lightning", "Unknown / Unidentified"]), "Human and other")
t = recent.groupby(group).agg(fires=("GIS_ACRES", "size"), acres=("GIS_ACRES", "sum"))
t = t.assign(share_of_fires=t.fires / t.fires.sum(), share_of_area=t.acres / t.acres.sum())
print(t.to_string(formatters={"acres": "{:,.0f}".format, "share_of_fires": "{:.0%}".format, "share_of_area": "{:.0%}".format}))
fires acres share_of_fires share_of_area
cause
Human and other 4409 9,031,924 50% 40%
Lightning 1832 9,033,154 21% 40%
Unknown / Unidentified 2651 4,251,705 30% 19%
Statistics dominated by extremes
Fire statistics are dominated by extremes. Fire sizes are heavy-tailed, so a season's total depends mostly on whether one or two fires grew huge. That makes single years noisy and comparisons of one year with another unreliable. Multi-year means, decade averages per year and rolling windows smooth the noise; the share of the largest fires shows how much of it there is.
The database itself changes over time. The collection criteria for perimeters have changed, more agencies contribute, and small fires are mapped more often now than in the 1950s. Counts and medians absorb those changes, while burned area, which large fires dominate, is far less sensitive. Missing dates and causes are concentrated in older records, so seasonal or causal shifts need the share of missing values reported beside them.
Overlaps, alarm dates and missing fires
- Overlaps: summing
GIS_ACREScounts ground that burned twice in different years twice, which is right for annual area; within one year, check complexes for duplicate parts. - Year vs alarm date: group by
YEAR_, the fire year, and check that it agrees with the alarm date before mixing the two. - Alarm dates are milliseconds since 1970, UTC; months near a boundary can shift by a day.
- Fires outside the database: anything below the collection threshold is missing; see why most wildfires are missing from perimeter data.
- Other states: NIFC's interagency perimeters and the MTBS burned-area dataset cover the whole country with different thresholds.
Internal links
- How to download CAL FIRE wildfire perimeters — the perimeters themselves
- How to map fire history and reburns — the same database, mapped
FAQ
What was California's largest wildfire season?
In CAL FIRE's perimeter database, 2020, with about 4.2 million acres; 2021 is second.
Are wildfires in California getting bigger?
Burned area per year has risen strongly since the 1990s. Counts of recorded fires are not a reliable measure, because small fires were recorded less often in the past.
How do I calculate annual burned area from fire perimeters?
Group by fire year and sum the official area field (GIS_ACRES for CAL FIRE), or areas measured in an equal-area projection.
Why do a few fires dominate wildfire statistics?
Fire sizes are heavy-tailed: in a typical year here the five largest fires burned about half of the year's area.