
How to Track a Wildfire with GOES Satellite Fire Detections in Python
On this page
Problem statement
A geostationary weather satellite sees the same hemisphere every five minutes, and its infrared channels pick up the heat of large fires. NOAA's GOES-18 fire product (ABI L2 FDC) turns every scan into a grid of fire pixels. Each comes with a confidence category, a fire temperature, an area and a fire radiative power (FRP), the rate at which the fire releases energy. That makes it possible to follow a fire from its first hours, when no perimeter exists yet. The catches are in the details. The mask has dozens of codes, only some of which mean fire. The grid is in the satellite's own projection. And each pixel is about 2 km across at the equator and larger at California's latitude, so the satellite detects fires, not their edges.
This page follows the 2024 Park Fire through its first two and a half days in GOES-18 fire detections. It sums its FRP and compares the detections with the final perimeter.
Quick answer
Read each file, keep pixels whose mask code is a fire category, convert their grid positions to latitude and longitude, and record time and FRP:
rows = []
for f in FILES:
    with xr.open_dataset(f, engine="h5netcdf") as ds:
        m = ds.Mask.values[np.ix_(IY, IX)]
        fire = np.isin(m, FIRE_CODES)
        t = pd.Timestamp(ds.attrs["time_coverage_start"].rstrip("Z"), tz="UTC")
        frp = ds.Power.values[np.ix_(IY, IX)]
        for j, i in zip(*np.nonzero(fire)):
            rows.append((t, LON[j, i], LAT[j, i], int(m[j, i]), float(np.nan_to_num(frp[j, i]))))
det = pd.DataFrame(rows, columns=["time", "lon", "lat", "code", "frp_mw"])
print(f"{len(FILES)} scans, {len(det):,} fire-pixel detections in the box, "
      f"first at {det.time.min().tz_convert('America/Los_Angeles'):%d %b %H:%M %Z}")
204 scans, 6,535 fire-pixel detections in the box, first at 24 Jul 14:46 PDT
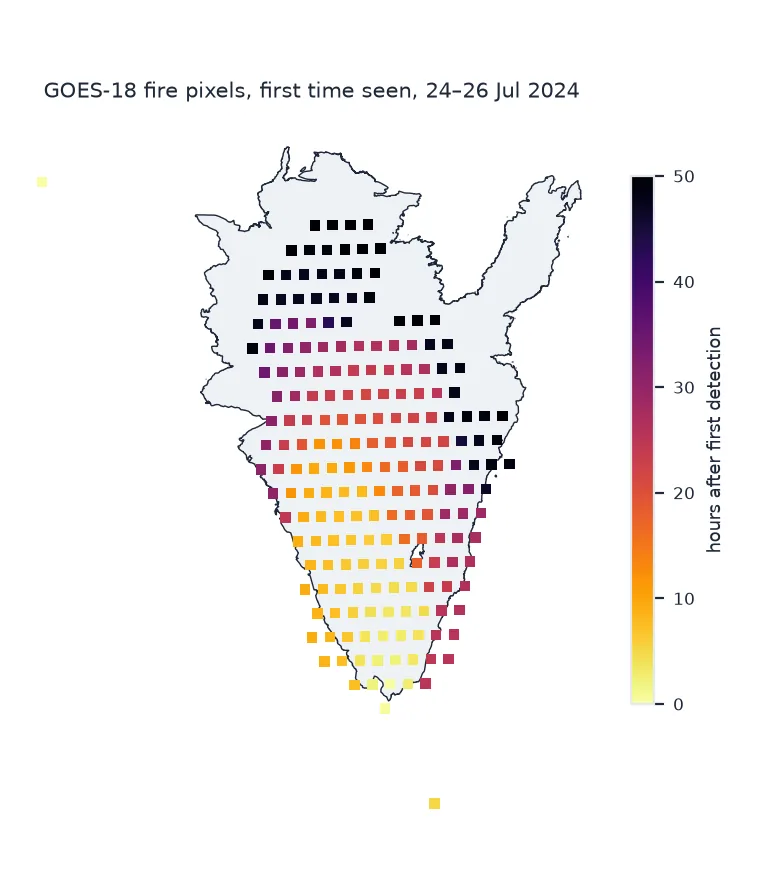
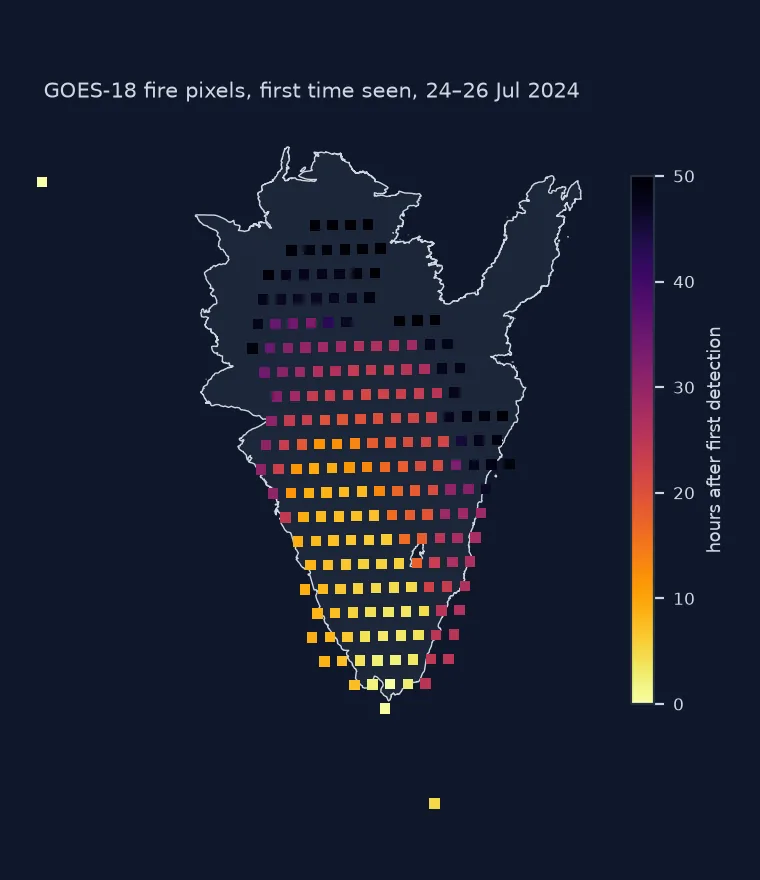
Mask codes, fire power over time, the final perimeter
1. Read the mask codes from the file
The Mask variable mixes fire categories with dozens of codes for clouds, water and failed tests. The file lists them in its flag_meanings attribute. Select the fire ones by name, not by memorised number, and read the names carefully. Code 100 is processed_no_fire_pixel, which also ends in fire_pixel. A first version of this page selected it too and counted 316,483 clear pixels as fires:
print(f"{len(MEANINGS)} mask codes in the file; fire codes: {FIRE_CODES}")
print(det.code.map(MEANINGS).value_counts().to_string())
45 mask codes in the file; fire codes: [10, 11, 12, 13, 14, 15, 30, 31, 32, 33, 34, 35]
code
temporally_filtered_good_fire_pixel 5115
temporally_filtered_cloud_contaminated_fire_pixel 922
temporally_filtered_high_probability_fire_pixel 341
temporally_filtered_saturated_fire_pixel 110
temporally_filtered_low_probability_fire_pixel 41
temporally_filtered_medium_probability_fire_pixel 5
good_fire_pixel 1
2. Follow the fire's power through time
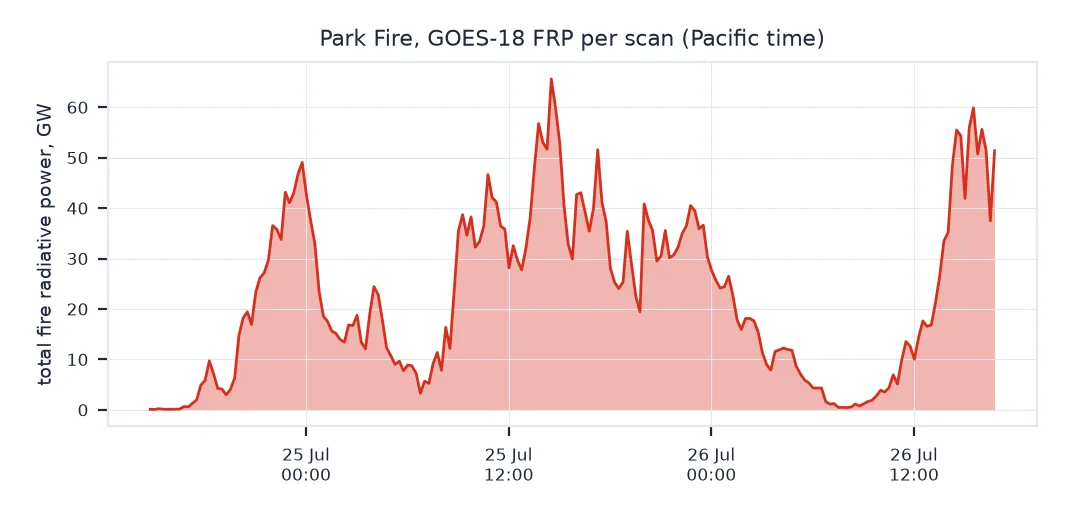
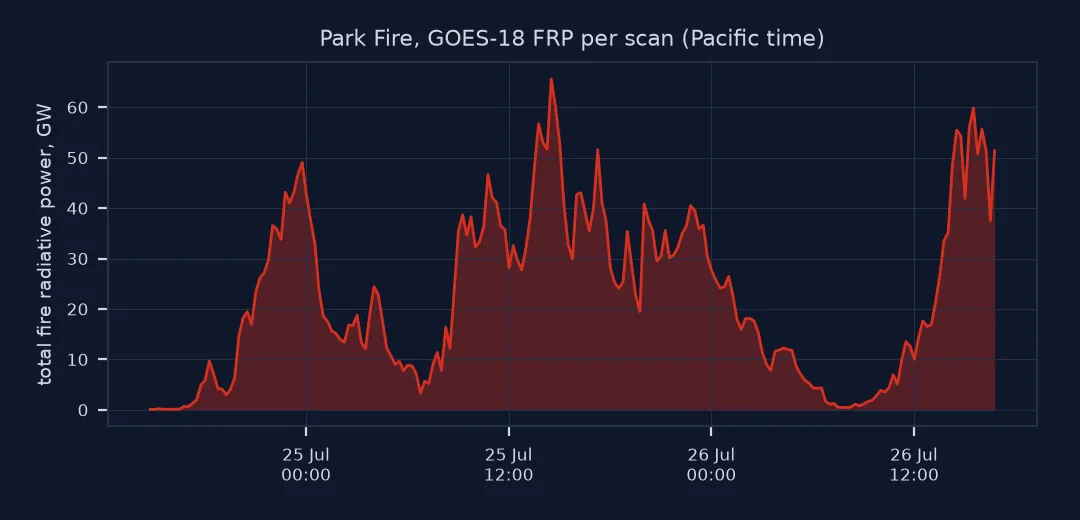
Summing the FRP of all fire pixels in each scan gives the fire's total power: a measure of how intensely it was burning, independent of pixel size:
per_scan = det.groupby("time").agg(pixels=("frp_mw", "size"), frp=("frp_mw", "sum"))
peak = per_scan.frp.idxmax()
print(f"peak FRP {per_scan.frp.max():,.0f} MW at {peak.tz_convert('America/Los_Angeles'):%d %b %H:%M %Z} "
      f"({per_scan.loc[peak, 'pixels']} pixels)")
daily = per_scan.frp.groupby(per_scan.index.tz_convert("America/Los_Angeles").date).mean()
print("mean FRP per scan by local day (MW):", {f"{d:%d %b}": round(v) for d, v in daily.items()})
peak FRP 65,610 MW at 25 Jul 14:31 PDT (52 pixels)
mean FRP per scan by local day (MW): {'24 Jul': 15127, '25 Jul': 29054, '26 Jul': 17815}
3. Compare the detections with the final perimeter
How many detections fall inside the Park Fire's final perimeter, and how does the footprint of the fire pixels compare with the area burned?
pts = gpd.GeoDataFrame(det, geometry=gpd.points_from_xy(det.lon, det.lat), crs=4326).to_crs(3310)
inside = pts.within(PARK.buffer(2000))
print(f"detections within 2 km of the final perimeter: {inside.mean():.0%}")
cells = pts.drop_duplicates(["lon", "lat"])
print(f"distinct fire pixels: {len(cells)}; pixel footprint near the fire about {PIXEL_KM2:.1f} km², "
      f"so their total footprint is {len(cells) * PIXEL_KM2:,.0f} km² against {PARK.area / 1e6:,.0f} km² burned by the end")
detections within 2 km of the final perimeter: 100%
distinct fire pixels: 201; pixel footprint near the fire about 6.8 km², so their total footprint is 1,371 km² against 1,739 km² burned by the end
All but a handful of detections lie within 2 km of the final perimeter (100% to the nearest percent), so the product placed the fire correctly. Its footprint is a different matter. After two and a half days the 201 distinct fire pixels covered about 1,371 km², while the fire went on to burn 1,739 km² over six weeks. A pixel counts as fire if any part of it burns hot enough, so pixel footprints measure where the fire was, not how much burned.
The first hours of a fire from GOES-18
The data used on this page
GOES-18 ABI L2 Fire - Hot Spot Characterization (product ABI-L2-FDCC, CONUS sector) from NOAA's archive on AWS, one scan per 15 minutes from 21:00 UTC on 24 July to 23:45 UTC on 26 July 2024; the Park Fire perimeter from CAL FIRE's last-five-years perimeter service.
import re
from pathlib import Path

import geopandas as gpd
import numpy as np
import pandas as pd
import requests
import xarray as xr
from pyproj import Proj

Path("data/fdc").mkdir(parents=True, exist_ok=True)
B = "https://noaa-goes18.s3.amazonaws.com/"
keys = []
for day in (206, 207, 208):
    for h in range(21 if day == 206 else 0, 24):
        text = requests.get(B, params={"list-type": 2, "prefix": f"ABI-L2-FDCC/2024/{day}/{h:02d}/"}, timeout=60).text
        keys += [k for k in re.findall(r"<Key>([^<]+)</Key>", text) if int(re.search(r"_s\d{9}(\d{2})", k).group(1)) % 15 < 5]
FILES = []
for k in keys:
    f = Path("data/fdc", k.rsplit("/", 1)[1])
    if not f.exists():
        f.write_bytes(requests.get(B + k, timeout=120).content)
    FILES.append(f)
with xr.open_dataset(FILES[0], engine="h5netcdf") as ds:
    p = ds.goes_imager_projection
    MEANINGS = dict(zip(ds.Mask.attrs["flag_values"].tolist(), ds.Mask.attrs["flag_meanings"].split()))
    proj = Proj(proj="geos", h=p.perspective_point_height, lon_0=p.longitude_of_projection_origin, sweep=p.sweep_angle_axis,
                a=p.semi_major_axis, b=p.semi_minor_axis)
    x, y = ds.x.values * p.perspective_point_height, ds.y.values * p.perspective_point_height
FIRE_CODES = [c for c, n in MEANINGS.items() if n.endswith("fire_pixel") and "no_fire" not in n]   # not processed_no_fire_pixel
bx, by = proj([-122.3, -121.3, -122.3, -121.3], [39.6, 39.6, 40.5, 40.5])
IX, IY = (x >= min(bx)) & (x <= max(bx)), (y >= min(by)) & (y <= max(by))
XX, YY = np.meshgrid(x[IX], y[IY])
LON, LAT = proj(XX, YY, inverse=True)
dx, dy = np.abs(np.diff(x[IX])).mean(), np.abs(np.diff(y[IY])).mean()
ctr = gpd.GeoSeries(gpd.points_from_xy(*proj(XX[:2, :2].ravel(), YY[:2, :2].ravel(), inverse=True)), crs=4326).to_crs(3310)
(x0, y0), (x1, y1), (x2, y2) = [(c.x, c.y) for c in ctr.iloc[:3]]
PIXEL_KM2 = abs((x1 - x0) * (y2 - y0) - (y1 - y0) * (x2 - x0)) / 1e6   # parallelogram spanned by neighbouring pixel centres
perims = gpd.read_file(requests.get("https://services1.arcgis.com/jUJYIo9tSA7EHvfZ/arcgis/rest/services/California_Fire_Perimeters_last_5_years_View/FeatureServer/0/query",
                                    params={"where": "FIRE_NAME='PARK' AND YEAR_=2024", "outFields": "FIRE_NAME", "outSR": 4326, "f": "geojson"}, timeout=120).text)
PARK = perims.to_crs(3310).geometry.make_valid().union_all()
print(f"{len(FILES)} GOES-18 FDC files; box of {IX.sum()} x {IY.sum()} pixels")
204 GOES-18 FDC files; box of 47 x 34 pixels
Example 1: the first hours
first = det.groupby("time").size().head(8)
print({f"{t.tz_convert('America/Los_Angeles'):%H:%M}": n for t, n in first.items()})
{'14:46': 1, '15:01': 1, '15:16': 2, '15:31': 1, '15:46': 2, '16:01': 1, '16:16': 1, '16:31': 1}
Spatial detail traded for time
A geostationary fire product trades spatial detail for time. GOES-18 sees California every five minutes (this page keeps every third scan). A fire appears as soon as it is hot and large enough to stand out in a pixel. Here the first detection came at 14:46 PDT on 24 July. Its daily cycle of flare-ups is visible, and night-time burning is captured, which polar-orbiting satellites with one or two passes a day miss. The price is the pixel size. A detection says that somewhere in a cell of several square kilometres something is burning hot enough. It does not give the fire's edge.
Fire radiative power is the most useful number in the product, because it does not depend on how many pixels the fire happens to span. Summed over a fire, it measures how intensely the fire is burning at that moment, which is why its daily cycle is so pronounced. Once the Park Fire was established it burned hardest in mid-afternoon and least before dawn. Perimeters, which come from aircraft and ground mapping, are the right tool for burned area. GOES is the right tool for when and how hard.
Filtered codes, smoke and saturated pixels
- Temporally filtered codes (30–35) are fire pixels confirmed by earlier scans; include them, as this page does by selecting fire codes by name (excluding
processed_no_fire_pixel). - Cloud and smoke hide fires; the cloud-contaminated category flags some, but a fire under thick smoke can disappear for hours.
- Pixel geolocation is the pixel centre; at the satellite's view angle it can be offset by a kilometre or more from the true fire position.
- GOES-East and GOES-West both see California; GOES-18 (West) views it at a lower angle and with smaller pixels.
- FRP of saturated pixels is unreliable; note how many are in your sum.
Internal links
- How to download CAL FIRE perimeters — the perimeter used here
- How to make a GOES satellite loop — reading GOES imagery
FAQ
How do I get GOES fire detections in Python?
Download ABI-L2-FDCC (CONUS) or ABI-L2-FDCF (full disk) files from the noaa-goes16/noaa-goes18 buckets on AWS and read them with xarray; fire pixels are those whose Mask code is a fire category.
What is fire radiative power?
The rate at which a fire emits radiant energy, in megawatts. Summed over a fire, it indicates how intensely it is burning.
How accurate are GOES fire locations?
To roughly a pixel, about 2 km at nadir and larger towards the edge of the view; use perimeters or polar-orbiting detections for finer positions.
Why do GOES fire detections disappear at times?
Clouds, thick smoke or a fire too small or cool to detect in a large pixel; scans with missing detections do not mean the fire stopped.