
How to Count Witnessed Meteorite Falls by Country and Century
On this page
Problem statement
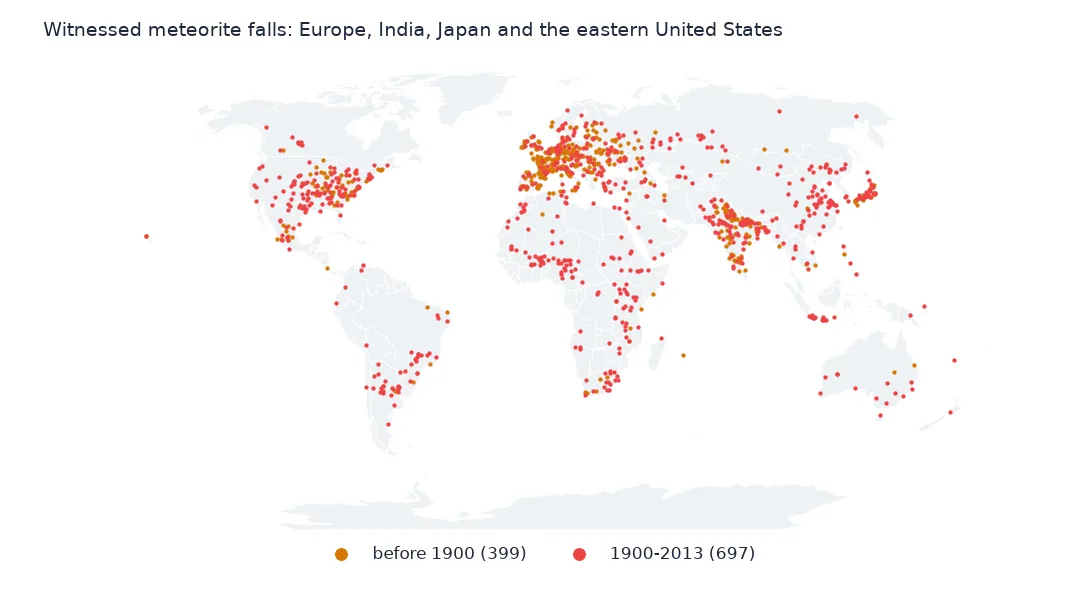
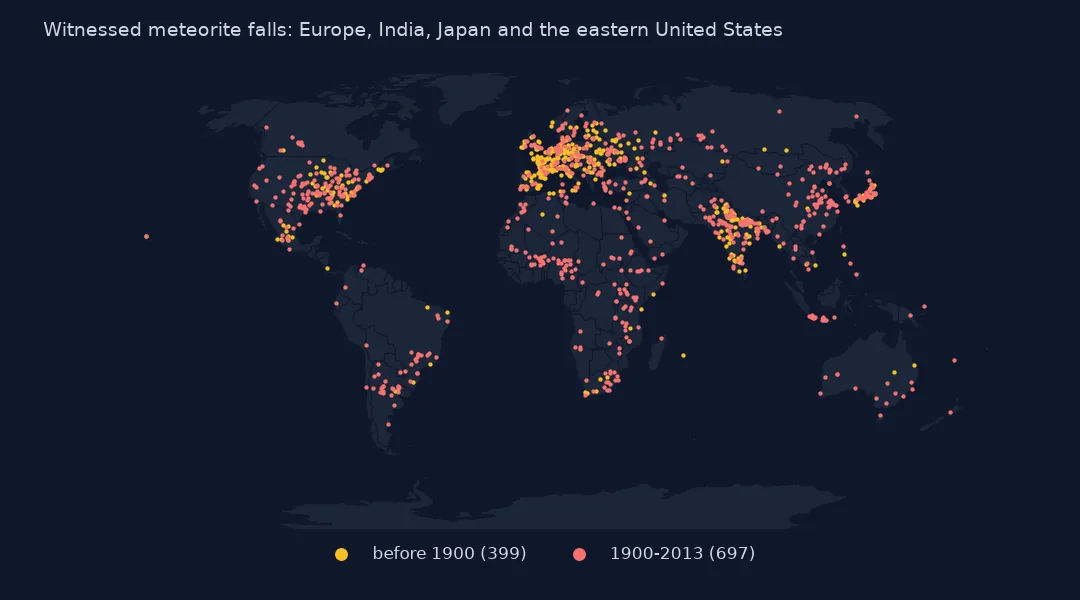
A witnessed fall is a meteorite someone saw or heard arrive and then recovered. Only 1,107 of the 45,716 meteorites in NASA's Meteorite Landings table are falls, but they are the part of the record that is not shaped by expeditions to the ice and the deserts. Meteorites land evenly across the globe, so a map of falls should be a map of where people were watching. This page counts the falls by country and century, puts them on a per-area footing, and tests how closely they follow population density.
Quick answer
Keep the falls with a position and join them to countries:
ok = met.reclat.notna() & ~((met.reclat == 0) & (met.reclong == 0))
fell = met[(met.fall == "Fell") & ok]
g = gpd.GeoDataFrame(fell, geometry=gpd.points_from_xy(fell.reclong, fell.reclat), crs=4326)
world = gpd.read_file("data/ne_110m_admin_0_countries.zip")[["ADMIN", "POP_EST", "geometry"]]
j = gpd.sjoin(g, world, how="left", predicate="within")
print(f"witnessed falls with a position: {len(g):,} of {(met.fall == 'Fell').sum():,}")
print(j.ADMIN.fillna("(coast or sea)").value_counts().head(10).to_string())
witnessed falls with a position: 1,096 of 1,107
ADMIN
United States of America 146
India 124
France 61
China 57
Russia 49
Japan 41
Italy 31
Germany 31
Ukraine 30
Spain 24
1,096 of the 1,107 falls have a position. The United States has the most, 146, then India with 124, France 61, China 57 and Russia 49. Japan, Italy, Germany, Ukraine and Spain complete the ten. These are large or crowded countries with a long habit of reporting falls to scientists, not places where more meteorites land.
When and where people saw them fall
1. By century
print(fell.groupby(pd.cut(fell.year, [0, 1700, 1800, 1850, 1900, 1950, 2000, 2014], right=False)).size().rename("falls").to_string())year
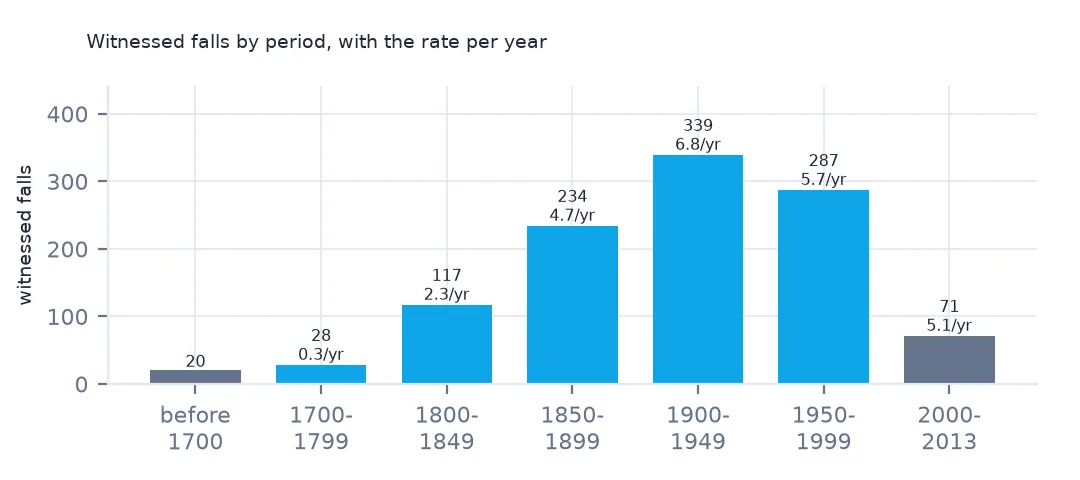
[0, 1700) 20
[1700, 1800) 28
[1800, 1850) 117
[1850, 1900) 234
[1900, 1950) 339
[1950, 2000) 287
[2000, 2014) 71
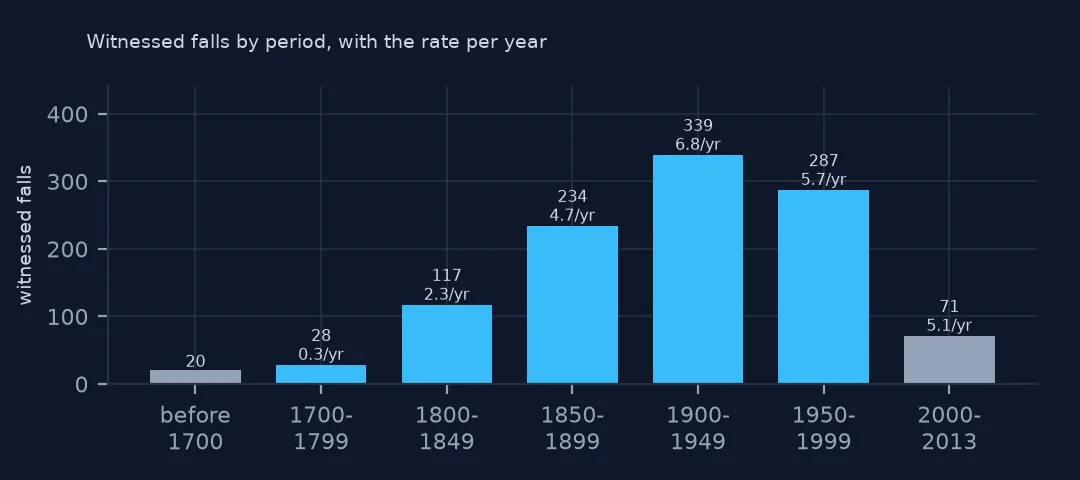
Twenty falls in the table predate 1700 and 28 the 18th century; scientists did not accept that stones fall from the sky until the early 1800s. Then the count jumps: 117 falls in the first half of the 19th century, 234 in the second, 339 from 1900 to 1949. It drops to 287 in the second half of the 20th century and 71 from 2000 to 2013. Part of the late drop is lag: a fall can take years to be classified and entered, and NASA's copy stops in 2013.
2. Falls per area and per person
w = world.set_index("ADMIN")
w["km2"] = world.to_crs("+proj=moll").set_index("ADMIN").area / 1e6
c = j.ADMIN.value_counts()
t = pd.DataFrame({"falls": c, "per_million_km2": c / w.km2.reindex(c.index) * 1e6, "density": w.POP_EST.reindex(c.index) / w.km2.reindex(c.index)})
t = t[t.falls >= 10].sort_values("per_million_km2", ascending=False)
print(t.round(1).to_string())
falls per_million_km2 density
ADMIN
Czechia 13 160.3 131.5
Japan 41 101.2 311.5
Italy 31 98.3 191.3
France 61 94.5 103.9
Germany 31 86.9 232.9
United Kingdom 18 72.2 267.9
Ukraine 30 52.4 77.6
Spain 24 47.7 93.6
Poland 13 42.0 122.6
India 124 39.3 432.7
Burkina Faso 10 36.6 74.4
Nigeria 16 17.6 220.6
Pakistan 15 17.1 246.9
United States of America 146 15.3 34.5
Turkey 12 15.0 104.3
South Africa 18 14.7 48.0
Mexico 19 9.6 64.5
Argentina 23 8.2 16.1
Indonesia 15 8.2 147.9
China 57 6.0 148.2
Russia 49 2.9 8.5
Brazil 22 2.6 24.7
Australia 14 1.8 3.3
Canada 16 1.6 3.8
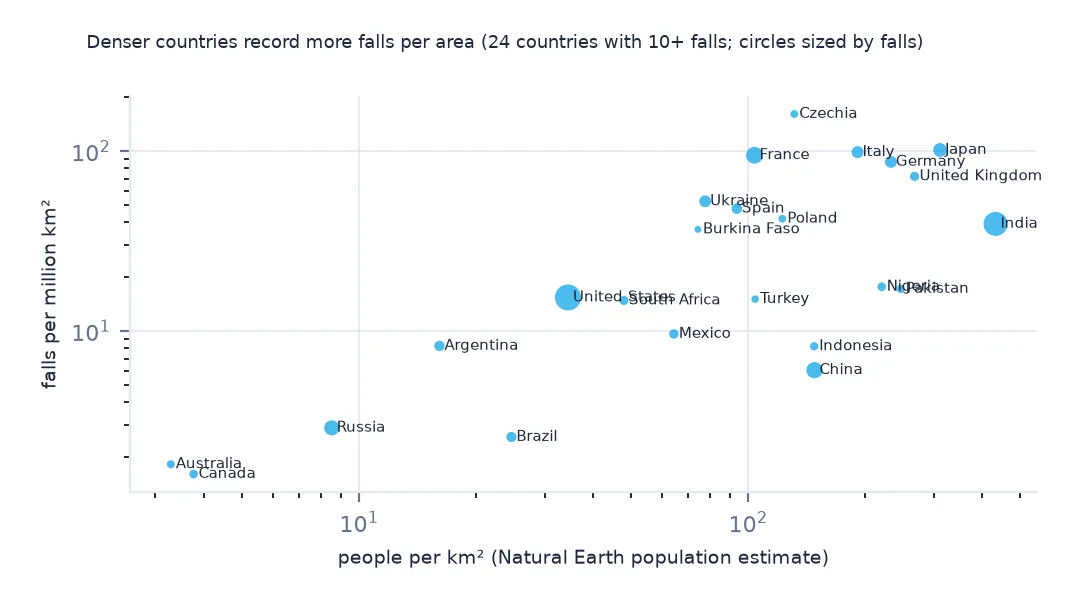
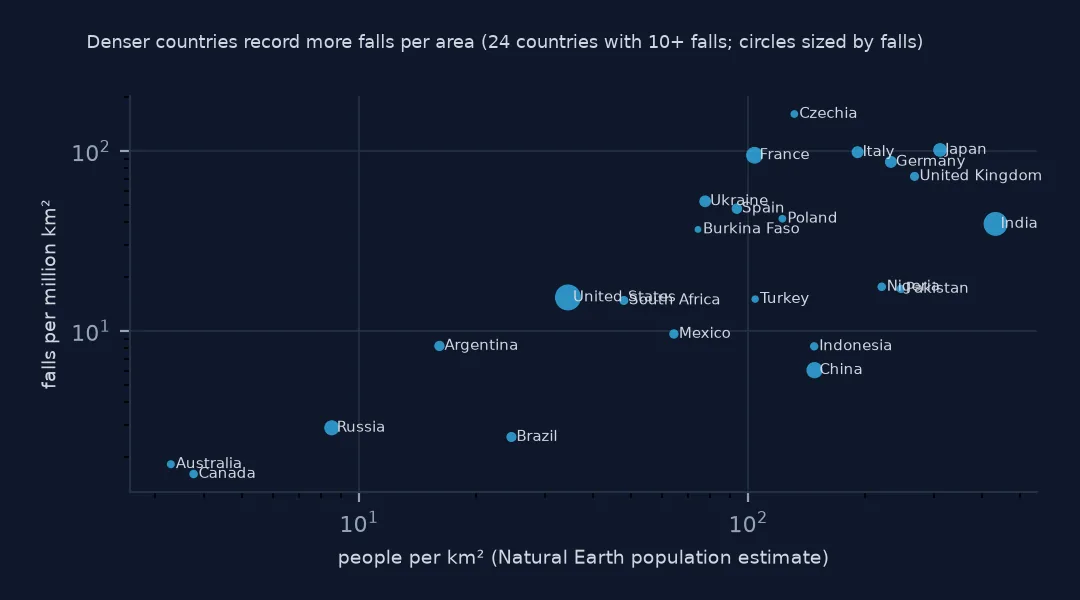
Per area, Europe and Japan lead. Czechia has 160 falls per million km², Japan 101, Italy 98, France 95 and Germany 87. The United States, first by count, has 15.3, and the big, thinly peopled countries come last: Russia 2.9, Brazil 2.6, Australia 1.8 and Canada 1.6. India, the most crowded country in the list at 433 people per km², has only 39 per million km², below the European countries with a third of its density.
3. Do falls follow people?
from scipy.stats import spearmanr
r = spearmanr(t.per_million_km2, t.density)
print(f"countries with 10+ falls: {len(t)}; Spearman rank correlation of falls per area with people per km²: {r.statistic:.2f} (p = {r.pvalue:.4f})")
countries with 10+ falls: 24; Spearman rank correlation of falls per area with people per km²: 0.65 (p = 0.0006)
Across the 24 countries with ten or more falls, the rank correlation between falls per area and population density is 0.65, with a p-value of 0.0006. Denser countries do record more falls per km², as they should if the falls are spread evenly and people find them. The rest of the variation is history: Europe's scientists collected and published falls from the early 1800s on, many countries had no one to send a stone to until much later, and density today is not density in 1850.
Falls since 1950
The data used on this page
NASA's Meteorite Landings table from The Meteoritical Society's records (last updated May 2013) and Natural Earth's 1:110m countries with their population estimates, public domain, both saved on this site on 28 October 2026. Areas are computed in the Mollweide equal-area projection. Population estimates are recent, while the falls span centuries.
from pathlib import Path
import json
import zipfile

import geopandas as gpd
import numpy as np
import pandas as pd
import requests

Path("data").mkdir(exist_ok=True)
# NASA's Meteorite Landings table (The Meteoritical Society's records as NASA last updated them, May 2013), every
# fireball in NASA/JPL's Fireball Data API, and Natural Earth's countries and land. Saved 28 October 2026.
# Live: https://data.nasa.gov/docs/legacy/meteorite_landings/Meteorite_Landings.csv
#       https://ssd-api.jpl.nasa.gov/fireball.api?vel-comp=true
ARCHIVE = "nasa-meteorites-2026-10-28.zip"
if not Path(f"data/{ARCHIVE}").exists():
    Path(f"data/{ARCHIVE}").write_bytes(requests.get(f"https://data.spatialworkflow.io/{ARCHIVE}", timeout=600).content)
Z = zipfile.ZipFile(f"data/{ARCHIVE}")
met = pd.read_csv(Z.open("Meteorite_Landings.csv")).rename(columns={"mass (g)": "mass_g"})
for f in ["ne_110m_admin_0_countries.zip", "ne_50m_land.zip"]:
    Path(f"data/{f}").write_bytes(Z.read(f))
print(f"Meteorite Landings: {len(met):,} meteorites")
Meteorite Landings: 45,716 meteorites
Example 1: falls since 1950 by continent
wc = gpd.read_file("data/ne_110m_admin_0_countries.zip")[["ADMIN", "CONTINENT"]].set_index("ADMIN").CONTINENT
recent = j[j.year >= 1950]
print(recent.ADMIN.map(wc).fillna("(coast or sea)").value_counts().to_string())
ADMIN
Asia 112
Africa 83
North America 62
Europe 58
South America 27
(coast or sea) 9
Oceania 7
Since 1950 the balance has moved away from Europe. Asia recorded 112 falls and Africa 83, against 62 in North America and 58 in Europe. Asia and Africa have large rural populations, where a stone that lands near a village is likely to be seen and picked up. South America has 27 and Oceania 7.
Internal links
- Falls and finds explained — why falls are the fairest sample, and getting the data without code
- Where meteorites were found — the map dominated by finds
- The largest falls — Sikhote-Alin, Jilin and Allende
- NASA's fireball reports — the falls nobody sees, recorded from orbit